
Abstract
O3-type Na[Ni1/3Fe1/3Mn1/3]O2 is a promising positive electrode material for sodium-ion batteries. However, it suffers from structural degradation accompanied by surface-impurity growth during ambient storage and processing. In this study, we synthesized Na1–2yCay[Ni1/3Fe1/3Mn1/3]O2 with y = 0 and 0.02, and studied their structural stability towards ambient exposure. Na0.96Ca0.02[Ni1/3Fe1/3Mn1/3]O2 demonstrated excellent air stability by retaining 0.93 of lattice Na in the original O3 structure after 6 days of ambient storage. Titration experiments confirmed that the presence of Ca in Na0.96Ca0.02[Ni1/3Fe1/3Mn1/3]O2 effectively suppressed the otherwise rigorous Na+/H+ ion exchange in the presence of water. Charge/discharge cycling in half cells suggested that Ca improved the active material's specific capacity and capacity retention by retaining its structural integrity and eliminating surface impurity formation during ambient electrode processing. Finally, the cycling performance of Na0.96Ca0.02[Ni1/3Fe1/3Mn1/3]O2/hard carbon full cells was evaluated with upper cut-off voltages of 4.0 V and 4.1 V. Raising the upper cut-off voltage to 4.1 V resulted in a 20% gain in specific energy, but also accelerated capacity fade and voltage polarization, most likely due to an irreversible phase transition above 4.0 V.
Export citation and abstract BibTeX RIS

This is an open access article distributed under the terms of the Creative Commons Attribution 4.0 License (CC BY, http://creativecommons.org/licenses/by/4.0/), which permits unrestricted reuse of the work in any medium, provided the original work is properly cited.
In a global effort to achieve carbon neutrality, the demand for batteries is soaring in a variety of applications from electrified mobility to grid-scale energy storage. Lithium-ion battery (LIB) producers face uncertainty around price stability and long-term availability of raw materials. Thus, sodium-ion batteries (SIBs) regained research interest due to their low-cost and Earth-abundant constituent elements. Among various sodium-ion positive electrode chemistries, sodium layered transition metal oxides stand out for their wide variety of transition metal redox centers, promising volumetric energy density and good compatibility with existing LIB production infrastructure. As per Delmas's nomenclature, chemically synthesized sodium layered oxides (NaxMO2) usually crystallize in two structures: P2 and O3, distinguished by their Na+ coordination environment (P: prismatic; O: octahedral), and stacking sequence of (MO2)n sheets. 1 This work focuses on O3-type structures because they can accommodate up to 1 Na+ per unit formula and thus give rise to higher energy density than P2 structures in full cells without pre-sodiation.
Studies of sodium layered oxides, NaxMO2 (M=Co, Cr, Ni, Mn, Fe, etc.), in the search of host compounds for alkali ion (de)intercalation date back to the early 1980s. 2–5 Since the successful commercialization of LIB, research attention was diverted away from SIB due to their lower energy density. Another limiting factor for SIB development was the lack of a suitable negative electrode material until Stevens and Dahn reported reversible sodium insertion into hard carbon in 2000. 6 When research interest on sodium layered oxides revived around 2010, many groups focused on compositions with Earth-abundant transition metals, e.g., Fe and Mn, due to cost and sustainability considerations. O3-type α-NaFeO2 reportedly has a reversible capacity of 80 mAh g−1 and a nearly flat voltage profile at 3.3 V vs Na+/Na. 7 When charging above 3.4 V vs Na+/Na, increased voltage polarization was observed and attributed to Fe migration and oxygen oxidation. 7 Monoclinic O3-type α-NaMnO2 has an impressive initial discharge capacity of 180 mAh g−1 in the voltage range of 2–3.8 V vs Na+/Na with a discharge voltage plateau below 2.5 V vs Na+/Na. 8,9 However, complex phase transitions induced by electrochemical (de)sodiation lead to rapid capacity fade of NaxMnO2. 9 In 2009, Komaba et al. reported an O3-type Ni-Mn binary oxide, Na[Ni(II) 0.5Mn(IV) 0.5]O2, for electrochemical sodium (de)intercalation with charge compensation by Ni2,3,4+ redox. 10 Its step-wise voltage profile was attributed to a series of O3-O3'-P3-P3'-P3' phase transitions. 11 In 2012, Kim et al. reported a ternary O3-type Na[Ni1/3Fe1/3Mn1/3]O2 that showed a smooth sloped voltage profile and maintained a reversible specific capacity of 100 mAh g−1 after 150 cycles. 12 In 2013, Komaba et al. systematically investigated the electrochemical performance of NaFeO2-Na[Ni0.5Mn0.5]O2 solid solutions with x = 0, 0.4, 0.6 and 1. They found that Na[Fe0.4(Ni0.5Mn0.5)0.6]O2 delivered an initial specific capacity of ∼130 mAh g−1 in the voltage window of 2–3.8 V vs Na+/Na, and demonstrated relatively good capacity retention with small voltage polarization and satisfactory rate capability. 13 In recent years, many research efforts have been devoted to understanding and improving the electrochemical performance of Na[Ni1/3Fe1/3Mn1/3]O2 (NFM111) for SIB applications. 14–25 In particular, an operando XRD study suggested NFM111 undergoes reversible O3-P3 structural transformation between 2 and 4 V vs Na+/Na, 25 and a NFM111/hard carbon pouch cell study reported a remarkable capacity retention of 92% after 1,000 cycles to an upper cut-off voltage (UCV) of 3.8 V with optimized electrolyte. 16
Despite improvements in cycling stability, air sensitivity of NFM111 remains a challenge for practical application. Kubota and Komaba reported Na+/H+ exchange and NaOH formation when hygroscopic O3-Na[Ni0.5Mn0.5]O2 was exposed to air, which potentially caused slurry gelation, polyvinylidene difluoride (PVDF) binder defluorination, and even aluminum foil corrosion. 26 When Zheng et al. conducted a controlled-atmosphere storage experiment, they confirmed moisture in ambient air was indeed the leading cause of Na[Ni0.5Mn0.5]O2 air degradation. 27 A detailed air degradation mechanism for NFM111 is still lacking, but its reactivity towards CO2 and H2O as well as Na+ loss and Na2CO3 formation upon ambient air exposure have been shown. 22 This air-sensitivity requires stringent atmosphere control in materials storage, transportation and handling, which ultimately increases costs. To tackle this issue, surface coatings 21,23 and elemental doping 28,29 have been suggested.
Ca doping has been reported to improve air stability of several sodium layered oxides. It was first mentioned in Kubota and Komaba's 2015 review paper that researchers of Sumitomo Chemical Co., Ltd. successfully suppressed the hygroscopic character of Na[Fe0.4Ni0.3Mn0.3]O2 by Ca doping. 26 Unfortunately, details of the work are not available electronically. In 2019, Zheng et al. reported Ca doping on the Na sites helped to stabilize the NaCrO2 structure during electrochemical cycling and also improved the material's air stability. 30 In 2020, Yu et al. reported 1 at% Ca doping in Na0.98Ca0.01[Ni0.5Mn0.5]O2 improved cycling, thermal and air stability. 31 It is also noteworthy that in 2018, Sun et al. investigated the effect of Ca-substitution on NFM111 and found it improved cycling stability. 18 However, the impact of Ca on air stability of NFM111 remains unexplored.
In this study, we synthesize Na1–2yCay[Ni1/3Fe1/3Mn1/3]O2, y = 0 and 0.02, and investigate their air stability by X-ray diffraction after various times of ambient air exposure. Titration experiments are conducted to probe the materials' reactivity towards water. A non-aqueous washing method is presented that allows one to quantify surface impurities on water-sensitive materials like NFM111. The impact of Ca on specific capacity and capacity retention of NFM111 is evaluated in half cells with Na metal. The electrochemical performance of Na0.96Ca0.02[Ni1/3Fe1/3Mn1/3]O2 at different UCVs is assessed in full cells with hard carbon.
Experimental
Material synthesis
Spherical Ni1/3Fe1/3Mn1/3(OH)2 precursor consisting of 10 ± 0.5 μm (D50) secondary particles was provided by Zoomwe (Hunan Zoomwe Zhengyuan Advanced Material Trade Company, Ltd., Changsha 410000, China). For Na[Ni1/3Fe1/3Mn1/3]O2 synthesis, the precursor was mixed with Na2CO3 (Sigma-Aldrich, powder, ≥99.5%) in a Na/transition metal (TM) ratio of 1.05. For Na0.96Ca0.02[Ni1/3Fe1/3Mn1/3]O2 synthesis, the precursor was mixed with Na2CO3 and CaCO3 (Sigma-Aldrich, powder, ≥99%) in a Na/TM ratio of 1.01 and a Ca/TM ratio of 0.02. After thorough grinding with a mortar and pestle, the mixtures were transferred into alumina crucibles and calcined at 680 °C for 5 h followed by 950 °C for 10 h in a Neytech Vulcan Muffle furnace. After calcination, the products were taken out of the furnace at 300 °C and sealed in an aluminum bottle to limit air exposure for subsequent characterization and processing. Products were used immediately after synthesis or stored in an argon-filled glove box.
Material characterizations
Powder X-ray diffraction (XRD) was performed on a Siemens D5000 diffractometer equipped with a Cu target X-ray tube and a diffracted beam monochromator. The XRD patterns were collected over a 2θ range of 10–70° with 2 s hold at each 0.02° step. Rietveld refinement was conducted using Rietica Software with the R-3m space group in which Na (and Ca) was assumed to be in 3a sites, transition metals were in 3b sites, and O was in 6c sites. Na occupancy is refined with a fixed thermal factor BNa = 0.80 Å2.
Particle morphology and elemental distribution were investigated with a TESCAN Mira3 Scanning Electron Microscope (SEM) that has a Gatan miniCL imaging system, a backscatter electron detector and an Oxford Instrument INCA X-max 80 mm2 Energy-dispersive X-ray Spectroscopy system (EDS). Cross-sections of samples were prepared using a cross-section polisher (JEOL, IB-19530CP). X-ray photoelectron spectroscopy (XPS) analysis was conducted on a VG Microtech MultiLab ESCA 2000 spectrometer with an aluminum X-ray source (1486.6 eV). The analyzer pass energy was 100 eV for a survey scan and 30 eV for a high resolution scan. The energy calibration was done for C1s (C-C, C-H) at 284.6 eV.
Titration experiments
Acid titrations were performed on a Mettler Toledo G20 compact titrator equipped with a Mettler Toledo InLab Hydrofluoric pH electrode. To collect surface impurities from positive electrode material powders, two washing methods were used: The "water pour" method and an ethylene glycol (EG) wash method. The "water pour" method has been described in previous studies of lithium positive electrode materials. 32,33 It was designed to expose a small amount (0.1 g) of powder to a large quantity (40 ml) of deaerated and deionized (DI) water for just a few seconds through vacuum filtering. The exposure period is expected to be long enough for surface impurities to dissolve but short enough to avoid Li+/H+ exchange between material and water. To confirm the dissolution of most of the surface impurities, the "water pour" procedure is conducted twice, with the first time referred as "1st pour" and the second time referred as "2nd pour."
Inspired by previous reports, 23,34 EG wash was used in this work as an alternative method with a non-aqueous solvent to avoid the rapid Na+/H+ exchange with water. In this method, 0.5 g of sample powder was added into 10 ml of EG and stirred in a sealed glass vail for 15 min with a magnetic stirrer to ensure all surface impurities (mostly NaOH and Na2CO3) dissolve in EG. The mixture was then vacuum filtered through a Whatman grade 202 filter paper to separate the powder and EG solution. All filtrates were collected and diluted with deaerated DI water into 200 ml of homogenous EG-water solution. Finally, 40 ml of this EG-water solution was analyzed by acid titration. In this set of experiments, a 0.0425 M HCl solution was used as the titrant and the titration was terminated at a pH of 3.3.
Electrode preparation
Positive electrodes consisted of 90 wt% active material, 5 wt% PVDF (Kynar 301 F, Arkema), 4.5 wt% Super-S carbon black (Timcal) and 0.5 wt% single wall carbon nanotubes (SWCNT, Tuball, OCSiAl Corporation). These solids were mixed with N-methyl-2-pyrrolidone (NMP) in a solid/liquid mass ratio of ∼0.4 in a planetary mixer (Mazerustar) for 300 s to form a uniform slurry. The resultant slurry was coated on an Al foil with a 76.2 or 152.4 μm notch bar. After drying at 110 °C for 2 h in an ambient atmosphere oven, the coated foils were calendared with a pressure of ∼2,000 atm and punched into circular disks with a 12.75 mm diameter precision punch. The electrodes coated with a 76.2 μm notch bar had an active material loading of 3–4 mg cm−2 and were used in Na-metal half cells. The electrodes coated with a 152.4 μm notch bar had an active material loading of ∼9 mg/cm2. They were used in full cells with hard carbon negative electrodes.
Negative electrodes consisted of 94 wt% hard carbon (Kuraray, Type II, 5 μm), 5 wt% PVDF, 0.5 wt% Super-S carbon black and 0.5 wt% SWCNT. Negative electrodes were processed in the same way as positive electrodes. A hard carbon loading of 3–4 mg cm−2 was achieved by coating the slurry with a 76.2 μm notch bar.
Coin cell assembly
After vacuum drying at 110 °C overnight, the electrodes and 2325-type coin cell hardware were brought into an argon-filled glove box for cell assembly. Half cells were assembled using the positive electrode, four pieces of Celgard 3501 separator, a polyethylene mesh and the Na metal negative electrode with 1 M NaPF6 (LiFun Technology) in diethylene glycol dimethyl ether (diglyme, TCI, >99.0%) as the electrolyte. The polyethylene mesh was sandwiched between the Celgard 3501 separators to avoid short-circuiting by sodium dendrites.
Full cells were assembled using a positive electrode, two pieces of Celgard 3501 and a hard carbon negative electrode with 1 M NaPF6 in a 1:1 w/w mixture of ethylene carbonate (EC) and diethyl carbonate (DEC) from Shenzhen CAPCHEM Technology Co. Ltd. as the electrolyte. Details on the full cell assembly procedure are described elsewhere. 35 Positive and negative electrodes were carefully weighed and matched for a negative/positive (N/P) areal capacity ratio of ∼1.1.
Coin cell cycling protocol
The coin cells were cycled on a Neware Battery Testing System (Shenzhen, China) in a 30 °C temperature box. Half cells were cycled between 2.0 and 4.1 V vs Na+/Na. The first two cycles consisted of a C/20 constant current constant voltage (CCCV) charge with a C/40 current cut-off, and a C/20 constant current (CC) discharge. The following cycles consisted of a C/5 CCCV charge with a C/20 current cut-off, and a C/5 CC discharge. After every 50 C/5 cycles, two C/20 "check-up" cycles were performed to probe low-rate capacity retention.
Full cells were cycled between 2.0 and 4.0 or 4.1 V. The first cycle consisted of a C/20 CC charge, and a C/20 CCCV discharge with a C/40 current cut-off. The following cycles consisted of a C/5 CC charge, and C/5 CCCV discharge with a C/20 current cut-off. Two C/20 "check-up" cycles were performed after every 50 C/5 cycles.
Results and Discussion
Structural analysis
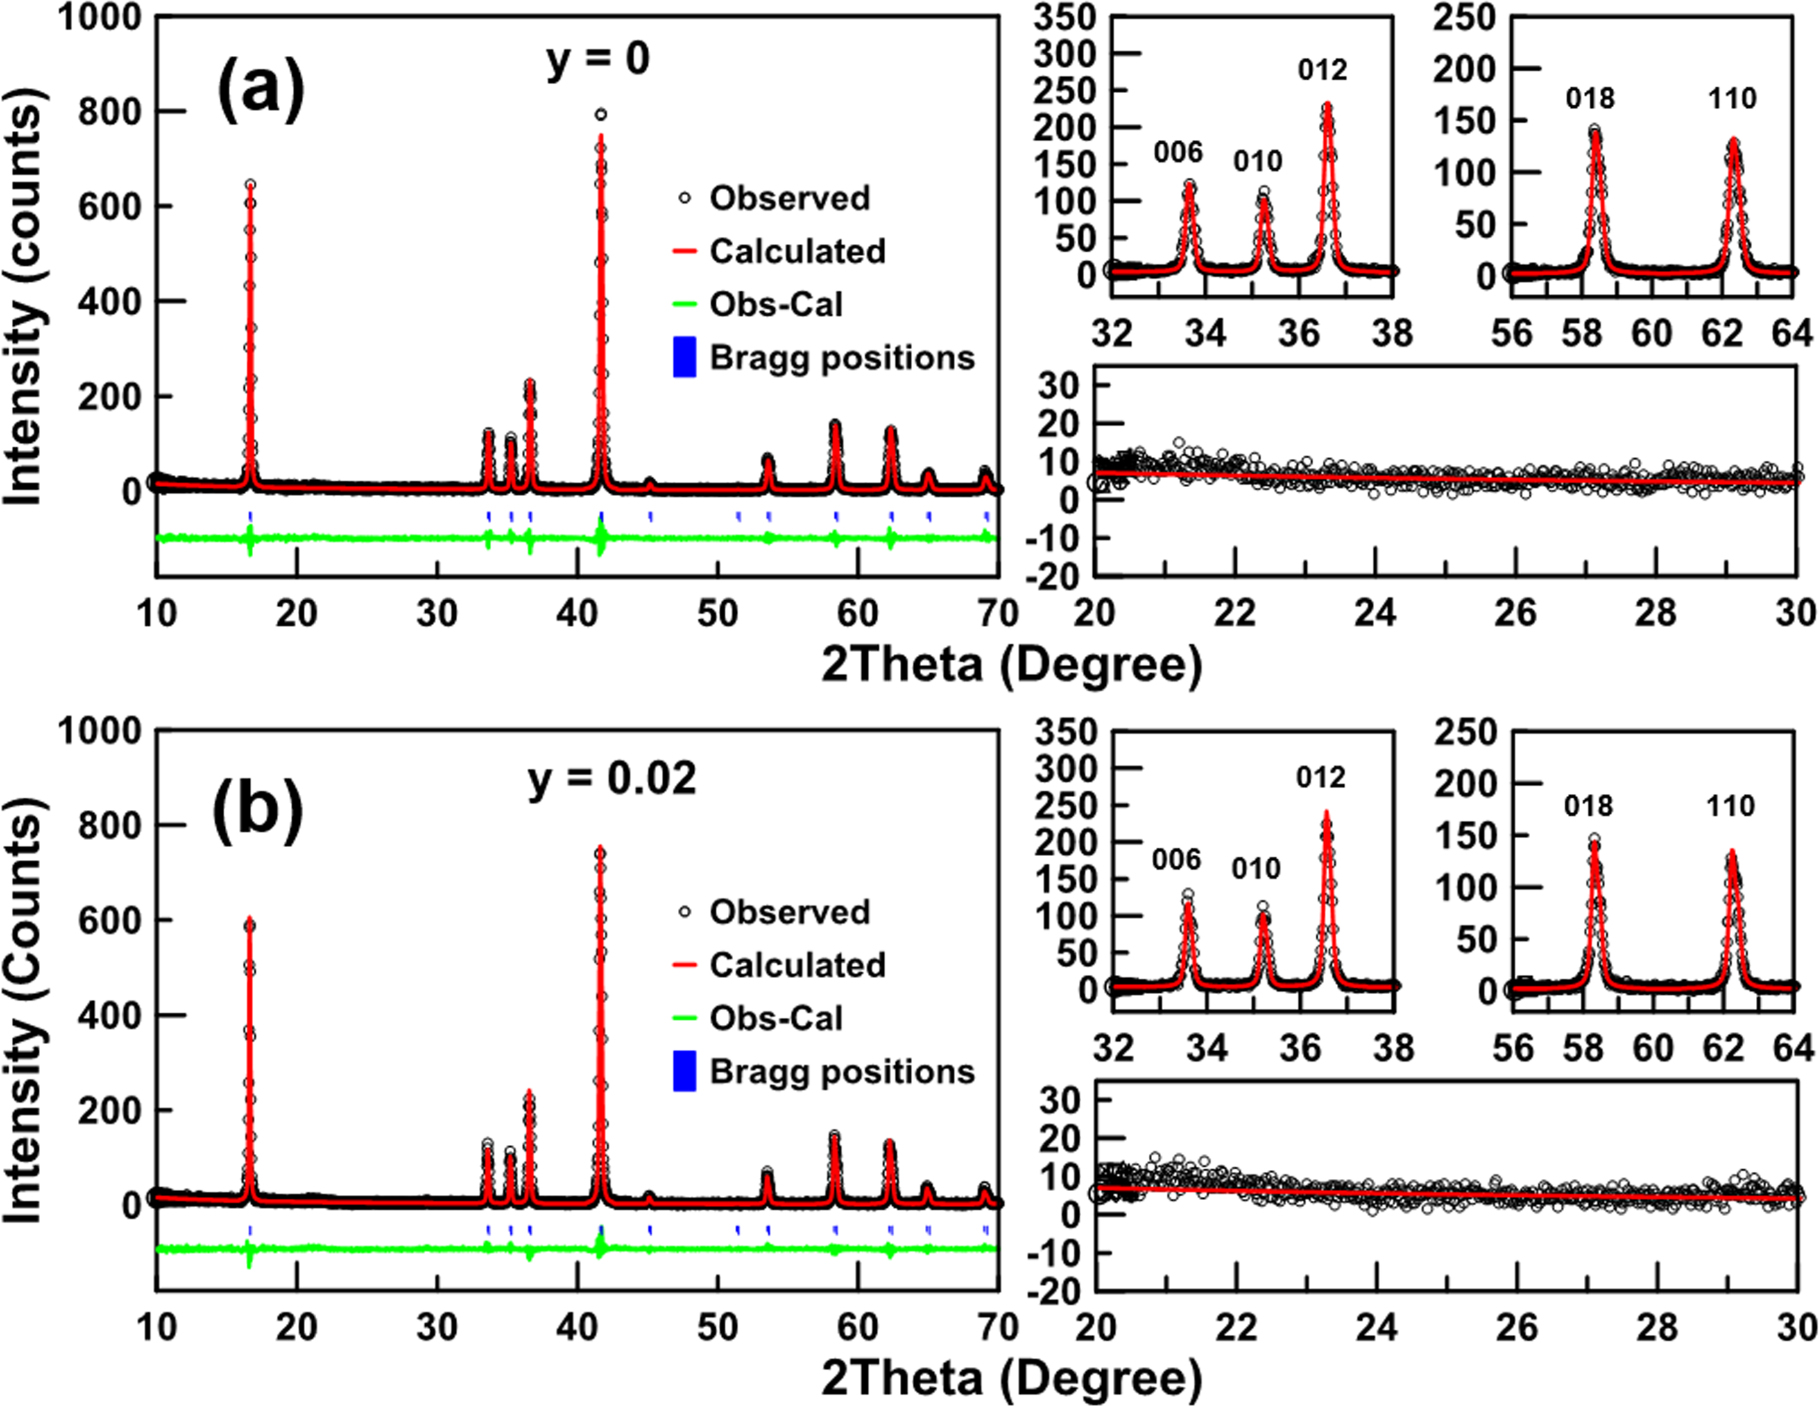
Powder XRD and subsequent Rietveld refinement was used to study the crystal structure of as-synthesized Na1–2yCay[Ni1/3Fe1/3Mn1/3]O2 for y = 0 and 0.02. Figure 1 shows the diffraction pattern of both samples indexed to a α-NaFeO2 type (O3) hexagonal layered structure with a space group of R m. The expanded view shown in the right panel of Fig. 1 shows good agreement between the observed (black) and calculated (red) 006/010/012 and 018/110 reflection peaks with no impurities observed in the scattering angle range of 20–30°. Table I lists the parameters obtained from Rietveld refinement for as-synthesized Na1–2yCay[Ni1/3Fe1/3Mn1/3]O2 with y = 0 and 0.02. Both samples have similar lattice constants, suggesting that Ca2+ (1.00 Å ionic radius) most likely substituted for Na+ (1.02 Å). The size difference between Ca2+ and Na+ on the one hand and Ni2+(0.69 Å), Fe3+(0.55 Å), and Mn4+(0.53 Å) on the other hand, suggests that cation mixing of Ca or Na with the transition metals should be energetically unfavorable, which agrees with previous reports.
30,36
Sun et al. reported that increased Ca content in Na1-xCax/2[Ni1/3Fe1/3Mn1/3]O2 (x = 0.05 and 0.1) causes the c-lattice to expanded because Ca2+ substitution creates more Na+ vacancies. In contrast, Yu et al. reported that substitution of 0.01 mol of Ca2+ in the Na+ sites of O3-Na[Ni0.5Mn0.5]O2 causes the c-lattice to decrease from 15.9244 Å to 15.9152 Å and attributed this change to stronger Ca-O bonding.
31
In our study, the lattice change caused by 2 at% Ca substitution was negligible.
m. The expanded view shown in the right panel of Fig. 1 shows good agreement between the observed (black) and calculated (red) 006/010/012 and 018/110 reflection peaks with no impurities observed in the scattering angle range of 20–30°. Table I lists the parameters obtained from Rietveld refinement for as-synthesized Na1–2yCay[Ni1/3Fe1/3Mn1/3]O2 with y = 0 and 0.02. Both samples have similar lattice constants, suggesting that Ca2+ (1.00 Å ionic radius) most likely substituted for Na+ (1.02 Å). The size difference between Ca2+ and Na+ on the one hand and Ni2+(0.69 Å), Fe3+(0.55 Å), and Mn4+(0.53 Å) on the other hand, suggests that cation mixing of Ca or Na with the transition metals should be energetically unfavorable, which agrees with previous reports.
30,36
Sun et al. reported that increased Ca content in Na1-xCax/2[Ni1/3Fe1/3Mn1/3]O2 (x = 0.05 and 0.1) causes the c-lattice to expanded because Ca2+ substitution creates more Na+ vacancies. In contrast, Yu et al. reported that substitution of 0.01 mol of Ca2+ in the Na+ sites of O3-Na[Ni0.5Mn0.5]O2 causes the c-lattice to decrease from 15.9244 Å to 15.9152 Å and attributed this change to stronger Ca-O bonding.
31
In our study, the lattice change caused by 2 at% Ca substitution was negligible.
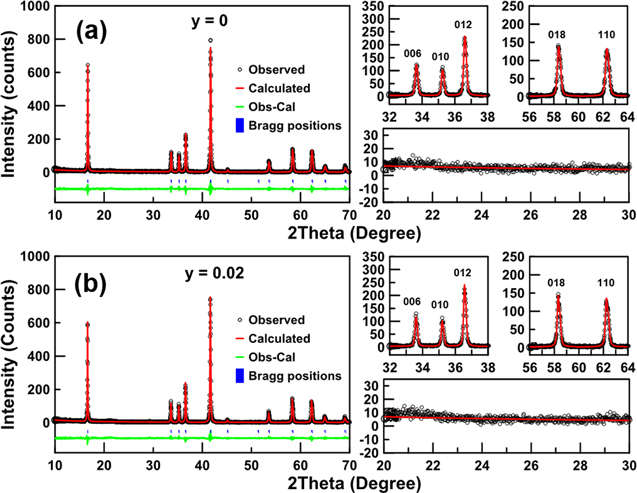
Figure 1. Rietveld refinement of powder XRD patterns of as-synthesized Na1–2yCay[Ni1/3Fe1/3Mn1/3]O2, y = 0 (a) and 0.02 (b). Peaks of interest and impurity region from 20 to 30° are shown in expanded panels on the right.
Download figure:
Standard image High-resolution imageTable I. Parameters obtained from Rietveld refinement of as-synthesized Na1–2yCay[Ni1/3Fe1/3Mn1/3]O2 for y = 0 and 0.02.
| y | a (Å) | c (Å) | RBragg |
|---|---|---|---|
| 0 | 2.9816 | 16.0060 | 3.05 |
| 0.02 | 2.9816 | 16.0057 | 3.77 |
Calcium distribution
EDS was used to analyze the Ca distribution in or on the Na0.96Ca0.02[Ni1/3Fe1/3Mn1/3]O2 particles. Figure 2a shows the SEM image of a secondary particle which is a spherical agglomerate of primary particles in pellet shape with clear facets. Figure 2b shows an SEM image of an electrode cross-section with secondary particles of ∼10 μm diameter, which is the same as the size of the hydroxide precursors. Figure S1 in the Supplementary Information shows SEM images of the hydroxide precursors. Figure 2c shows an EDS map of Ca on the secondary particle surface suggesting that some of this element concentrated on the surface, more specifically, in the void space between primary particles (see right side of the particle). Figure 2d, on the other hand, shows that Ca is also uniformly distributed across the particle bulk with some more concentrated spots towards the surface. Thus, Ca is found both inside the particle bulk and on the particle surface.

Figure 2. SEM images (a and b) and EDS calcium mapping (c and d) of Na0.96Ca0.02[Ni1/3Fe1/3Mn1/3]O2 particles in top-down view (left side) and cross-section (right side).
Download figure:
Standard image High-resolution imageSubsequently, XPS was used to investigate Ca surface specie(s). Figure 3a shows the XPS survey spectrum of as-synthesized Na1–2yCay[Ni1/3Fe1/3Mn1/3]O2 for y = 0 and 0.02. In the y = 0.02 sample, there is a clear Ca 2p signal indicating the presence of Ca surface specie(s). Figure 3b shows the expanded view of the Ca 2p core region in which two types of calcium specifies can be identified. The spin-orbital splitting doublet at 346.81 eV (2p3/2) and 350.41 eV (2p1/2) matched well with CaO or calcite-type CaCO3. 37 Another doublet of peaks at higher energy of 348.95 eV and 352.44 eV can be assigned to Ca in the oxide bulk as the increased ionicity of Ca in layered oxides is believed to cause a chemical shift to higher excitation energy. This peak assignment is supported by Barr's phenomenological view of bonding in mixed oxides, which suggests that when mixing two oxides (AOx and MOy) to form a mixed oxide AzMsOt, the cation A of the more ionic metal oxide AOx becomes even more ionic in the mixed oxide, while the more covalent M sees an increase in covalence. 38 In this case, CaO is more ionic than TM2O3, therefore the ionicity of Ca increases after forming Na1–2yCay[Ni1/3Fe1/3Mn1/3]O2. With the collective results of XRD, EDS elemental mapping and XPS surface analysis, it is believed that the 2 at% Ca was partially doped into the Na sites of the layered oxide, and partially aggregated on particle surface in the form of CaO or CaCO3.

Figure 3. (a) XPS survey spectrum of as-synthesized Na1–2yCay[Ni1/3Fe1/3Mn1/3]O2, y = 0 and 0.02; (b) XPS spectrum of Ca 2p core region of as-synthesized Na0.96Ca0.02[Ni1/3Fe1/3Mn1/3]O2.
Download figure:
Standard image High-resolution imageAmbient air stability
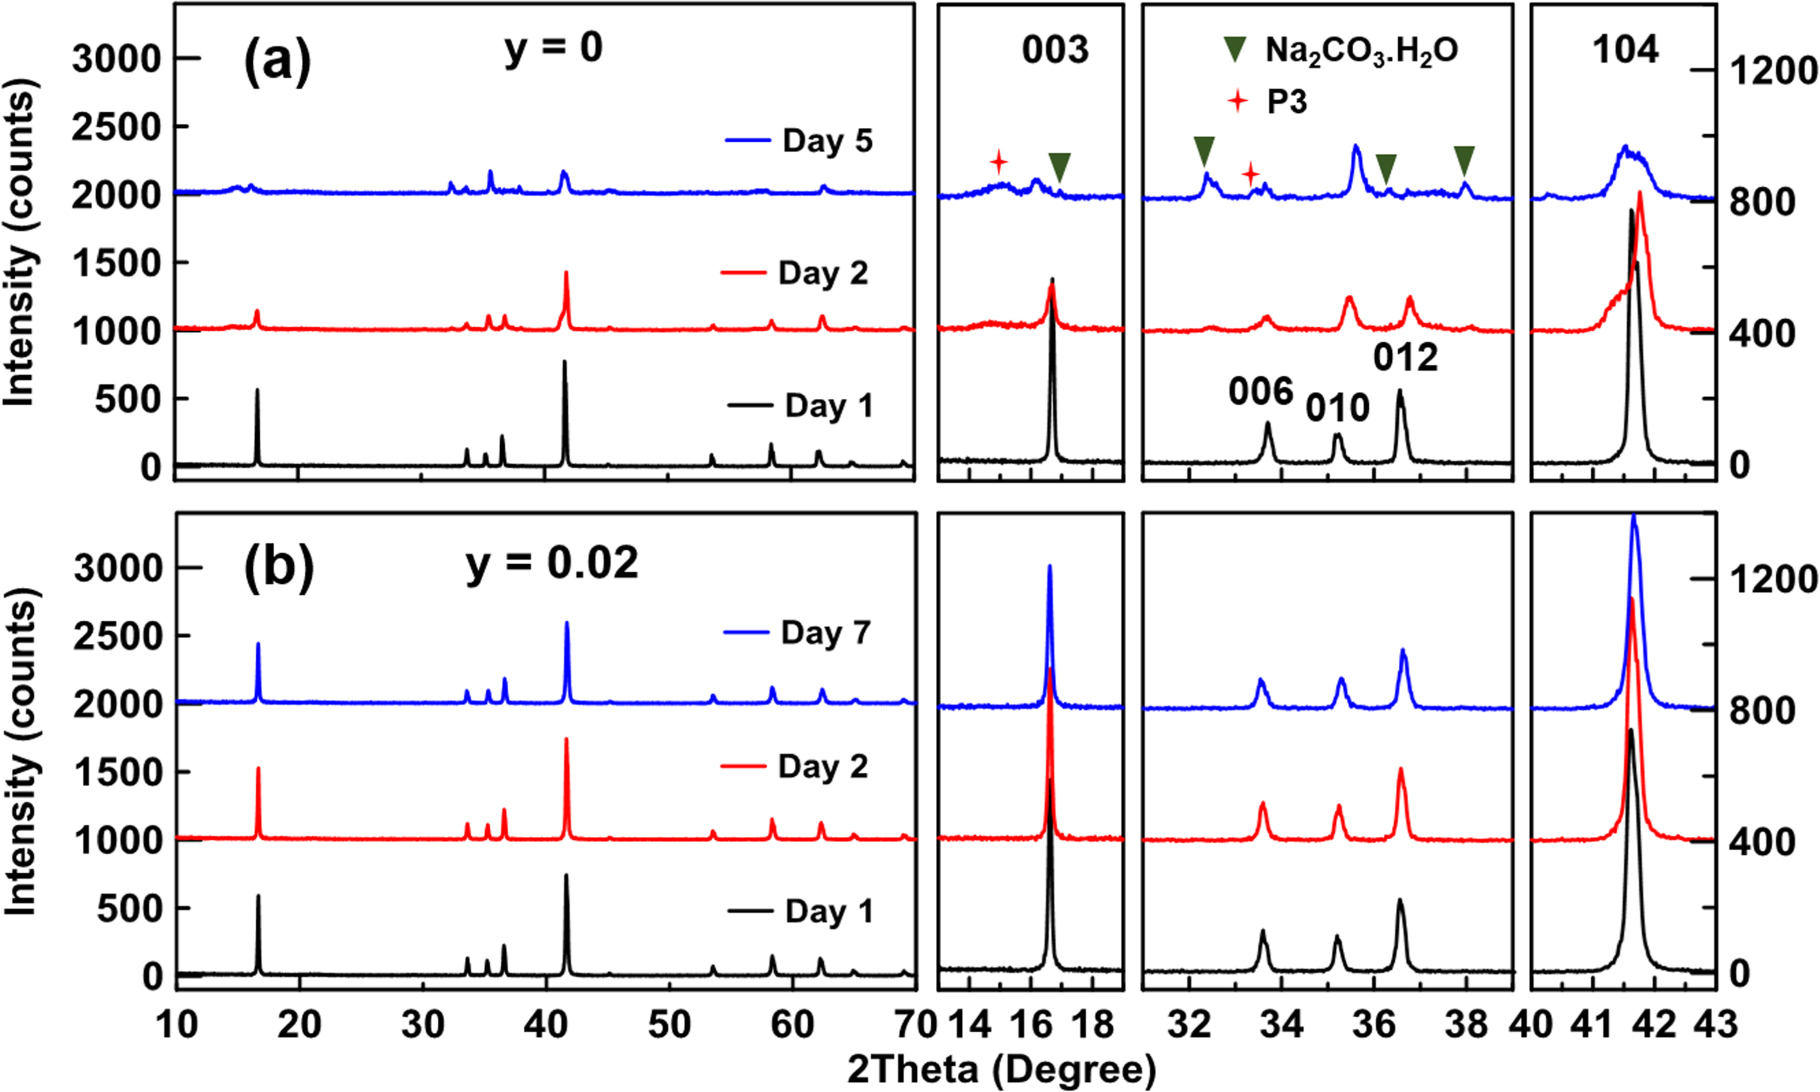
Figure 4 shows the evolution of XRD patterns for Na1–2yCay[Ni1/3Fe1/3Mn1/3]O2 with y = 0 and 0.02 during ambient storage of up to 7 days. In pristine NFM111, the rapid decrease of the 003 and 104 peaks indicates severe O3-structure deformation during ambient storage (see Fig. 4a and its expanded panel). The emerging impurity peaks can be identified as Na2CO3.H2O (green triangles) and a Na-deficient P3 layered oxide (red stars in Fig. 4a). The rapid degradation of pristine NFM111 in air agrees well with previous reports. 22,23 In contrast, Fig. 4b shows the XRD patterns of Na0.96Ca0.02[Ni1/3Fe1/3Mn1/3]O2 with no visible change upon air exposure even after 6 days, suggesting the material retains its original O3 structure with no observable Na2CO3.H2O formation.

Figure 4. Powder XRD patterns of Na1–2yCay[Ni1/3Fe1/3Mn1/3]O2 with y = 0 (a) and 0.02 (b) during storage in ambient condition for up to 7 days. Day 1 is the day the sample was synthesized and taken out of the furnace. Peaks of interest are shown in expanded panels on the right.
Download figure:
Standard image High-resolution imageRietveld refinement of the XRD patterns was then performed to look for subtle changes in the lattice parameters of the O3 structure. Table II lists the evolution of Na0.96Ca0.02[Ni1/3Fe1/3Mn1/3]O2 lattice parameters during storage. There is a slight decrease in the a-lattice parameter and an increase in the c-lattice parameter, indicating minor Na loss. In detail, minor lattice Na loss results in reduced intralayer Na+-Na+ repulsion that leads to a decrease of the a-lattice parameter; it also results in reduced screening of the electrostatic repulsion between negatively charged oxygen layers and thus causes the expansion of the c-lattice parameter. The Na occupancies listed in Table II were obtained from Rietveld refinement with a fixed thermal factor BNa = 0.80 Å2 and confirm the minor Na loss of 4 at% by day 7. It is remarkable that Na0.96Ca0.02[Ni1/3Fe1/3Mn1/3]O2 was able to retain almost all its lattice Na upon one week of storage.
Table II. Change to lattice parameters of Na0.96Ca0.02[Ni1/3Fe1/3Mn1/3]O2 during ambient storage.
| Storage time | a (Å) | c (Å) | Na occupancy |
|---|---|---|---|
| Day 7 | 2.9768 | 16.0272 | 0.93 |
| Day 2 | 2.9808 | 16.0134 | 0.97 |
| Day 1 (As-synthesized) | 2.9816 | 16.0057 | 0.97 |
Water stability
To quantitatively investigate the reactivity of Na1–2yCay[Ni1/3Fe1/3Mn1/3]O2 towards water, acid titrations were performed after exposing the powder samples to water. Since it is difficult to distinguish the ion exchange product NaOH from the common surface impurities NaOH and Na2CO3, a novel washing method was adopted that prevents ion exchange. This method uses ethylene glycol (EG) as a non-aqueous washing agent, which avoids any Na+/H+ exchange and thus allows one to selectively quantify surface impurities. 23,34
To verify the solubility of surface impurities in EG, 5.0 × 10⁻⁴ moles of NaOH and 2.5 × 10⁻⁴ moles of Na2CO3 powder were added into 10 ml of EG. After 15 min of continuous stirring, the mixture became a clear solution without any visible suspension of NaOH and Na2CO3. To perform subsequent acid titration with an aqueous-based pH probe, the EG solution was diluted with deaerated DI water into 200 ml of 5 vol% EG/water miscible solution. Then, 40 ml of the resultant solution was used for acid titration with 0.0425 M HCl in water as the titrant. Figure 5 shows that the titration curve of 1.0 × 10⁻⁴ mol NaOH and 0.5 × 10⁻⁴ mol Na2CO3 in the 5 vol% EG/water solution (black) is almost identical to the one in deaerated DI water (red), suggesting that the probe sensitivity with 5 vol% EG/water solution is the same as in pure water. In titration curves, NaOH and Na2CO3 can be distinguished by their equivalence points; NaOH is a monoprotic base and displays one equivalence point (observed for dash line I in Fig. 5) whereas Na2CO3 is a diprotic base characterized by two equivalence points (observed for dash lines II and III in Fig. 5). 39 In the presence of both species, a superimposed curve is observed (see Fig. 5).

Figure 5. Titration curves for mixtures of 1.0 × 10⁻⁴ moles of NaOH and 5.0 × 10⁻⁵ moles of Na2CO3 either in deaerated DI water (red) or in water with 5 vol% ethylene glycol (black). In both cases, the titrant was a 0.0425 M HCl in water solution.
Download figure:
Standard image High-resolution imageBased on the above validation, the EG wash method was employed to determine the surface impurity content of powders that were exposed in ambient air for one day. Figure 6a shows that pristine NFM111 contains ∼7% of Na surface impurities while Na0.96Ca0.02[Ni1/3Fe1/3Mn1/3]O2 has ∼3%. For both samples the surface impurity is primarily Na2CO3, characterized by the two equivalent points of the titration curves (see Fig. 6a). This result agrees well with the XRD results shown in Fig. 4. It also confirms that the use of EG effectively eliminates Na+/H+ exchange because no monoprotic feature of NaOH is observed in the titration curves (see Fig. 6a).

Figure 6. Titration curves of Na1–2yCay[Ni1/3Fe1/3Mn1/3]O2, y = 0 and 0.02 using (a) EG wash and (b) water pour methods.
Download figure:
Standard image High-resolution imageTo demonstrate the rapid ion exchange of pristine NFM111 with water, Fig. 6b shows the titration curves of filtrates collected with the "water pour" method. As mentioned in the Experimental section, the "water pour" method was designed to collect surface impurities by exposing 0.1 g of sample to 40 ml water for only a few seconds via vacuum filtration to reduce the time available for potential ion exchange with water. 32,33 To ensure the wash is thorough, the "water pour" is usually conducted twice with the filtrates named "1st pour" and "2nd pour," respectively. For lithium layered oxide positive electrode materials, this method is effective at detecting surface impurities while minimizing ion exchange. 32,33 In pristine NFM111, however, Na+/H+ exchange is so rapid that even the brief period of water exposure leads to extraction of a large amount of lattice Na to form ∼10% NaOH in addition to the existing Na2CO3 (see Fig. 6b, solid black line). In the "2nd pour," ∼30% more Na was exacted to form NaOH and the filtrate turned grey indicating transition metal dissolution (see Fig. 6b, dashed black line). Figure 6b also shows the titration curves for the "1st pour" (solid blue line) and "2nd pour" (dashed blue line) of Na0.96Ca0.02[Ni1/3Fe1/3Mn1/3]O2. Interestingly, no extra NaOH formed during either "water pour" besides the existing amount of Na2CO3 already detected by the EG method (see Fig. 6a). This is another impressive demonstration of calcium's ability to stabilize the layered oxide lattice against Na loss, not only during air exposure but also during a brief period of direct water exposure.
The results in Fig. 6 underline the strong reactivity of pristine NFM111 with moisture, which is probably the leading cause of the oxide's degradation in ambient air. Along those lines, Komaba et al. 26 suggested that Na[Ni1/2Mn1/2]O2 undergoes Na+/H+ exchange with moisture in ambient air and forms impurities like NaOH and Na2CO3, which are themselves hygroscopic and lead to more moisture uptake. The exact mechanism by which the only 2 at% of Ca in Na0.96Ca0.02[Ni1/3Fe1/3Mn1/3]O2 suppresses the reactivity towards moisture is not fully understood, yet, and requires future study. Whether the protection effect of Ca applies to other sodium layered oxides is also worth investigating.
Dry air stability
To investigate the materials' stability in dry air, as-synthesized Na1–2yCay[Ni1/3Fe1/3Mn1/3]O2 powders with y = 0 and 0.02 were exposed to air in a dry room for 1 month. Figure 7a shows that the pristine NFM111 contains 1.5% and 2.2% of surface impurities before and after 1 month of dry-air exposure, respectively, indicating 0.7% surface impurities growth during storage. On the other hand, Fig. 7b shows that the as-synthesized Ca-containing NFM111 containing 1% surface impurities did not exhibit any surface impurity growth after 1 month of dry-air exposure. These results suggest that Ca-addition enables long duration storage of NFM111 in dry room atmospheres.

Figure 7. Titration curves of Na1–2yCay[Ni1/3Fe1/3Mn1/3]O2, y = 0 (a) and 0.02 (b) as-synthesized and after 1-month exposure in dry air. Surface impurities were collected using EG wash method.
Download figure:
Standard image High-resolution imageElectrochemical performance
To evaluate the impact of Ca on the electrochemical performance, Na1–2yCay[Ni1/3Fe1/3Mn1/3]O2 (y = 0, 0.02) half cells with Na metal were assembled and cycled. Figure 8a shows their 1st cycle voltage profiles between 2 and 4.1 V vs Na+/Na at C/20 and 30 °C. Comparing to the pristine NFM111 (y = 0, black), Na0.96Ca0.02[Ni1/3Fe1/3Mn1/3]O2 (y = 0.02, blue) shows a lower charge voltage indicating lower surface impedance and higher charge/discharge capacity. Figure 8b shows that Na0.96Ca0.02[Ni1/3Fe1/3Mn1/3]O2 retains a specific capacity of 105 mAh g−1 after 130th cycles, while the pristine NFM111 dropped below 105 mAh g−1 before cycle 40. Figure 8c shows the differential capacity vs voltage curve of the 2nd C/20 cycle. Both materials showed a broad peak during charge between 2.7 and 3.1 V vs Na+/Na and a corresponding sharp peak during discharge. The peaks are associated with the reversible O3-P3 phase transition, and the charge compensation is mostly done via Ni2+/3+ redox. 19,25 Interestingly, the charge and discharge peak intensities are lower in the pristine material, which is indicative of structural degradation and loss of Ni2+/3+ redox. Since the dQ/dV curve was obtained in the 2nd cycle, structural degradation mostly likely happened during electrode preparation in ambient air. Therefore, the positive impact of Ca on specific discharge capacity and capacity retention may stem from the active material's improved air stability.

Figure 8. Na1–2yCay[Ni1/3Fe1/3Mn1/3]O2/Na half cells with 1 M NaPF6 in diglyme cycling between 2 and 4.1 V vs Na+/Na at 30 °C. (a) first cycle voltage profiles; (b) specific discharge capacity and Coulombic efficiency vs cycle number; (c) second cycle differential capacity vs voltage; (d) average charge/discharge voltage vs cycle number.
Download figure:
Standard image High-resolution imageFigure 8d shows the average charge/discharge voltage as a function of cycle number in Na1–2yCay[Ni1/3Fe1/3Mn1/3]O2/Na half cells. Na0.96Ca0.02[Ni1/3Fe1/3Mn1/3]O2 (y = 0.02, blue data) shows less voltage polarization (ΔV) than the pristine NFM111 (y = 0, black data). Voltage polarization can stem from impedance growth and intrinsic changes to the material's voltage curve during cycling, e.g., due to irreversible phase change or transition metal migration. In a situation where impedance growth is the only source of voltage polarization, the change in average charge and discharge voltage should be symmetric. If there are contributions from intrinsic materials change, a decrease in both the average charge and discharge voltage is expected. Figure 8d shows that the pristine NFM111 has rapid decrease in the average discharge voltage but only moderate increase in the average charge voltage. Thus, there is a superposition of impedance growth with intrinsic voltage decay within the first 40 cycles. Na0.96Ca0.02[Ni1/3Fe1/3Mn1/3]O2 shows a more symmetric evolution of the voltage polarization, indicating that intrinsic voltage decay has been mitigated.
There are several hypotheses for the positive impact of Ca on capacity retention and voltage polarization. We believed that Ca protects the active material from degradation during ambient electrode processing, retaining its structural integrity and crystallinity; it also suppresses the formation of surface impurities that are detrimental for the cycling performance. 40 On the other hand, other studies have suggested that Ca doping may stabilize the crystal structure and mitigate volume expansion during electrochemical (de)sodiation. 18,31 To further elucidate the role of Ca in electrochemical performance improvement, a series of Ca substitution concentration and their impact on structural change during electrochemical cycling should be investigated.
Figure 9 shows cycling data for the calcium-containing NFM111 material in full cells with hard carbon negative electrodes. Figure S2 in the Supplementary Information shows a comparison to material without calcium. Figure 9a shows the 1st cycle voltage profiles of the Na0.96Ca0.02[Ni1/3Fe1/3Mn1/3]O2/hard carbon full cells. The 1st cycle charge and discharge capacities with an UCV of 4.1 V are 191 mAh g−1 and 146 mAh g−1, respectively. With an UCV of 4.0 V, they are substantially reduced to 165 mAh g−1 and 126 mAh g−1, respectively. It is worth nothing that 165 mAh/g 1st charge capacity of full cells to 4.0 V is consistent with the 1st charge capacity of half cells to 4.1 V vs Na+/Na (see Fig. 8a), since the hard carbon negative electrode is at ∼0.1 V vs Na+/Na at top-of-charge. For both UCVs, the cells have a similar first cycle Coulombic efficiency (FCE) of ∼77%, which roughly equals the typical FCE of hard carbon (∼85% for the Kuraray material used in this study with additive-free electrolyte) divided by the N/P ratio of 1.1.

Figure 9. Na0.96Ca0.02[Ni1/3Fe1/3Mn1/3]O2/hard carbon full cells with 1 M NaPF6 in EC:DEC cycling between 1.5 and 4.0 V (dashed lines and open symbols) or 1.5 and 4.1 V (solid lines and filled symbols) at 30 °C. (a) first cycle voltage profiles; (b) normalized discharge capacity, (c) specific discharge capacity, (d) average charge/discharge voltage, (e) specific discharge energy and (f) energy efficiency vs cycle number.
Download figure:
Standard image High-resolution image
Figure 9b shows the discharge capacity normalized to the 5th cycle as a function of cycle number. With an UCV of 4.0 V, capacity loss is linear and 85% of the starting capacity can be retained after 130 cycles. With an UCV of 4.1 V, the cell suffered rapid capacity loss in first 20 cycles and then stabilized to a similar loss rate as the 4.0 V cell. Figure 9c shows that the specific discharge capacity is initially higher with an UCV of 4.1 V but converges to the one with 4.0 V after 50 cycles. Figure 9d shows the average charge/discharge voltage vs cycle number. The 4.1 V cell (solid symbols in Fig. 9d) has a downward trend for both charge and discharge voltage over the first 20 cycles. This may correlate with the rapid initial capacity decay observed in Fig. 8b. After 20 cycles, steady impedance growth leads to a symmetric increase in the voltage polarization. The 4.0 V cell (open symbols in Fig. 9d) shows a steady symmetric impedance growth from the start, which is similar to the half-cell results (see Fig. 8d). This observation agrees well with previous reports that there is an irreversible phase transition in NFM111 due to iron migration when charging above 4.0 V vs Na+/Na, which was believed to be the origin of rapid capacity fade and voltage decay in the initial stage of cycling. 19,20
Figure 9e shows an increase in the 1st cycle specific discharge energy from 375 mWh g−1 to nearly 450 mWh g−1 when raising the UCV from 4.0 to 4.1 V. However, this 20% energy gain diminished by cycle 50 due to the rapid capacity decay and voltage polarization. Figure 9f shows the energy efficiency (discharge energy divided by charge energy) vs cycle number. After the Coulombic efficiency has stabilized over the initial cycles, the increasing voltage polarization is the primary cause of the decreasing energy efficiency with cycle number.
In order to achieve and retain a high energy density in Na0.96Ca0.02[Ni1/3Fe1/3Mn1/3]O2/hard carbon full cells, it is necessary to mitigate the irreversible phase transition and Fe migration, which is likely present above 4.0 V. Elemental substitution might be useful in shifting the undesirable phase transition to higher voltage, resulting in more reversible capacity within the O3-P3 phase transition regime. Future studies will also focus on optimized electrolytes with carefully selected solvents, salts, and additives to ensure stable passivation of the hard carbon negative electrode and sufficient voltage stability at the high positive electrode (note that 4.0 V vs Na+/Na in a sodium-ion cell corresponds to 4.3 V vs Li+/Li in a lithium-ion cell).
Conclusions
This work investigated the impact of Ca on the air stability of layered oxide positive electrode materials for sodium-ion batteries by synthesizing Na1–2yCay[Ni1/3Fe1/3Mn1/3]O2 (y = 0 and 0.02) and investigating its structural stability in ambient air and water. Contrary to its Ca-free counterpart, Na0.96Ca0.02[Ni1/3Fe1/3Mn1/3]O2 retained 0.93 lattice Na in its original O3 structure with minimal surface impurity growth after 6 days of air exposure. Titration experiments suggested Na0.96Ca0.02[Ni1/3Fe1/3Mn1/3]O2 had no Na+/H+ ion exchange with water, whereas Ca-free Na[Ni1/3Fe1/3Mn1/3]O2 lost a total of 40 at% lattice Na during brief contact with water in the "water pour" method. Structural analysis of as-synthesized Na1–2yCay[Ni1/3Fe1/3Mn1/3]O2 (y = 0 and 0.02) suggested that substituting Na with 2 at% Ca neither changed the crystal structure nor the lattice parameters, likely due to the similar ionic radii of Ca2+ and Na+. EDS elemental mapping and XPS surface analysis revealed that Ca was partially doped in the layered oxide, and partially aggregated on the surface of secondary partials of Na1–2yCay[Ni1/3Fe1/3Mn1/3]O2. The protection mechanism of Ca doping/coating was not fully understood and requires future investigation. Electrochemical analysis suggested the presence of Ca improved the specific capacity and capacity retention of Na0.96Ca0.02[Ni1/3Fe1/3Mn1/3]O2 by protecting the material from degradation in air during ambient electrode processing. In Na0.96Ca0.02[Ni1/3Fe1/3Mn1/3]O2/hard carbon full cells, initial energy densities of 375 mWh g−1 and 450 mWh g−1 were achieve by raising the upper cut-off voltage from 4.0 to 4.1 V. However, this 20% energy gain was quickly lost to an irreversible phase transition above 4.0 V causing capacity fade and voltage polarization.
Acknowledgments
This work was funded under the auspices of the NSERC/Tesla Canada Alliance Grant program. The authors would like to thank Dr. Ian Hill for helpful discussion on XPS results.
Supplementary data (0.3 MB PDF) Electron microscopy images of hydroxide precursors used for this work. Cycling data for calcium-containing and calcium-free layered oxide material in full cells with hard carbon negative electrodes.