
Abstract
Dimethyl terephthalate (DMT) is a redox shuttle molecule that leads to unwanted self-discharge of lithium-ion cells. It can be created in situ as a breakdown product of polyethylene terephthalate (PET), which is a surprisingly common polymer for the adhesive tapes found in commercial cells. This study investigates the shuttling mechanism and electrochemical stability of DMT, as well as its impact on the performance of LFP/graphite pouch cells with LiFSI and LiPF6 conducting salts. Cyclic voltammetry shows that DMT has a redox potential of 1.5 V vs Li+/Li and is redox active in the full voltage range of LFP/graphite cells. Ultra-high precision coulometry and open-circuit storage experiments show that DMT lowers the coulombic efficiency, increases the charge endpoint capacity slippage, and dramatically accelerates the reversible self-discharge of LFP/graphite pouch cells. Gas chromatography-mass spectrometry shows that DMT is stable over weeks in cells with LiPF6, but only for several days in cells with LiFSI. A well-insulating solid-electrolyte interphase layer derived from vinylene carbonate can prevent DMT from shuttling. However, VC can be consumed, and passivation layers can deteriorate in aged cells, so the best way to prevent DMT-induced self-discharge of lithium-ion batteries is to eliminate PET components.
Export citation and abstract BibTeX RIS

This is an open access article distributed under the terms of the Creative Commons Attribution 4.0 License (CC BY, http://creativecommons.org/licenses/by/4.0/), which permits unrestricted reuse of the work in any medium, provided the original work is properly cited.
An essential requirement of modern lithium-ion batteries (LIBs) used in consumer electronics, battery electric vehicles or grid energy storage applications is the ability to hold their charge over long periods of time at various temperatures. 1,2 Lithium iron phosphate (LiFePO4 or LFP) is an important Co- and Ni-free positive electrode material with lower cost and higher sustainability than layered transition metal oxides like LiNi0.8Mn0.1Co0.1O2 (NMC811). However, LFP/graphite cells without additives show higher reversible self-discharge after 500 h of open-circuit storage at 40 or 60 °C than NMC811/graphite cells. 3 Furthermore, additive-free LFP/graphite cells with lithium hexafluorophosphate (LiPF6), the most commonly used conducting salt in LIBs, show higher self-discharge than cells with lithium bis(fluorosulfonyl)imide (LiFSI), an alternative salt with higher temperature stability. 3 Here, we will investigate if a redox shuttle can account for these differences.
Recently, Buechele et al. described a parasitic redox shuttle reaction occurring in LIBs that leads to rapid self-discharge in the absence of effective electrolyte additives. 3,4 A redox shuttle is a molecule with sufficient electrochemical stability, diffusivity, and suitable redox potential to reversibly undergo electron transfer reactions at both electrodes in a lithium-ion cell. In a lithium-ion cell, a reversible shuttle can gain an electron at the negative electrode by reduction, diffuse to the positive electrode, lose the electron by oxidation, and then repeat the process many times (see Fig. 1). 5 For every electron that is shuttled from the negative to the positive electrode, a Li+ ion is removed from the negative electrode and intercalated into the positive electrode to ensure charge neutrality. This process lowers the voltage and state-of-charge (SOC) of the battery without consuming lithium and is thus referred to as reversible self-discharge. 6,7
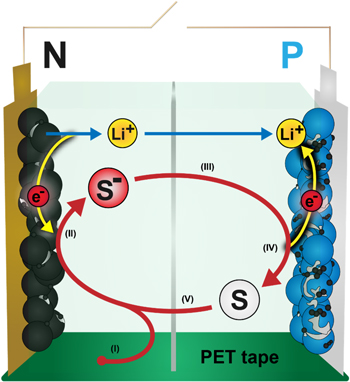
Figure 1. Schematic of the shuttling process of a redox shuttle (S). (I) DMT (S) is created from PET tape. (II) DMT gains an electron at the negative electrode (reduction) and forms the DMT− radical (S−), which gives the electrolyte a characteristic red color. Simultaneously, a lithium-ion (Li+) leaves the negative electrode to ensure charge neutrality. (III) DMT− diffuses to the positive electrode. (IV) DMT− loses an electron at the positive electrode (oxidation). Simultaneously, a lithium-ion enters the positive electrode to ensure charge neutrality. (V) DMT diffuses to the negative electrode and the process repeats from step (II).
Download figure:
Standard image High-resolution imageBuechele et al. identified dimethyl terephthalate (DMT) as a redox shuttle that is created in situ in lithium-ion pouch cells at elevated temperatures between 55 and 70 °C.
8
DMT can cause shuttling currents at an order of magnitude that can explain the complete reversible self-discharge of LFP/graphite cells with additive-free alkyl carbonate electrolyte and LiPF6 within 500 h.
4,9
Adamson et al. showed that DMT is the monomer and decomposition product of polyethylene terephthalate (PET), a common polymer for the adhesive tape used in commercial battery cells to secure the wound or stacked electrodes (see Scheme
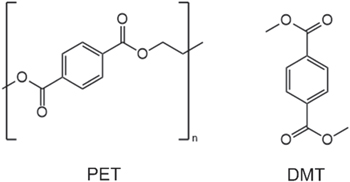
Scheme 1. Chemical structure of polyethylene terephthalate (PET) and dimethyl terephthalate (DMT).
Download figure:
Standard image High-resolution imageIn the literature, there are few reports that describe the redox activity of DMT, and none of them are in the context of batteries. Since DMT shows reversible color change upon electronic stimulation, i.e., reduction and oxidation, it is considered as electronic ink for paper-like electronic imaging devices ("e-paper"). 12–15 DMT is reported to undergo a one-electron reduction to form red/magenta colored DMT− radicals with a maximum absorbance at 530 nm. 13 Practical electronic inks need to be stable in, both, their reduced and oxidized states over a large number of cycles to ensure sufficient service life of the electronic paper. The electrochemical stability and redox potential of DMT changes significantly with the applied voltage, the supporting electrolyte, the use of additives, and the type of electrodes. 12,16 Tanaka et al. used an electrolyte based on tetra-n-butylammonium perchlorate (TBAP) and dimethyl sulfoxide (DMSO), reported DMT to be reduced at −1.6 V vs Ag/AgCl, and showed stable color switching over at least 150 cycles. 15 Kobayashi et al. and Urano et al. measured cyclic voltammograms (CVs) of DMT at a scan rate of 100 10 mV s−1 in TBAP/N-methyl-2-pyrrolidone (NMP) electrolyte and reported more than 1,000 color switching cycles. 13,14 Watanabe et al. reported long-term color switching stability of DMT over 5,000 CV cycles at a scan rate of 50 10 mV s−1 in poly(vinyl butyral) (PVD) based gel electrolyte with NMP solvent and tetra-n-hexylammonium perchlorate (THAP) salt. 12 In Watanabe's setup, the redox potential of DMT was at −1.9 V vs Ag/AgCl. 12
The suitability of DMT as an electronic ink suggests that it can be an effective redox shuttle molecule in LIBs. In this paper, DMT is added to alkyl carbonate electrolyte to study its electrochemical characteristics in the context of LIBs. The redox potential and electrochemical stability of DMT is measured in an optimized two-electrode cyclic voltammetry setup inspired by Boulanger et al. 4 The impact of DMT on the reversible self-discharge of LFP/graphite cells with either LiPF6 or LiFSI based electrolyte is investigated in storage experiments. The presence or absence of DMT after cell storage at elevated temperature is studied with gas chromatography-mass spectrometry (GC-MS). The effect of DMT on the performance of lithium-ion cells during charge/discharge cycling is assessed by ultra-high precision coulometry (UHPC).
Experimental
Electrolyte preparation for coin cell experiments
Coin cell experiments with the known redox molecule Ferrocene (Fc) used ethylene carbonate (EC) and dimethyl carbonate (DMC) solvents at a weight ratio of 15:85 (in the following referred to as CTRL) with 1.5 M LiPF6 and 8.86 mM Fc (Sigma-Aldrich, USA). 17 Coin cell experiments with DMT used diethylene glycol dimethyl ether (diglyme) as solvent and 1.5 M LiPF6 as conducting salt (diglyme + LiPF6). DMT (Sigma-Aldrich, USA) was added at concentrations of 0.5, 1 or 2 wt% (in the following referred to as 05DMT, 1DMT and 2DMT, respectively).
Cyclic voltammetry (CV) in coin cells
Proof-of-concept shuttle experiments with Fc were done in 2325-sized coin cells with a 12.75 mm diameter aluminum foil working-electrode, a metallic lithium foil counter-electrode and either one or five layers of Celgard 2320 as separator (separator stack thickness ∼20 or ∼100 μm, respectively). Shuttle experiments with DMT were done in 2325-sized coin cells with a 12.75 mm diameter copper foil working-electrode, a metallic lithium foil counter-electrode and five layers of Celgard 2320 as separator (separator stack thickness ∼100 μm). Electrodes and separators were wetted with 0.09 ml (∼20 drops) of electrolyte. CVs were measured with a VMP3 potentiostat (Bio-Logic, France) at 10 mV s−1 and 25 °C between 2.6 and 3.75 V vs Li+/Li for Fc studies and between 0.5 and 3.4 V vs Li+/Li for DMT studies. The stability of redox currents was measured over 3 CV cycles for Fc and over 50 CV cycles for DMT, which corresponds to an experiment time of 11.5 min for Fc and 8.04 h for DMT given the above scan rate and voltage limits. CVs from the literature were digitalized using WebPlotDigitizer and their voltages were converted from V vs Ag/AgCl to V vs Li+/Li.
Electrolyte preparation for pouch cell experiments
Pouch cell experiments used the CTRL solvent mix with either 1.5 M LiPF6 (CTRL + LiPF6) or 1.5 M LiFSI (CTRL + LiFSI). Electrolytes containing 2 wt% vinylene carbonate (VC) are abbreviated "+2VC." If DMT was added to the electrolyte after formation, the abbreviation "+DMT(AF)" is used. All electrolyte materials for coin cells and pouch cells were used as-received (<20 ppm water, Shenzhen Capchem, China) and mixed in an Argon-filled glovebox.
Pouch cell assembly and formation
402035-sized lithium-ion pouch cells with two types of artificial graphite negative electrodes (referred as AGB and AGC) and LFP positive electrodes were obtained vacuum sealed without electrolyte (220 mAh nominal capacity, LiFUN Technologies, China). The jellyroll of these cells was held together by PET tape. The pouch cells were opened in an Ar-filled glovebox and dried under vacuum at 120 °C for 14 h, filled with 1 ml of electrolyte, and vacuum sealed at −90 kPa gauge pressure. The abbreviations AGB and AGC for the two different artificial graphites used in this work refer to the same abbreviations used in the work of Eldesoky et al. 18 The physical properties (average particle diameter, specific surface area and tap density) of these graphites can be found in Table I of Ref. 18.
The pouch cells underwent formation on a Maccor Series 4000 test system at formation temperatures, TF, of 40 or 70 °C between 2.5 and 3.65 V. All cells were charged to 1.5 V and then underwent a 16 h voltage hold to ensure wetting of the electrode pores with electrolyte while avoiding dissolution of the copper current collector. The cells then completed a single C/20 formation cycle and a C/10 recharge to 50% SOC.
After formation, cells referred to as "CTRL + 2DMT(AF)" were re-opened in an Ar-filled glovebox, and an additional 200 μl of DMT-containing CTRL electrolyte was added, so that a final DMT concentration of 2 wt% in the total electrolyte volume of 1.2 ml was achieved (∼28 μg DMT per 1.4 g of electrolyte). The cells were subsequently re-sealed under atmospheric pressure to prevent electrolyte loss.
Open circuit voltage (OCV) storage experiments
LFP/AGB pouch cells were used for OCV storage experiments in a temperature-controlled box at 40 °C connected to a Maccor Series 4000 test system. The experimental procedure followed the storage protocol by Sinha et al. 6 (see Fig. 2) and consisted of two full charge/discharge cycles after formation at C/10 to precisely determine the initial discharge capacity (D0), followed by a full charge to the upper cut-off potential of 3.65 V and a constant voltage hold for 10 h and a 500 h OCV storage period. Subsequently, the cells were discharged (D1), charged, and discharged again (D2) at C/10 rate to determine the irreversible (D0-D2) and reversible capacity loss (D2-D1) during storage. Some cells repeated this protocol for a total storage time of 1,000 h.

Figure 2. Test protocol used for the 500 h OCV storage experiments. After formation and full discharge, the cells undergo two C/10 cycles from 2.5 to 3.65 V, a constant voltage hold for 10 h at 3.65 V, the 500 h storage period at OCV (shaded in light gray), a discharge of the remaining capacity, and a final C/10 cycle. Note that only the second one of the initial C/10 cycles is shown. D0, D1 and D2 are the discharge capacities of the half-cycles shaded in dark gray. The total storage loss is defined by D0-D1, D0-D2 represents the irreversible loss and D2-D1 the reversible loss during the 500 h storage period.
Download figure:
Standard image High-resolution imageGas chromatography-mass spectrometry (GC-MS)
After formation, 500 h and 1,000 h OCV storage experiments, pouch cells were opened, filled with 1 ml methyl acetate (MA, Sigma-Aldrich, USA), and stored for 1 week at room temperature to allow electrolyte equilibration. 19 Then, 0.1 ml of the homogeneous MA/electrolyte mixture was transferred into a plastic tube and diluted with 5 ml dichloromethane (DCM) and 1 ml deionized water. The tubes were closed, shaken, and held still for 5 min to ensure complete extraction of the conducting salt in the aqueous layer. The aqueous layer was then removed, and 1 ml of the organic layer was transferred into a GC-MS vial, which was put into the autosampler of an Agilent 7890 gas chromatograph coupled to an Agilent 5977B single-quadrupole 149 mass spectrometer with a 70 eV ion source. The GC was equipped with a BR-5ms 5% phenyl 95% dimethyl arylene siloxane 30 m × 0.25 mm × 1.00 μm column (Bruker Corporation, USA).
Ultra-high precision coulometry (UHPC)
LFP/AGC pouch cells were used for ultra-high precision coulometry experiments on the UHPC system at Dalhousie University described by Bond et al. 20 The cells were cycled at C/20 and 40 °C from 2.5 to 3.65 V for 20 cycles.
Visual inspection of DMT redox activity
Fully charged 402035-sized LFP/AG pouch cells (LiFUN Technologies, China) were opened in an Ar-filled glovebox and dismantled. Pieces of approximately 1 × 1 cm2 were cut out of the positive and negative electrode sheets and put separately into two coin cell bottom cans. 0.1 ml of CTRL + LiPF6 electrolyte with 2 wt% DMT was pipetted onto the fully lithiated golden graphite piece. The color change of the solvent was initiated by applying pressure with a coin cell spacer. The colored electrolyte was then picked up with a pipette and transferred to the fully delithiated positive electrode material in the second can. Photographs were taken to document the color change of the DMT-containing electrolyte during this procedure.
Results
Optimization of coin cell setup using ferrocene (Fc)
A two electrode Li/Al coin cell setup introduced by Boulanger et al. 4 was selected for cyclic voltammetry experiments with Fc. The blocking Al working-electrode ensures that no intercalation reaction is possible, as it would be with a regular battery electrode. First, Fc is used as a well-known redox shuttle model to benchmark the setup for later use with the less familiar shuttle molecule DMT.
Figure 3a shows cyclic voltammograms at a scan rate of 0.1 10 mV s−1 in Al/Li coin cells with 1 separator layer and 8.86 mM Fc added to CTRL + LiPF6 electrolyte in a voltage window of 2.6 to 3.75 V vs Li+/Li, which corresponds to the voltage range of LFP/graphite cells. Since CTRL electrolyte is stable in this voltage range, any faradaic current flow as a function of the voltage sweep is a result of redox shuttle activity. Figure 3a-1 shows that the redox potential of Fc is at ∼3.1 V vs Li+/Li. At this potential, Fc is oxidized to Fc+ during the positive scan and Fc+ is reduced back to Fc during the negative scan. If both oxidation and reduction would happen by heterogeneous electron transfer between the Al working-electrode and Fc, one would expect a symmetric CV shape with positive oxidation peak and negative reduction peak. 21 However, as previously explained by Boulanger et al. 4 and Buechele et al. 8 there is no clear reduction peak in Fig. 3a, since the shuttle molecule diffuses to the Li counter-electrode to be reduced. The asymmetric CV shows relatively high anodic currents of 25 μA and small cathodic currents of −3 μA (see Fig. 3a-1).
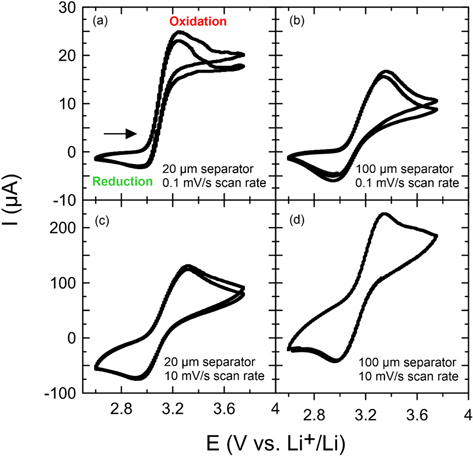
Figure 3. Cyclic voltammograms of coin cells containing 8.86 mM ferrocene added to pristine CTRL + LiPF6 electrolyte. Coin cell (a) has 1 separator and is scanned at 0.1 10 mV s−1, (b) has 5 separators and is scanned at 0.1 10 mV s−1, (c) has 1 separator and is scanned at 10 mV s−1, and (d) has 5 separators and is scanned at 10 mV s−1.
Download figure:
Standard image High-resolution imageTo find the reversible redox potential of DMT, various modifications of the coin cell setup are explored to prevent the shuttle molecule from "escaping" the working-electrode. Figure 3b shows CVs in Al/Li coin cells with five separator layers in order to increase the diffusion path for the shuttle molecule. A more symmetrical CV shape is observed with anodic and cathodic currents of 15 and −7 μA, respectively. Figure 3c shows CVs with one separator layer, but an increased scan rate of 10 mV s−1 in order to decrease the time a shuttle molecule has to diffuse to the counter-electrode. With the faster scan rate a relatively symmetrical CV is obtained with an anodic peak at 120 μA and a cathodic peak at −80 μA. As expected for higher scan rates, the absolute redox currents have increased. 22 Figure 3d shows CVs with, both, more separator layers and increased scan rate. Now a very symmetrical CV shape is obtained with equal peak area for the anodic and the cathodic peaks. This configuration will be used for the coin cell experiments with DMT. The reason why the CV in panel (d) is shifted upwards is currently unclear.
Investigation of the redox activity of DMT in coin cells
In past work by Buechele et al., DMT has not shown a reversible redox peak in the voltage window from 2.6 to 3.75 V vs Li+/Li. 8 DMT could have a significantly lower redox potential than Fc and still act as a reversible shuttle in lithium-ion cells, since the lithiated graphite negative electrode is at ∼0.1 V vs Li+/Li and typical positive electrodes are at >3 V vs Li+/Li. In the following CV experiments, the voltage is swept from 0.5 to 3.4 V vs Li+/Li and copper foil is used as a working-electrode instead of aluminum foil to prevent alloying of lithium with aluminum, which could happen close to the lower voltage limit at ∼0.3 V vs Li+/Li. 23 Importantly, CTRL solvent is no longer stable at these voltages because EC and DMC are reduced at 0.8 and 0.7 V vs Li+/Li, respectively. 24,25 Thus, CTRL is replaced by diglyme, which provides better stability at low voltages. 26,27
Figure 4 shows the resulting CVs from this modified coin cell setup. Figure 4a shows a CV of pristine dyglime + LiPF6 electrolyte (light grey) with small capacitive currents <100 μA and no prominent peaks. Adding different concentrations of DMT to pristine dyglime + LiPF6 electrolyte (0.5, 1, and 2DMT in red) clearly changes the CV shape and leads to 3 distinct features in the first cycle: a strong cathodic peak with a sharp reduction onset at 1.5 V vs Li+/Li (see label I in Fig. 4a) an anodic signal with oxidation onset at ∼2.3 V vs Li+/Li (II), and for 2DMT one can observe an additional anodic peak at ∼1.7 V vs Li+/Li (III). Increasing the concentration of DMT leads to higher cathodic and anodic currents at features I and II, respectively. The inset in Fig. 4a shows the concentration dependence of peak III in a narrower voltage and current window. The comparison with pure diglyme electrolyte and the concentration dependence suggest that DMT is reduced to DMT- below 1.5 V vs Li+/Li (I) and oxidized above that voltage, potentially at ∼1.7 V vs Li+/Li (III).
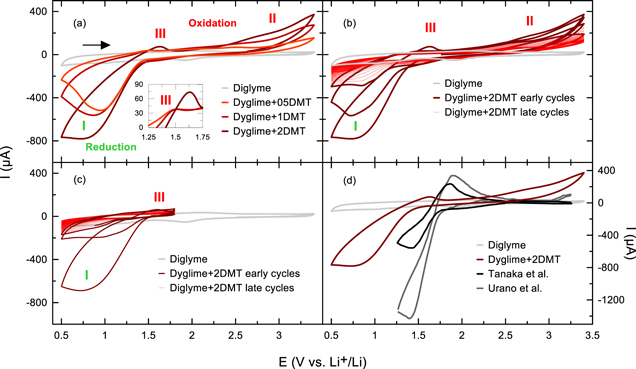
Figure 4. Cyclic voltammograms of coin cells containing either pristine CTRL + LiPF6 or CTRL + LiPF6 + 05DMT/1DMT/2DMT electrolyte. (a) shows the anodic and cathodic currents of pristine electrolyte (grey) compared to pristine electrolyte containing different concentrations of DMT (05DMT in orange, 1DMT in red, 2DMT in dark red) at a scan rate of 10 mV s−1. (b) shows 50 CV cycles of CTRL + LiPF6 + 2DMT at a scan rate of 10 mV s−1. (c) also shows 50 CV cycles of CTRL + LiPF6 + 2DMT, but in a narrower voltage window of 0.5 to 1.8 V. (d) shows the comparison of our first CTRL + LiPF6 + 2DMT cycle at 10 mV s−1 and the CVs of Urano et al. 13 and Tanaka et al. 15 found in the literature.
Download figure:
Standard image High-resolution imageFigure 4b shows 50 CV cycles of the coin cell with dyglime + LiPF6 + 2DMT electrolyte. The strong cathodic peak (I) and the large anodic feature starting at 2.3 V vs Li+/Li (II) decay rapidly in the early cycles (bold lines), but still show some current in the later cycles (fine lines). The small anodic peak at 1.7 V vs Li+/Li (III) disappears after the first cycle. The decrease in the overall redox currents suggests that DMT is not stable over 50 CV cycles in the selected voltage range in this electrolyte system. The relatively high anodic current starting at >2.3 V ( could indicate the oxidative decomposition of the DMT molecules. Thus, the experiment is repeated in a narrower voltage window from 0.5 to 1.8 V vs Li+/Li. Figure 4c shows that the cathodic peak I still decays rapidly, even without accessing voltages of >1.8 V vs Li+/Li. This may either indicate that DMT is not stable at low voltages close to 0.5 vs Li+/Li or that DMT is consumed at the lithium counter-electrode irrespective of the voltage window.
Figure 4d shows a comparison between the first CV cycle with 2DMT electrolyte in our two-electrode coin cell setup (red) and two CV cycles from the literature, one from Tanaka et al. 15 (black) and the other from Urano et al. 13 (grey). Both literature CVs are measured in three-electrode setups with indium tin oxide (ITO) glass as the working-electrode, platinum wire as the counter-electrode, and an Ag/AgCl reference electrode. Tanaka et al. use 5 mM DMT in tetra-n-butylammonium perchlorate (TBAP)/dimethyl sulfoxide (DMSO) and a scan rate of 50 mV s−1; Urano et al. used 5 mM DMT in TBAP/N-methyl-2-pyrrolidone (NMP) and a scan rate of 100 mV s−1. Qualitatively, their CVs look like ours, but the peaks are shifted to higher voltages by about 0.3 V. Their data shows a higher anodic peak at ∼1.8 V vs Li+/Li, which is reasonably close to our anodic peak III at ∼1.7 V vs Li+/Li. Given the decent agreement between our data and the literature data, we conclude that the redox potential DMT lies around 1.5 V vs Li+/Li.
Interestingly, Tanaka et al. 15 and Urano et al. 13 monitored the change in absorbance at 530 nm during their CV experiments and found that the reduction of DMT starting at ∼1.6 V vs Li+/Li in their setup is responsible for the color change of DMT from transparent to red. This color change is fully reversible and could be repeated for over 1000 cycles, 13 indicating that DMT is a highly reversible redox molecule in its appropriate voltage window. The CV of Urano et al. (grey in Fig. 4d) shows the onset of a small cathodic peak at 3.0 V vs Li+/Li, which could indicate the start of an irreversible oxidation reaction, e.g., the oxidative decomposition of DMT. It is possible that the anodic currents beyond 2.4 V vs Li+/Li in our experiments are due to the oxidative decomposition of DMT. If that is the case, the shuttling reaction of DMT in a lithium-ion cell with a positive electrode at a voltage >2.4 V vs Li+/Li would compete with its oxidative decomposition. Many aromatic molecules have low oxidative stability. An investigation of redox shuttle additives for overcharge protection by Wang and Dahn 28 showed that only two out of 60 aromatic shuttle molecule candidates were able to support >100 overcharge cycles. 28 Most molecules were unstable and formed radicals that recombine and polymerize. 7 This could be an alternative explanation for the poor reversibility of DMT in the CV experiments of Fig. 4. Note that Boulanger et al. 4 and Buechele et al. 9 showed that a 14 h hold at 4.2 V and 70 °C can eliminate the DMT redox shuttle. The CV results in Fig. 4 indicate that small rates of oxidative decomposition at lower voltages may be possible. On the other hand, the electrolyte in the coin cells was still red when they were opened for recycling after several weeks, which implies that at least the red DMT- radicals are stable in their reduced form.
Visual investigation of the redox activity of DMT
Figure 5 shows an experiment to visualize the electrochromic properties of DMT. A golden, fully lithiated graphite negative electrode and a fully delithiated LFP positive electrode were extracted from a charged pouch cell with CTRL + LiPF6 electrolyte after formation at 40 °C; small pieces of the two electrodes were put into two separate coin cell cans (see Fig. 5a). A few drops of CTRL + LiPF6 + 2DMT electrolyte were pipetted on the piece of fully lithiated graphite negative electrode (see Fig. 5b). After applying pressure with a coin cell spacer, this resulted in an immediate color change of the electrolyte from transparent to dark red (see Fig. 5c). Subsequently, the red electrolyte was transferred from the negative electrode to the piece of fully delithiated LFP positive electrode with a syringe (see Figs. 5d and 5e). Upon slight pressure with a coin cell spacer, the color change was reversed, and a transparent electrolyte solution was obtained (see Fig. 5f). The transparency of the electrolyte after contact with the positive electrode could be better observed when it is in a syringe (see Fig. 5g). When electrolyte was dropped on an antistatic tissue, one could very clearly see that electrolyte after contact with the negative electrode was dark red, while electrolyte first in contact with the negative electrode and then with the positive electrode was transparent (see Fig. 5h). When this experiment was repeated using CTRL + LiPF6 electrolyte without DMT, no color change was observed. This simple experiment proves that (i) DMT can be reduced at a lithiated graphite negative electrode (∼0.1 V vs Li+/Li), (ii) electrolyte is dark red when it contains DMT in its reduced form, (iii) DMT− can be oxidized at a delithiated LFP positive electrode (3.45 V vs Li+/Li), and (iv) electrolyte is transparent when it contains DMT in its neutral, uncharged form.

Figure 5. Visual investigation of the reversible color change of DMT upon electronic stimulation. (a) shows two coin cells cans, one holding a piece of a fully lithiated, golden graphite negative electrode (left side), the other holding a fully delithiated LFP positive electrode (right side). (b) shows CTRL + LiPF6 + 2DMT electrolyte dropped on the negative electrode. (c) shows the color change of the electrolyte after contact with the negative electrode. (d) shows the red electrolyte containing reduced DMT drawn in a syringe. The red electrolyte is then dropped on the positive electrode (e) and becomes transparent again (f) and (g) (h) shows an antistatic tissue with absorbed electrolytes after contact with the corresponding electrodes.
Download figure:
Standard image High-resolution imageEffect of DMT on the self-discharge of pouch cells
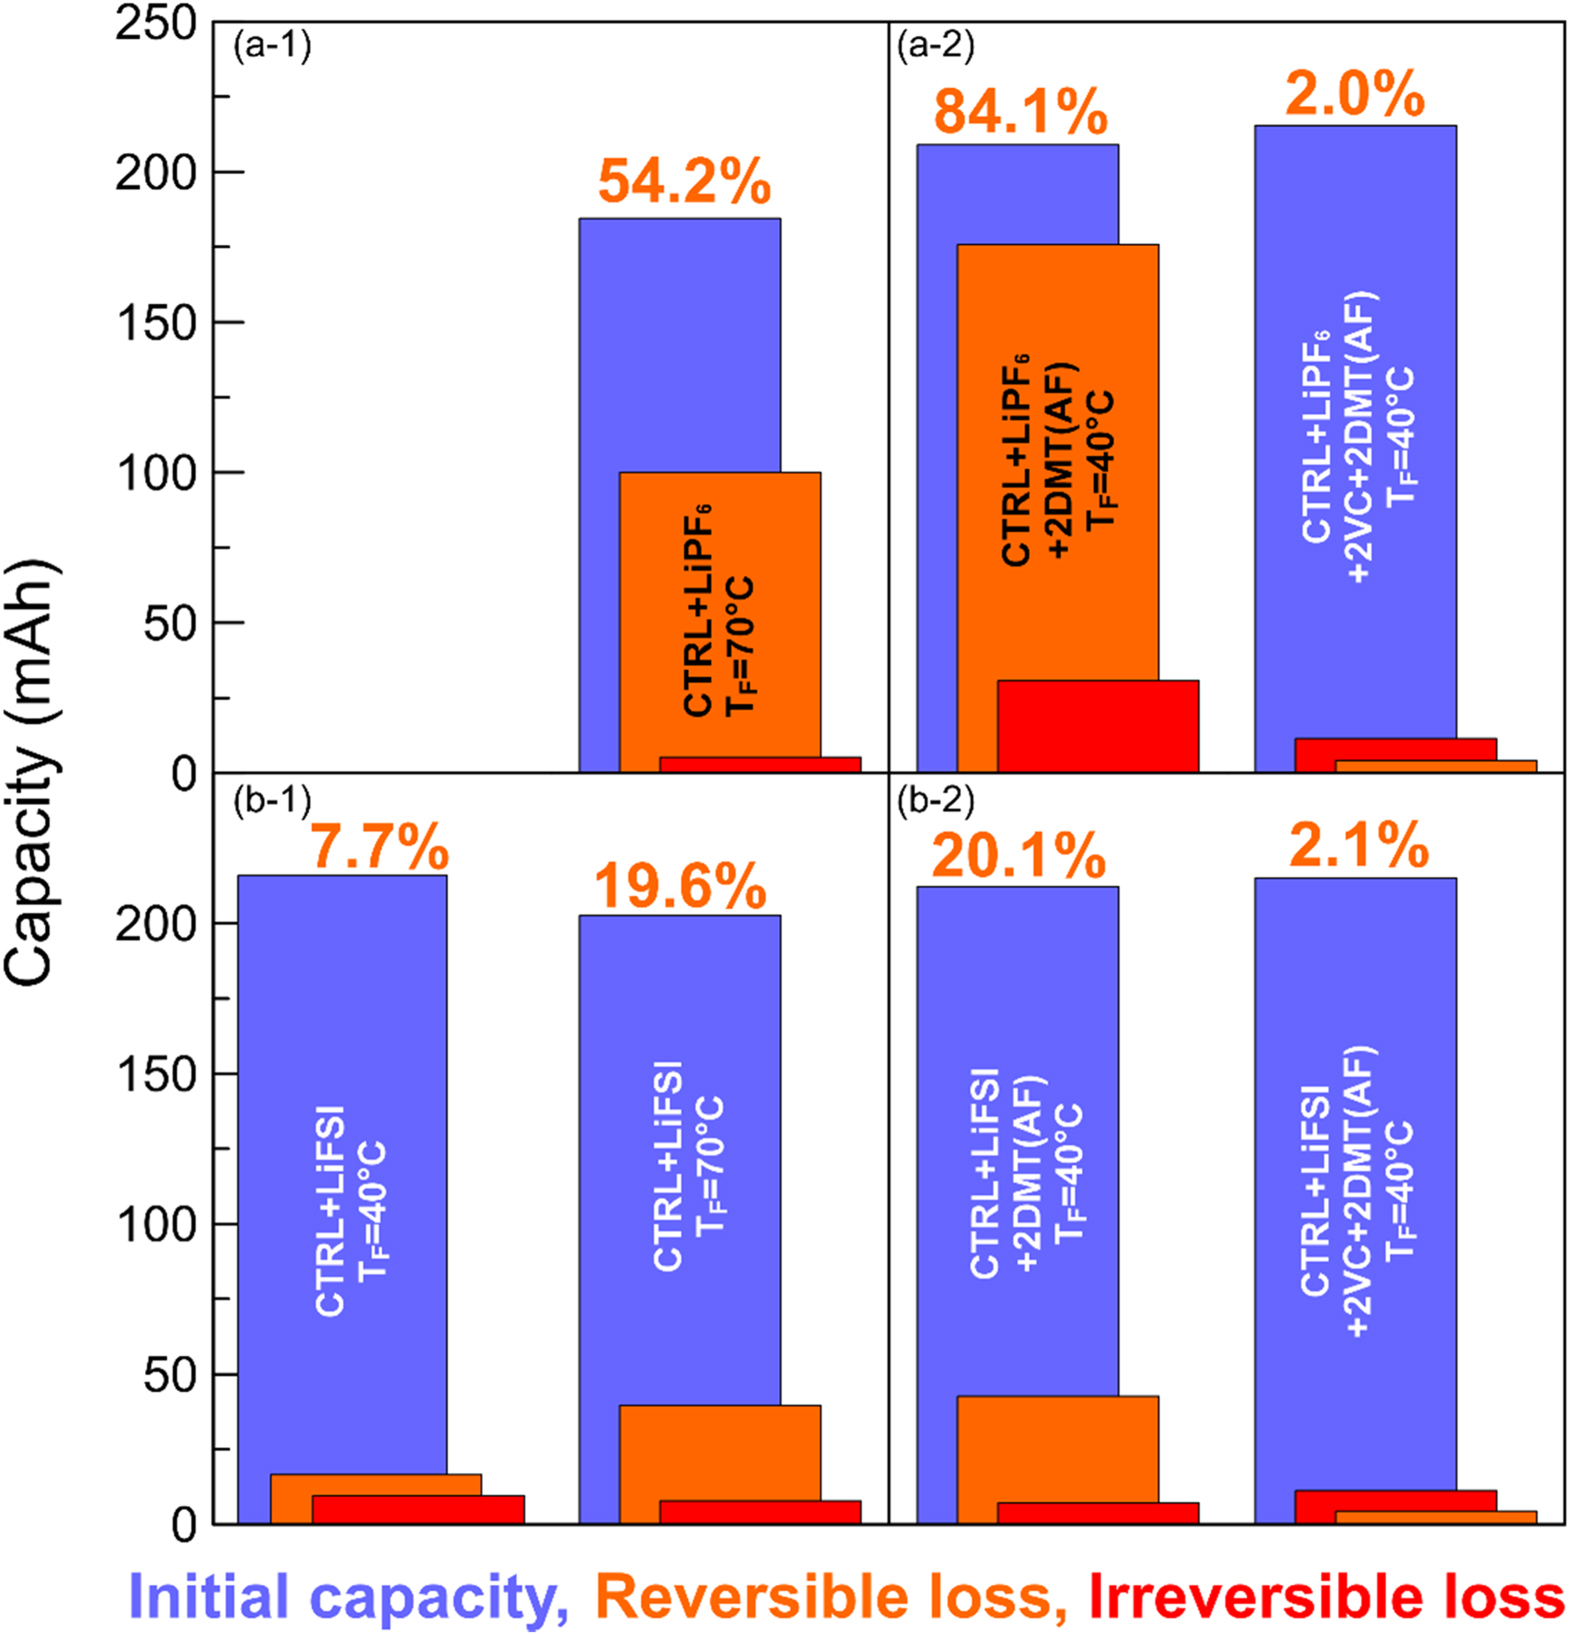
The left side of Fig. 6 shows the voltage drop of LFP/graphite pouch cells with CTRL + LiPF6 (see panel a-1) or CTRL + LiFSI electrolyte (see panel b-1) formed at 40 or 70 °C, during a 500 h open circuit voltage storage experiment at 40 °C. The right side of Fig. 6 shows the same experiment with 2DMT added after formation at 40 °C to LFP/graphite pouch cells with CTRL + LiPF6 and CTRL + LiPF6 + 2VC (see panel a-2) or CTRL + LiFSI and CTRL + LiFSI + 2VC electrolyte (see panel b-2). Figure 7 shows the corresponding values of the initial capacities, reversible capacity losses and irreversible capacity losses of the exact same cells. The TF = 40 °C CTRL + LiPF6 cell is missing from Figs. 6 and 7 since it failed during the storage test. According to Buechele et al., little or no DMT should be formed during storage at 40 °C and DMT should exclusively stem from high temperature formation. 8
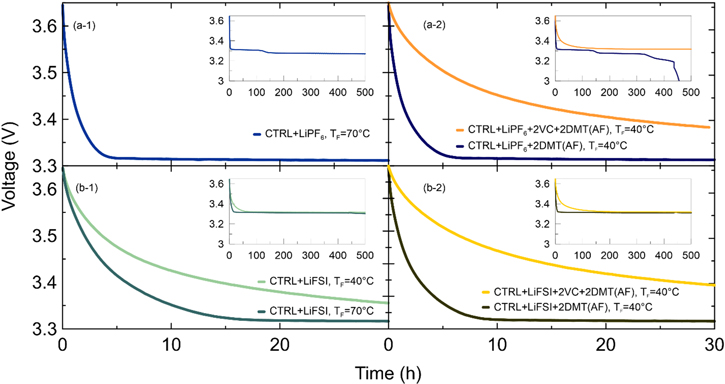
Figure 6. Voltage vs time profiles of pouch cells stored at OCV with (a-1) CTRL + LiPF6 or (b-1) CTRL + LiFSI electrolyte formed at TF = 40 °C or 70 °C. (a-2) and (b-2) show voltage vs time profiles of cells using CTRL + LiPF6 and CTRL + LiFSI electrolyte with and without 2VC, to which 2DMT was added after formation. The larger panels show the first 30 h of storage, the insets show the complete 500 h of storage period.
Download figure:
Standard image High-resolution image
Figure 7. Initial capacity (blue), irreversible capacity loss (red), and reversible capacity loss (orange) of pouch cells after 500 h OCV storage at 40 °C. (a-1) shows cells using CTRL + LiPF6 and (b-1) shows cells using CTRL+LiFSI electrolyte, formed at TF = 40 °C (left) and 70 °C (right). The panels on the right show cells that contain CTRL + LiPF6 (a-2) and CTRL + LiFSI (b-2) electrolyte with and without 2VC, to which 2DMT was added after formation at TF = 40 °C.
Download figure:
Standard image High-resolution imageFigure 6a-1 shows that the pouch cells with CTRL + LiPF6 electrolyte formed at 70 °C shows a rapid voltage drop reaching the first voltage plateau at ∼3.3 V after only 6 h and the characteristic voltage step associated with the staging mechanism of lithium removal from graphite after ∼150 h (see inset of panel a-1). Figure 7a-1 shows that this cell has 54.2% reversible capacity loss after 500 h at 40 °C. Buechele et al. showed that the DMT redox shuttle created in situ during high temperature formation of such cells is responsible for the rapid self-discharge. 9 When 2DMT is intentionally added to CTRL + LiPF6 cells after formation at 40 °C (see Fig. 6a-2, dark blue curve), the voltage vs time profile in the first 30 h resembles that of cells formed at 70 °C without intentionally added DMT (see Fig. 6a-1), but the reversible capacity loss rises from 54.2% to 84.1% indicating even faster self-discharge in the cell with added DMT (see Fig. 7a-2). Note that this cell completely self-discharged in less than 500 h, as can be seen from the inset in Fig. 6a-2 and the sum or reversible and irreversible losses in Fig. 7a-2. Interestingly, when 2DMT is added to CTRL + LiPF6+2VC cells after 40 °C formation, the voltage drop is very slow (see Fig. 6a-2, orange curve) and the reversible capacity loss is only 2.0% (see Fig. 7a-2). This indicates that a well passivating, VC-derived SEI layer on the negative electrode prevents DMT from shuttling and self-discharging the cell.
Figure 6b-1 shows that pouch cells containing CTRL + LiFSI electrolyte need 16 h to reach the ∼3.3 V voltage plateau when formed at 70 °C (dark green curve), but >30 h when formed at 40 °C (light green curve). None of these cells shows the stage 1 to stage 2 transition associated with graphite delithiation (see inset of panel b-1). Figure 7b-1 shows that the increase of formation temperature leads to an increase of the reversible capacity loss from 7.7% (TF = 40 °C) to 19.6% (TF = 70 °C). These results indicate that cells with LiFP6 exhibit more self-discharge than cells with LiFSI, which is consistent with measurements by Logan et al. 3 When 2DMT is intentionally added to CTRL + LiFSI cells after formation at 40 °C, the time to reach 3.3 V decreases from >30 h to 9 h (see Fig. 6b-2, black curve) and the reversible capacity loss increases from 7.7% to 20.1% (see Fig. 7b-2). However, when 2DMT is intentionally added to CTRL + LiFSI + 2VC cells after formation at 40 °C electrolyte, the voltage drop is very slow (see Fig. 6b-2, yellow curve) and the reversible capacity loss is only 2.1% (see Fig. 7a-2)—consistent with the LiPF6 data.
Stability of DMT in pouch cells during storage at elevated temperature
After 500 h of open circuit voltage storage, the pouch cells with CTRL + LiPF6 + 2DMT(AF) and CTRL + LiFSI + 2DMT(AF) electrolyte are opened and the electrolyte is extracted to analyze the remaining DMT content by GC-MS. Buechele et al. showed that DMT has a retention time of 18.2 min under our GC-MS conditions. 8 Figure 8a shows that electrolyte extracted from LiPF6 cells clearly shows a DMT signal at 18.2 min retention time. However, electrolyte extracted from LiFSI cells no longer contains any DMT after the 500 h storage period (see Fig. 8b). Most likely, the consumption of DMT in cells with LiFSI explains why those cells have less reversible self-discharge than cells with LiPF6 (see Fig. 7). The mechanism of DMT consumption in cells with LiFSI is unclear at this point.

Figure 8. GC-MS spectra of electrolyte extracted from cells with (a) CTRL + LiPF6 + 2DMT(AF), and (b) CTRL + LiFSI + 2DMT(AF) electrolyte after 500 h OCV storage at 40 °C.
Download figure:
Standard image High-resolution imageBased on the above results, the pouch cells with CTRL + LiPF6 + 2DMT(AF) and CTRL + LiFSI + 2DMT(AF) electrolyte were recharged and stored for another 500 h at OCV and 40 °C (1,000 h total storage time) to see if the remaining DMT in LiPF6 cells leads to continued self-discharge. Figure 9 shows voltage vs time profiles (panels a-1 and b-1) as well as the initial capacity, reversible capacity loss, and irreversible capacity loss during the second storage period (panels a-2 and b-2).
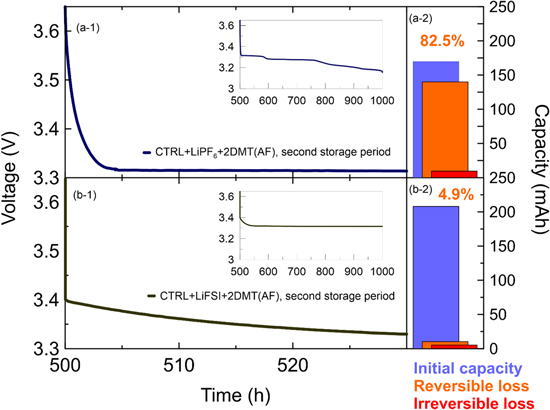
Figure 9. Voltage vs time profiles (left) and bar charts of the initial, reversible and irreversible capacity loss (right) of pouch cells using CTRL + LiPF6 + 2DMT(AF) electrolyte (a-1 and a-2) and CTRL + LiFSI + 2DMT(AF) electrolyte (b-1 and b-2) after the second 500 h OCV storage period at 40 °C (1,000 h total storage time).
Download figure:
Standard image High-resolution imageFigure 9a-1 shows that the voltage drop of the CTRL + LiPF6 + 2DMT(AF) cell is as rapid as in the first 500 h of storage (see Fig. 6a-2, dark blue curve). Figure 9a-2 shows that the initial capacity of the cell has decreased from 205 mAh to 170 mAh, due to the irreversible capacity loss in the first storage period. The reversible capacity loss in the second storage period is 82.5% (see Fig. 9a-2), which is very close to the 84.1% reversible loss in the first storage period (see Fig. 7a-2). Due to the difference in initial capacity, the absolute reversible capacity loss is smaller, yet, this data shows that DMT is a remarkably stable redox shuttle in lithium-ion cells stored at high temperature. It should be noted that, both, formation and storage are at 40 °C, so only very little or no DMT should be generated from PET tape decomposition and most self-discharge should come from the intentionally added 2 wt% DMT.
Figure 9b-1 shows that the cell initially filled with CTRL + LiFSI + 2DMT(AF) show much less self-discharge in the second 500 h storage period at 40 °C, as indicated by the slow decline of the voltage vs time profile. The fact that discharge starts at 3.4 instead of 3.65 V could be an error in the cycling protocol, but it should not affect the results. Figure 9b-2 shows that the reversible capacity loss decreased from 20.1% in the first storage period to 4.9% in the second storage period. Clearly, the slow self-discharge in the LiFSI cells must be due to consumption of the DMT redox shuttle (see Fig. 8b).
Figure 10 shows the GC-MS spectra of electrolyte extracted from CTRL + LiFSI pouch cells that were formed at 40 °C or 70 °C and opened after 1 week of storage at 25 °C or 1,000 h (6 weeks) of storage at 40 °C. Figure 10a-1 shows that no DMT can be found after formation at 40 °C, so it is not surprising that 1,000 h storage at 40 °C also results in no DMT (see Fig. 10a-2). This is consistent with Buechele et al., who showed for CTRL+LiPF6 cells that 40 °C is not warm enough to induce substantial DMT generation. 8 Figure 10b-1 shows that LiFSI cells formed at 70 °C do, however, generate a significant amount of DMT, which is then consumed during storage and absent in Fig. 10b-2. Note that Fig. 10 shows the consumption of in situ generated DMT, whereas Fig. 8 showed the consumption of DMT intentionally added to the electrolyte. The fact that DMT could be generated in LiFSI cells suggests that the in situ formation mechanism of DMT does not depend on the type of salt. This is consistent with Adamson et al., who showed that DMT stems from the lithium alkoxide catalyzed decomposition of PET tape with methanol. 10 Neither of the reactants comes from the conducting salt.
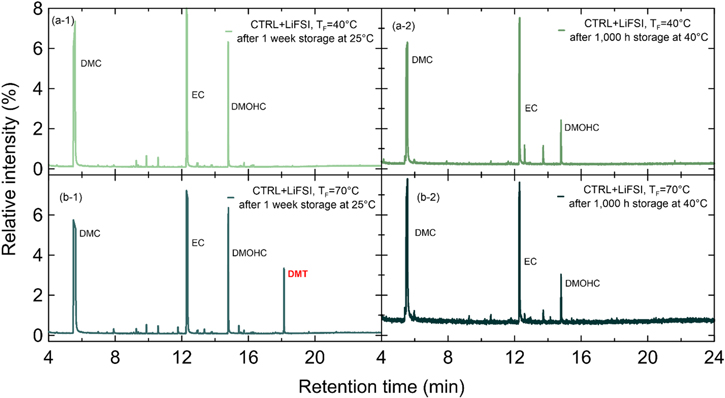
Figure 10. GC-MS spectra of electrolyte extracted from cells with CTRL + LiFSI after formation at TF = 40 °C (a-1) or 70 °C (a-2) and 1 week storage at 25 °C. The right panels show the corresponding cells after 1,000 h of OCV storage at 40 °C (a-2 and b-2).
Download figure:
Standard image High-resolution imageEffect of DMT on ultra-high precision coulometry
Figure 11 shows ultra-high precision coulometry data for LFP/graphite pouch cells with CTRL + LiPF6 (upper panels) and CTRL + LiFSI electrolyte (lower panels). These cells were either formed at 40 °C (light colors) or 70 °C (dark colors). Subsequent cycling on the UHPC system is done at 40 °C and C/20 from 2.5 to 3.65 V. According to Buechele et al., no DMT should be formed during cycling at 40 °C and DMT should exclusively stem from high temperature formation. 8

Figure 11. Ultra-high precision voltage profiles (left), charge endpoint capacity slippage (center), and columbic efficiency (right) of pouch cells cycled 20 times at 40 °C and C/20 containing CTRL + LiPF6 (a-1, a-2, a-3) or CTRL + LiFSI electrolyte (b-1, b-2, b-3). Cells were either formed at 40 °C (light color tone) or 70 °C (dark color tone). UHPC data for CTRL + LiPF6 at TF = 40 °C and 70 °C was measured by Logan et al. 4 and Boulanger et al. 29 respectively.
Download figure:
Standard image High-resolution imageFigure 11a-1 shows that LiPF6 cells formed at 40 °C (light blue) have mostly overlapping charge/discharge curves in the voltage vs capacity plot. They have small charge endpoint capacity slippage of ∼0.4 mAh/cycle (see Fig. 11a-2) and relatively high CE >99% (see Fig. 11a-3). These results do not indicate any major inefficiencies that would stem from a redox shuttle. On the other hand, LiPF6 cell formed at 70 °C (see dark blue data in Fig. 11) show significant slippage of the charge/discharge curves between 4 and 8 mAh/cycle, which leads to a major inefficiency with CE values between 96 and 98%. This is consistent with Boulanger et al. 4 and Buechele et al. 9 who explained that the continuous shuttling of DMT during the charge/discharge cycling leads to a seemingly larger charge capacity (the charger systems has to compensate the chemical self-discharge in the cell with a longer constant current charge) and a seemingly smaller discharge capacity (the charger system only needs a shorter constant current discharge since the redox shuttle also discharges the cell). Effectively, this leads to the slippage of consecutive charge/discharge curves.
Figure 11b-1 shows that slippage in LiFSI cells is much smaller than in LiPF6 cells. Cells formed at 40 °C (light green), in which no DMT is generated (see Fig. 10a-1), show charge endpoint capacity slippage of <0.2 mAh/cycle (see Fig. 11b-2) and CE between 99.5 and 99.75% (see Fig. 11b-3). After high temperature formation at 70 °C, where significant amounts of DMT are generated (see Fig. 10b-1), the LiFSI cells show higher charge endpoint capacity slippage of 0.4 and 1 mAh/cycle (see Fig. 11b-2), and lower CE between 98 and 99.7% (see Fig. 11b-3). It is interesting to note that slippage in LiFSI cells formed at 70 °C is high initially and then slows down (see Figs. 11b-1 and 11b-2). This is consistent with the observation that DMT is consumed in cells with LiFSI (see Fig. 8).
Overall, these results agree well with the self-discharge data presented in Figs. 6 and 7. liPF6 cells, in which DMT is stable for many weeks, show fast self-discharge and more inefficiency than LiFSI cells, in which DMT is consumed. It should be noted that the data for the LiPF6 cell formed at 70 °C in Fig. 11 is from Boulanger et al. 4 and this cell used artificial graphite C (AGC) instead of artificial graphite B (AGB) that is used in all other cells. Eldesoky et al. 18 show that physical and electrochemical properties of these graphites are very similar.
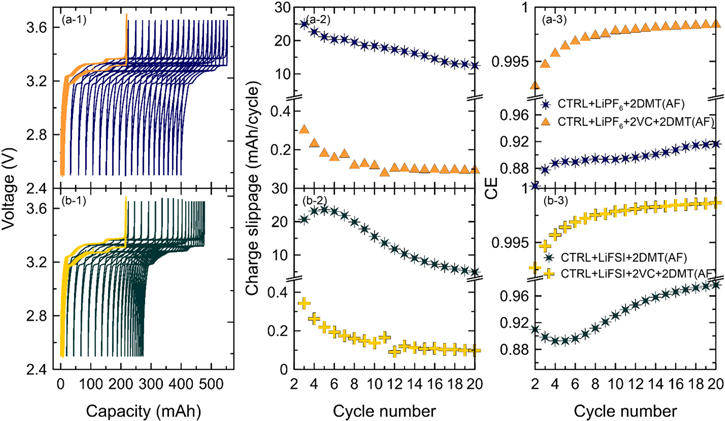
Figure 12 shows similar UHPC experiments with intentionally added 2DMT to LFP/graphite pouch cells after formation at 40 °C with CTRL + LiPF6 and CTRL + LiPF6 + 2VC electrolyte (upper panels) or CTRL + LiFSI and CTRL + LiFSI + 2VC electrolyte (lower panels). Adding 2DMT to CTRL electrolyte after formation (black data in Fig. 12) leads to very high charge endpoint capacity slippage and low CE for, both, cells with LiPF6 and LiFSI. However, it is important to note that the same initial concentration of 2 wt% DMT leads to more slippage in cells with LiPF6 (15–30 mAh/cycle) than in cells with LiFSI (10–25 mAh/cycle). Also, the CE of LiPF6 cells with 2DMT (∼88%) is lower than that of LiFSI cells with 2DMT (∼92%). Consistent with previous results, this can be interpreted as DMT consumption in cells with LiFSI. Note that the charge slippage values are significantly higher when 2DMT is added after formation (see Fig. 12) as opposed to DMT formed in situ (see Fig. 11). This indicates that much less than 2 wt% DMT are formed during formation at 70 °C.
Figure 12. Ultra-high precision voltage profiles (left), charge endpoint capacity slippage (center), and columbic efficiency (right) of pouch cells cycled 20 times at 40 °C with C/20. The upper panels show cells using CTRL + LiPF6 + 2DMT(AF) (black) and CTRL + LiPF6 + 2VC + 2DMT(AF) electrolyte (yellow). The lower panels show cells using CTRL + LiFSI + 2DMT(AF) (black) and CTRL + LiFSI + 2VC + 2DMT(AF) electrolyte (yellow).
Download figure:
Standard image High-resolution image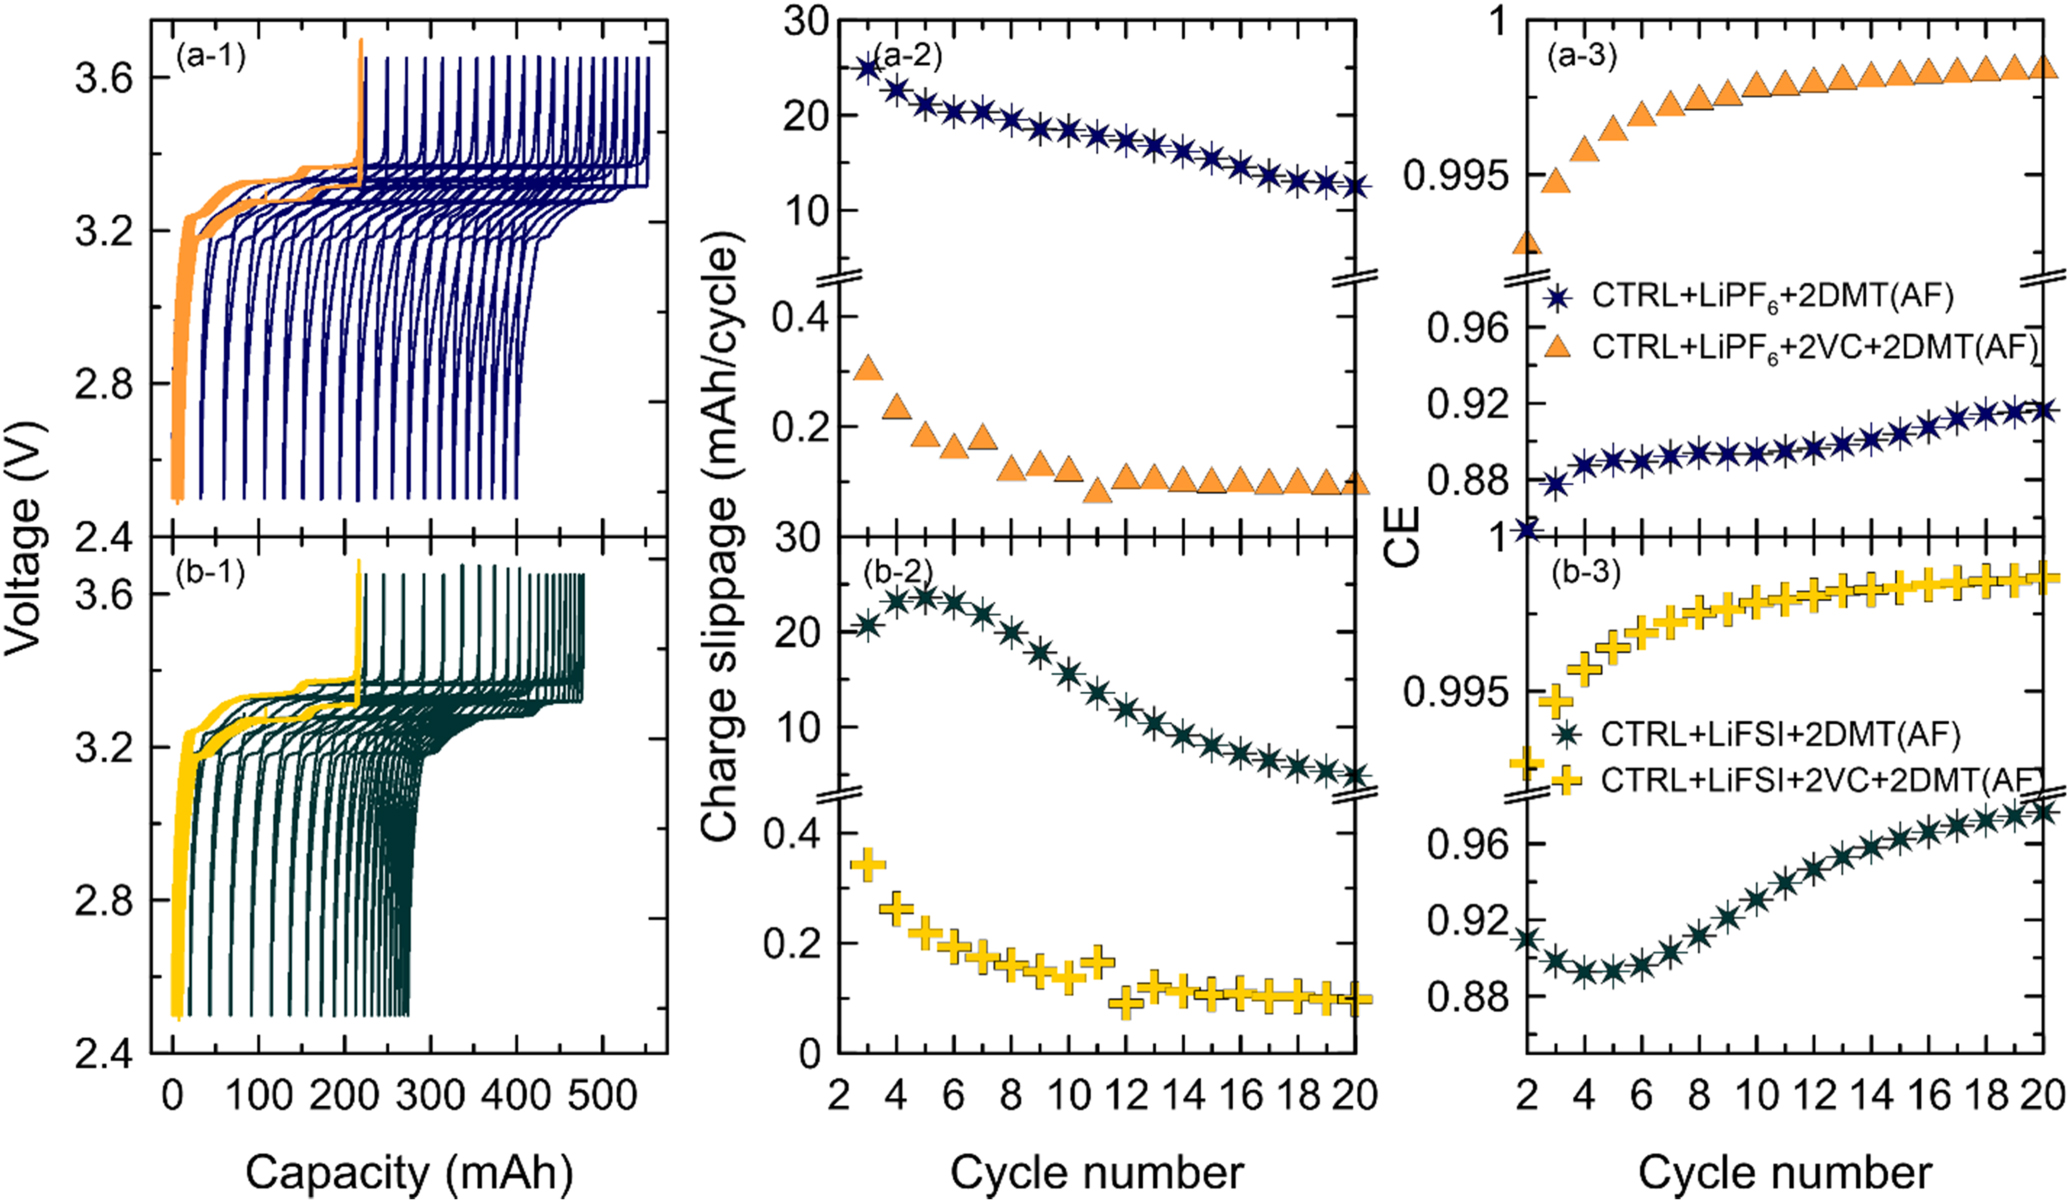
When 2DMT is added to cells that were formed in the presence of 2VC (orange and yellow data in Fig. 12) voltage vs capacity curves of, both, cells with LiPF6 and LiFSI almost perfectly overlap. The charge endpoint capacity slippages are <0.1 mAh/cycle for both salt types and the CE approaches 99.8%. This clearly proves that a VC-derived SEI prevents DMT from shuttling and is consistent with the very slow self-discharge of VC containing cells in Figs. 6 and 7.
Discussion
DMT shuttling mechanism based on the coin cell experiments
Based on the CV experiments and the comparison between our data and the data of Urano et al. 13 and Tanaka et al. 15 (see Fig. 4), the DMT shuttling mechanism must proceed as follows: after DMT is created as a breakdown product of PET tape, it can diffuse to the negative electrode of a LIB cell. The graphite negative electrode has a low potential around 0.1 V vs Li+/Li 30 during the whole operational voltage window of the cell. Thus, when a DMT molecule reaches the negative electrode, it can always be reduced since graphite's potential is lower than the redox potential of DMT, which was found to be around 1.5 V vs Li+/Li. The reduction turns DMT molecules into negatively charged DMT- radicals, which absorb light at a wavelength of 530 nm—as shown by Urano et al. 13 and Tanaka et al. 15 —and thus colors the electrolyte red (see Fig. 5). Simultaneously, an identical number of Li atoms give up an electron, turn into Li+ ions, and leave the graphite host structure to ensure charge neutrality. Since the number of Li atoms in the graphite host material define the SOC of the LIB, the SOC decreases. In the next step, the DMT- radicals diffuse to the positive electrode. Positive electrodes like LFP or NMC have a higher potential (>3 V vs Li+/Li 30 ) than the redox potential of DMT in the whole operational voltage window of the cell, which leads to an oxidation of DMT- back to DMT as soon as it reaches the positive electrode. Again, for every DMT molecule a Li+ ion out of the electrolyte accepts an electron and enters the positive electrode's lattice to ensure charge neutrality. This process repeats until the battery is completely discharged or all DMT molecules have been consumed by a competing reaction.
DMT shuttling mechanism in real cells with passivated interfaces
How can DMT gain electrons from the graphite negative electrode in a real lithium-ion cell? The solid-electrolyte interface (SEI) 31 that builds up on the negative electrode particles during the initial cycles of the battery should be an electrically insulating surface film that supresses further reduction of solvent molecules, i.e., it should also supress the reduction of bulky DMT molecules (molecular weight 194 g mol−1). However, under most conditions the SEI keeps thickening over the lifetime of the battery 32 so electron transfer from the negative electrode to solvent molecules is still possible at a reduced rate (see below for an estimation of the charge transfer rate required to sustain the self-discharge via DMT). The fact that redox shuttles can operate despite the insulating SEI film on the negative electrode was shown in literature on redox shuttle additives for overcharge protection. 7,28 Interestingly, the quality of the SEI seems to play an important role. A well-passivating and stable VC-derived SEI suppresses the shuttling of DMT molecules almost entirely (see Figs. 6, 7, and 12). Additives like VC can be consumed in long-lived LIBs, 33 which will likely lead to the build-up of an inferior EC-derived SEI that no longer supresses shuttling of DMT. Future work should assess the impact of DMT on long-lived LIBs.
Estimation of charge transfer rate required for DMT-induced self-discharge
Based on the UHPC experiments of Fig. 12, it is possible to calculate how often one DMT molecule shuttles on average during a full C/20 cycle. For these experiments, 2 wt% of DMT was added to the electrolyte of CTRL + LiPF6 cells, so the total number of shuttle molecules is:

Figure 12a-2 shows that the average charge endpoint capacity slippage over the first cycles amounts to ∼20 mAh/cycle. Without any slippage each constant current C/20 half-cycle should take 20 h. As explained above, slippage will cause the charge half-cycle to be longer than the discharge half-cycle. However, the full cycle will still take ∼40 h. Hence, the number of one-electron charge transfer reactions of DMT across the negative electrode interface during one C/20 cycle should be:

Given the 85 cm2 active area of the pouch cells used in this study, this corresponds to a leakage current density through the SEI of:

Note that this is fully consistent with the 5 μA cm2 shuttling current density that Boulanger et al. derived from the self-discharge time of 200 mAh LFP/graphite pouch cells stored at 60 °C. 4
Estimation of DMT's diffusion coefficient
If all the added DMT molecules are stable over the first cycles and contribute to the observed charge slippage, one would estimate the following average number of shuttle trips per DMT molecule:

Since a single DMT molecule on average shuttles 5 times between positive and negative electrode during a C/20 cycle, the average diffusion time for one shuttle trip is:

Given the porosity of the electrodes and the separator, the tortuous diffusion path for a single trip of a DMT molecule from one electrode to the other might have a length of 100 μm (we assume 5x the separator thickness of 20 μm). Thus, the apparent diffusion coefficient of DMT can be estimated as:

For comparison, the diffusion coefficient of Li+ ions in alkyl carbonate electrolyte is typically assumed to be 10−6 cm2 s−1. 34 Even for a bulky molecule like DMT, a ∼2 orders of magnitude lower diffusivity than Li+ seems very slow. The fact that only 5 shuttle transit are observed could stem from slow charge transfer kinetics at the interfaces. Since a VC-derived SEI can completely suppress the shuttling of DMT, it may be the case that an EC-derived SEI can significantly slow down the charge transfer kinetics. This could explain the very low apparent diffusion coefficient of ∼10−8 cm2/s. Clearly, these calculations can only be regarded as order of magnitude estimations. Nevertheless, they suggest that DMT is stable for more than just a few shuttling trips in our pouch cells. In fact, the large slippage of CTRL + LiPF6 + 2DMT cells in Fig. 12a−2 is maintained for 20 cycles (=33 d) and the high self-discharge rates of CTRL + LiPF6 + 2DMT cells in Fig. 9 are measured over 1,000 h (=41 d).
The above calculation assumes that all DMT molecules added to the electrolyte contribute to charge slippage. However, it is currently unclear if a saturation concentration of DMT in the electrolyte can be reached. Future work should focus on concentration dependent shuttling current measurements.
Conclusions
This study showed that unwanted self-discharge of lithium-ion batteries is caused by the redox shuttle dimethyl terephthalate (DMT), which is generated in situ from PET tape commonly found in commercial batteries. Cyclic voltammetry showed that DMT has a redox potential of ∼1.5 V vs Li+/Li, which means it can be readily reduced at a graphite negative electrode (<0.1 V vs Li+/Li) and oxidized at an LFP or NMC positive electrode (>3 V vs Li+/Li) even at low full cell voltages. Thus, it can cause complete self-discharge as we have shown with open circuit storage experiments of cells in which DMT has either been created during high temperature formation or added intentionally after formation. Cells with LiPF6 salt showed significantly more self-discharge than cells with LiFSI salt. GC-MS analysis of the electrolyte after storage showed that DMT is consumed in cells with LiFSI during 500 h of storage, but not in cells with LiPF6. Investigation of the charge endpoint capacity slippage of cells with a known concentration of DMT, allowed to estimate that the diffusivity of DMT is approximately 2 orders of magnitude lower that that of Li+ ions and the self-discharge mechanism of DMT is supported by a leakage current of ∼5 μA cm−2 through an EC-derived SEI. Interestingly, when VC is used to form a well-insulating SEI layer on the negative electrode before DMT is added, self-discharge and charge slippage are almost completely eliminated. However, VC can be consumed, and passivation layers can deteriorate in aged cells, so the best way to prevent DMT-induced self-discharge of lithium-ion batteries is to eliminate PET components and replace them by stable polymers. We are currently screening alternative polymers for lithium-ion battery tapes.
Acknowledgments
This work was funded under the auspices of the NSERC/Tesla Canada Alliance Grant program. We thank Prof. Hubert A. Gasteiger from the Technical University of Munich for advice in designing the cyclic voltammetry experiments. We thank Dr Hussein Hijazi and Michel B. Johnson for help with the cyclic voltammetry and GC-MS experiments, respectively.