
Abstract
The Environmental Protection Agency (EPA) considers ammonia and nitrate as large-scale threats to environmental quality and human health, causing impaired air quality, surface water eutrophication, and other serious health problems. This work examines the viability of using a pulse electrolysis technique to accomplish the simultaneous removal of ammonia and nitrate in an undivided flow cell using CuNi/PtIr supported on carbon electrocatalysts (CuNi/PtIr/C). Different series of PtIr/C and CuNi/C compositions were examined, and it was found that among all series of the synthesized catalysts, 60% Pt9Ir/C and 40% Cu9Ni/C had greater activity toward Ammonia Oxidation Reaction (AOR) and Nitrate Reduction Reaction (NRR), respectively. Throughout the pulsing potentials, the nitrogen contaminants were gradually removed with the overall reaction that generated harmless nitrogen and hydrogen gases. The average ammonia and nitrate removal rates were 5.17 ppm-ammonia and 0.074 ppm-nitrate/min, respectively. The selectivity of nitrate to ammonia was 82% with an average nitrate removal rate of 65%. The catalysts exhibited pronounced stability after 10 cycles of pulse electrolysis.

Export citation and abstract BibTeX RIS

This is an open access article distributed under the terms of the Creative Commons Attribution Non-Commercial No Derivatives 4.0 License (CC BY-NC-ND, http://creativecommons.org/licenses/by-nc-nd/4.0/), which permits non-commercial reuse, distribution, and reproduction in any medium, provided the original work is not changed in any way and is properly cited. For permission for commercial reuse, please email: permissions@ioppublishing.org.
High levels of ammonia and nitrate in groundwater, surface water, and other water resources can cause serious environmental and human health issues such as eutrophication, algae bloom, baby blues syndrome, methemoglobinemia, liver damage, iron hemoglobin disease, gastrointestinal cancer, etc. 1–4 The main sources of nitrogen contamination are related to fertilizer overuse, discharge of domestic and industrial wastewater, emissions from factories, animal feed farm runoff, and municipal sludge. 5–7 Indeed, the Wrld Health Organization (WHO) has regulated the maximum acceptable concentration limits of nitrate and ammonia in drinking water as 50 mg l−1 and 35 mg l−1, respectively. 8,9 Hence, developing efficient techniques for removing ammonia/nitrate has become of fundamental relevance nowadays. Several physical and chemical technologies have been developed for ammonia/nitrate remediation, e.g., biological treatment, air-stripping, breakpoint chlorination, ammonia cracking, physiochemical techniques, ion-exchange resins, electro-dialysis, electrocoagulation, reverse osmosis, 10–15 which usually demand high voltage, have a slow rate of removal, create more toxic by-products, and are considered as time-consuming processes. 16–19 To date, Ammonia Oxidation Reaction (AOR) and Nitrate Reduction Reaction (NRR) processes operating at ambient temperature, energy-efficient, environmentally friendly, and easy to control, are emerging as promising alternatives. Bimetallic catalysts hold the promise of promoting activity and stability because of the synergistic interactions between metal components and enhancing the adsorption of the intermediates during multistep reactions such as AOR and NRR. 20–22 It has been reported that electrodes based on PtIr, 23–28 and CuNi compounds supported on carbon, 29–35 are candidates with superior activity toward AOR and NRR, respectively. Indeed, 5d noble transition metals such as Pt and Ir are among the candidates with the highest performance toward AOR. 36 At the same time, the 3d transition metals and their bimetallic alloys such as CuNi could drastically increase the rate of NRR. This improvement is due to the similarity between Cu energy level and the lowest unoccupied molecular π* orbital of nitrate, facilitating rapid reduction of nitrate. 20 The significant activity of bimetallic CuNi toward NRR is stemming from a high difference in standard reduction potential between Cu and Ni, which creates infinite galvanic cells impelling the flow of electron transfer from Ni to Cu sites, hence boosting the nitrate adsorption on Cu sites. 2 In addition, the monolayer redox Cu(0)/Cu(I) couple formed on the surface of the Cu might assist the electron transport from the nitrate species. 18 Extensive research has been conducted to investigate and enhance the performance of AOR and NRR individually. However, the feasibility of implementing AOR and NRR in a single undivided cell has been studied just recently by a few researchers. 1,2,4,8,13,37 If a single undivided cell can perform both NRR and AOR at once, a significant amount of time and energy can be saved which could help to decrease the investment costs. In addition to the electrode and cell design, the mode of electrolysis (e.g., potentiostatic, galvanostatic, pulse) plays a critical role as well. Pulse electrolysis offers unique advantages over traditional ones. By continuous polarity switching, one can maintain a dynamic energy input to control the electrolysis reactions, especially when the reactions are limited by the mass transfer of ions. 38 When the reaction is limited by diffusion, changing the polarity would be highly advantageous since it can shrink the thickness of the diffusion layer. 39 It has been also reported that by changing the polarity, the ions can more readily pass to the electrode surface through a very thin diffusion layer. 40,41 The main challenge of the non-pulsed electrolysis methods for NRR is the generation of undesired by-products, mainly ammonia and nitrite. In contrast, during pulsed electrolysis, the time for the formation of the by-products is insufficient, thereby enhancing the efficiency of the reaction. 39,42 Several studies have revealed that pulsing can alleviate the ohmic drop and the capacitive loss during double-layer establishment since the ions do not have enough time to line up and store the charge as the polarity switches periodically. 38,39,43 Moreover, pulse electrolysis is beneficial as it hinders the formation of hydrogen micro-bubbles, which could potentially inhibit NRR. 39 A few researchers have reported that pulsing can diminish the hydrogen evolution as a competitive reaction to NRR as hydrogen reduction reaction would delay the transfer of nitrate during NRR. 17,39 Pulse electrolysis is also beneficial for AOR as reported by Vitse et al. 44 Ammonia electrolysis in alkaline media takes place at low thermodynamics cell voltage of 0.06 V producing nitrogen gas and hydrogen. Vitse et al. 44 reported that applying a pulse cell voltage during ammonia electrolysis minimizes the surface blockage due to intermediate species that are produced during the electrolysis and enables continuous operation of the electrolysis. In addition, combining pulse electrolysis, ammonia produced during NRR will be oxidized during AOR when the polarity of the cell is switched, following the process described by Vitse et al. 44 Therefore, it is possible to tune the pulsing parameters to operate at a lower cell voltage than the potentiostatic/galvanostatic electrolysis, still having the same or higher efficiencies. 39 The designed cell herein has the potential to use 35%–50% less energy per gram of nitrate removal and about 90% less energy per gram of ammonia removal compared to the available techniques. The voltage in the present study is about 1 V less than the applied potentials for the currently available traditional NRR techniques. For instance, Ma et al. 21 built a catalytic carbon membrane nano-reactor to carry out NRR using potentiostatic electrolysis by applying a constant potential of 4 V, which is about 3 V higher than the pulse potential amplitude used in the present work (i.e., ±0.925 V). The technology introduced herein consumes about 5 × 10⁻³ kWh g−1-NH3 and 1 × 10⁻² kWh g−1-NO3 − electrical energy, which is much lower than the energy used by other techniques available in the literature for ammonia/nitrate treatment; e.g., 0.22 kWh g−1-NO3 − using Ti/RuO2 anode and iron cathode, 1 0.015–0.022 kWh g−1-NO3 − in a rotating cylinder electrode design, 45 0.5 kWh g−1-NH3 on a boron-doped-diamond electrode, 46 0.04 kWh g−1-NO3, −47 2.66 kWh g−1 NO3 − using an electrocoagulation technique, 48 0.622 kWh g−1-NH3 using RuO2-IrO2/Ti and microscale zero-valent iron composite, 15 and 0.15–0.19 kWh g−1-NO3 − using Cu/Zn and Ti nano-cathodes. 26
This study aims to build an electrode-architecture design that allows synchronous NRR and AOR in a single cell by applying symmetrical square wave pulses. The introduced layout provides an exciting opportunity for application in the field of wastewater treatment. The key contribution of the presented work is to synergize this technology with zeolite ion exchange columns applicable for ammonia adsorption. 49 In a wastewater treatment plant, ammonia concentrations at the inlet of the plant are low ∼20–30 ppm, when using zeolites, the ammonia is captured in the zeolite, and it is then removed by a brine (e.g., NaOH), delivering a concentrated solution of ammonia (e.g., 1,500–2000 ppm) in the brine. The process of ammonia oxidation using the presented methodology is well-established by Botte's group, 16,30,50,51 but not for nitrate. In this work, the feasibility of synergizing the NRR with that technology is examined. The initial concentration for the contaminants and the pH of the synthetic wastewater used in this work were chosen according to their applicability for synergizing with zeolite ion exchange columns demostrated by the author's group in the Ammonia GreenBox pilot system evaluated at the City of Athens Wastewater Treatment Plant. 49
Experimental
Materials and Catalyst Synthesis
PtIr/C and CuNi/C catalysts were synthesized using a modified polyol technique followed by an impregnation step according to Refs. 30, 31 H2PtCl6 hydrate (99.9% metal basis, Alfa Aesar), IrCl3 trihydrate (53%-56% Ir, Acros Organics), Ni(NO3)2 hexahydrate (99.999%, Alfa Aesar), and Cu(NO3)2 pentahydrate (98%, Alfa Aesar) were dissolved in ethylene glycol (99.5%, Fisher Chemical) and used as precursors. Vulcan XC-72 (purchased from FuelCellStore) was used to synthesize the catalyst. The Vulcan was mixed with ethylene glycol (EG) in a Branson CPX2800 bath sonicator for 2 h, then sonicated for an additional 30 min using a higher power ultrasonic (IKA Ultra-turrax). After sonication, the appropriate amount of metal precursors was added to the ink to obtain the desired loading percentage of metallic nanoparticles on Vulcan support. The loading was determined gravimetrically and kept at the desired level. The precursor solutions to synthesize CuNi/C and PtIr/C catalysts included CuSO4 + NiSO4 + EG, and H2PtCl6 + IrCl3 + EG, respectively. 1 N KOH solution (Fisher Chemical) and NaOH pellets (Certified ACS Pellets, Fisher Chemical) were used to adjust the pH above 8 for the cases of PtIr/C and CuNi/C catalysts, respectively. The mixture was heated on a heater stirrer at 180 °C for 16 h. After 16 h of heating, 100 ml of ultrapure deionized (DI)-water with the resistivity of ∼18.2 MΩ-cm was added to the mixture, and the vacuum filter was utilized to filter the mixture. After filtration, the ink was collected from the funnel. DI-water was used to wash the ink from the funnel and remove all the materials from the centrifuge tubes. The mixture of DI-water and ink was centrifuged for about 45 min at the speed of 5000 rpm. After 1 h, the excess water was removed, and the collected catalyst was dried in a vacuum oven (MTI EQ-DZF-6050-UL) at 110 °C for 16 h. 0.4 g of the catalyst was mixed with 65 g isopropanol and 0.1 g ionomer and was again sonicated in IKA Ultra-Turrax sonicator for 15 min, and then in a Branson CPX2800 bath sonicator for 1 h. The legend of the catalysts, labeling and their corresponding compositions according to energy dispersive spectrometry are presented in supplementary information Table S1. Master-Air-Brush spray gun was used to spray the ink of catalysts on Ni mesh (Alfa Aesar 40 mesh woven).
Analysis methods
The pH was monitored using a Thermo Scientific Orion Star A215 pH meter. An Ammonia Ion-Selective Electrode (ISE-THERMO) Orion 9512 was used to measure the concentration of ammonia. It yielded a concentration ranging from 0.1 to 100 ppm of N-NH3 without dilution. The analysis of nitrate was done according to the standard UV-spectrophotometric technique. 52 UV/vis Hewlett Packard 8452 A Diode-Array Spectrophotometer was used to collect the absorption spectra for nitrate analysis. In this method, a premix solution consisting of premix 1 (vanadium (III) Chloride solution), premix 2 (sulfanilamide solution), and premix 3 (N-(1-naphthyl)-ethylenediamine dihydrochloride) (ratio of 2:1:1, respectively) was used. A standard solution of 40 ppm NO3 − was used to plot a calibration curve of absorbance vs concentration of nitrate. The absorption spectra were collected at 540 nm wavelength.
Characterization
Characterization of the synthesized catalysts was done using Ultima IV X-ray diffraction (XRD) Rigaku (Cu-kα radiation with = 1.5418 Å), JEOL JSM-6390 scanning electron microscopy (SEM), energy dispersive spectrometer (EDS), and JEOL JEM 2100 F transmission electron microscopy (TEM). UV/vis Hewlett Packard 8452 A Diode-Array Spectrophotometer was used to collect the absorption spectra for nitrate analysis. Brunauer–Emmett–Teller (BET) Micromeritics Tristar II connected to a FlowPrep 060 Sample Degas System was used to quantify specific surface area for the catalyst. The analysis of the produced gas was done via gas chromatography (GC) using an SRI 8610 C instrument equipped with a Mole Sieve 5 A column, and argon gas as the carrier gas. All resources required were available at the Center for Electrochemical Engineering Research (CEER).
Electrolysis Process and Measurements
Electrochemical measurements were carried out using an Arbin BT2000 and a Solartron 1470E potentiostat. Hg/HgO reference electrodes and Pt plate counter electrodes (2 × 2 cm2) were used for the electrochemical measurements. Figures S1 (a) and (b) in Supporting Information shows the assembled 225 cm2 flow cell used for ammonia/nitrate electrolysis. Figure S1 (c) shows the dimensions and schematic of the 25 cm2 flow cell, and Fig. S1 (d) schematically shows the circulation loop used in this study. The cell body was fabricated from milling machined clear acrylic plexiglass. Two different sizes of flow cells, i.e., 25 cm2 (Fib. S1 c) and 225 cm2 (Fig. S1 b), were fabricated in the present work. The electrode spacing was kept at 8 mm. The synthetic solution stream was fed into the electrolysis cell by a Cole Parmer gear pump. A Blue-White Industries F-400 flowmeter was used to measure the flow rate. The temperature was controlled by an Econo Temperature Controller model 12125–14. The solution was continuously circulated in this loop, and every 30 min, water samples were taken from the feed tank output to monitor the ammonia and nitrate concentrations. The pulse electrolysis was carried out at a pulsed voltage of ±0.925 V with a pulse width of 18 s (flow rate = 2 lPM, time ∼2500–4500) in the undivided flow cell shown in Fig. S1. The electrolysis was performed at 38 °C. The cycles were continuously performed until the concentrations of ammonia and nitrate were reduced to the permissible levels regulated by WHO (50 ppm nitrate and 35 ppm ammonia).
Results and Discussion
XRD and TEM Characterization of the CuNi/C and PtIr/C Catalysts
The EG-based procedure of catalyst fabrication enables the fast reduction of the metal precursor from their oxidized forms. It has been reported that EG could function as a nanoparticle stabilizer as well as a solvent. 25 Figure 1 shows the XRD patterns and TEM images for the as-prepared 40% Cu9Ni/C and 60% Pt9Ir/C catalysts in their powder form before being sprayed onto the Ni mesh. TEM images indicate a good distribution of the catalyst on the carbon support. X% MaNb/C means a catalyst which contains X wt% MaNb metallic catalyst and (100-X)% carbon Vulcan. "a" and "b" in MaNb indicates the atomic fraction of an element in MaNb mixture. For example, Cu9Ni indicates the atomic ratio of 90% Cu and 10% Ni, or 40% PtIr/C represent a catalyst with 60 wt% carbon Vulcan and 40 wt% PtIr, in which the elemental ratio of Pt to Ir in the metallic catalyst is 50% to 50%. Refer to Table S1 for detail information about the catalysts labeling and their composition.
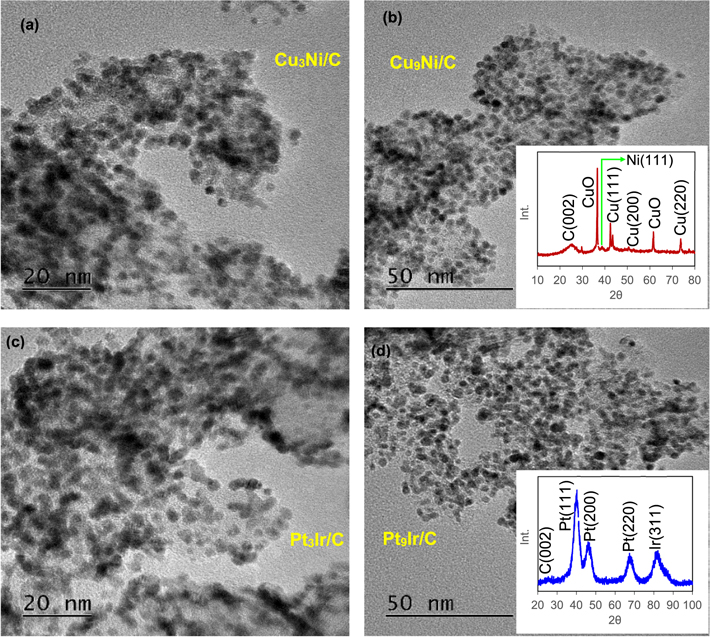
Figure 1. TEM images for (a) Cu3Ni/C, (b) Cu9Ni/C, (c) Pt3Ir/C, and (d) Pt9Ir/C catalysts. The insets of (b) and (d) show the XRD patterns for Cu9Ni/C, and Pt9Ir/C, respectively.
Download figure:
Standard image High-resolution imageIn Fig. 1b, the diffraction peaks around 43.2o, 50.3o, and 74.0o are assigned to Cu (111), Cu(200), and Cu (220) respectively, which confirms the presence of face-centered cubic (FCC) copper (card no. ICDD 00–003–1005). Cu(111) lattice planes are preferential facets as they enhance the kinetics of *NO3 adsorption, i.e. the rate-determining step during NRR. 18,21 The slight peak at 43.2o corresponds to FCC Ni(111) indicating the presence of a mixture of CuNi supported on a carbon catalyst. The presence of an obvious diffraction peak around 38.1o relates to CuO indicating that some part of copper is oxidized to copper(II) oxide during the polyol process. CuO formation can be prevented by adding more NaOH than its stoichiometric ratios, ensuring that all CuSO4 and CuO are entirely reduced to copper. At the same time, CuO formation during the polyol process could be minimized by strategies such as eliminating excess water or other oxidizing agents and using a longer stirring time. 31 The Debye–Scherrer correlation (Eq. 1) was used to approximate the crystal size 53 :

where D is the size of the particle K is the Scherer's constant (K = 0.94), λ is the X-ray wavelength (1.54178 Å), and 2θ is the peak position. According to Scherrer's formula, a particle size of 3.3 nm for Cu9Ni nanoparticles was estimated, which reasonably agrees with the TEM observations. The well-dispersed Cu9Ni nanoparticles anchored on the carbon Vulcan support can be seen in Fig. 1. The nanoparticles are desirable since they would sluggish the limitations attributed to the mass transfer and promote the activity. 3 The XRD pattern of the Pt9Ir/C powder in Fig. 1d shows the characteristic peaks located at 39.7o, 46.2o, 67.4o and 83.4o that correspond to FCC Pt(111), Pt(200), Pt(220), and Ir(311), respectively (Pt card no. ICDD 01–070–2431 and Ir card no. ICDD 00–046–1044). AOR is sensitive to the lattice orientation of PtIr nanoparticles. Pt(111) and Pt(100) facets could boost the adsorption of *NH, *N2H4, and *NH2 involved in the dimerization step to form an N−N bond, which is considered the rate-limiting step during AOR. 54 Both Pt and Ir have an FCC crystal structure, and by increasing the atomic ratio of Pt from Pt3Ir to Pt9Ir, Pt tends to replace the Ir atoms in the FCC crystal structure. 55 The electronic effect between Pt and Ir in bimetallic nanoparticles makes them more stable than monometallic Pt or Ir. 16 The diffractograms for both Cu9Ni/C and Pt9Ir/C exhibit a broad peak around 25o, which is assigned to the plane reflection of the graphite in carbon Vulcan. 56 Among the nanoparticles in Fig. 1, some partially reduced precursors are distinguishable, nonetheless, these regions are far smaller than those covered by nanoparticles themselves. The mean diameter of the synthesized PtIr nanoparticles is about 2.2–2.9 nm (as shown in Figs. 1c–1d), which provides a sufficient surface area for the subsequent electrocatalytic applications. A size of about 2.2 nm for Pt9Ir nanoparticles is estimated from the Scherrer formula, which is consistent with TEM observations as well.
Ammonia electro-oxidation —electrocatalytic characterization of ptir/c anode
We began by preparing a series of PtIr/C catalysts with different Pt:Ir ratios and the top three with the most promising characteristics were selected for further examinations, these catalysts have been reported for high activity for ammonia oxidation. 16,30,50,51 Based on the weight analysis during the polyol procedure, it was found that the maximum amount of metallic PtIr nanoparticles that could be loaded on the carbon Vulcan was about 61.8%. Thus, the loading on carbon support could not exceed 61.8% mass ratio of catalyst metallic nanoparticles to carbon Vulcan as the excess amount will be wasted during synthesis. The catalytic activity for AOR was examined using cyclic voltammetry (CV) and pulse electrolysis. Figure 2a shows an example of the square wave pulse potential (red) and the corresponding current response (blue) during electrolysis in a flow cell with a pair of Pt9Ir/C 60% electrodes (loading 0.25 mg cm−2) in 8.3 g l−1 (NH4)2SO4 + 18 g l−1 NaOH solution at 38 oC. It should be noted that both electrodes were identical (Pt9Ir/C) and the waveform shown in Fig. 2a must be a symmetric one. Figure 2b compares the voltammograms of 50% Pt3Ir/C, 60% Pt9Ir/C, and 40% % PtIr/C (same loading for all catalysts, 0.25 mg cm−2) in 8.3 g l−1 (NH4)2SO4 + 18 g l−1 NaOH solution. The onset of AOR, the location of the oxidation peak, and the overall shape of CVs are similar to what was reported elsewhere in the electrolytes containing ammonia. 57–59 The peak current density (ip ) due to AOR is affected by the atomic ratio and chemical composition of PtxIr1-x. As shown in Fig. 2b, at the same loading of 0.25 mg cm−2, 60% Pt9Ir/C showed the highest ip of about 20 mA cm−2. This current density for AOR reaction is superior to most Pt-based catalysts that have been reported in the literature (see Table S2 in Supporting Information).
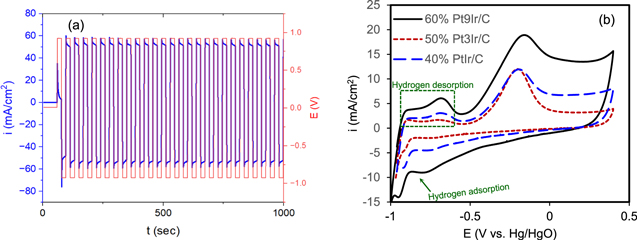
Figure 2. (a) pulsing potential (red) and current response (blue) during pulse electrolysis, (b) CVs of three different PtIr/C compositions in 8.3 g l−1 (NH4)2SO4 + 18 g l−1 NaOH solution.
Download figure:
Standard image High-resolution imageThe peak potential observed around −0.15 V vs Hg/HgO corresponds to the AOR via Eq. 2 55 :

As shown in Fig. 2b, during the positive-going scan, the hydrogen adsorption/desorption peaks can be clearly seen in the potential range of about −0.8 V vs Hg/HgO. It should be kept in mind that each overall reaction takes place through several elementary steps (e.g., adsorption, desorption, etc). The voltammogram response at steady-state only represents the overall reaction (or a single rate-determining step), not the elementary ones. Studying the impact of the elementary step on the feature of the voltammogram is beyond the scope of the present work. The region of hydrogen desorption is usually recognized with two to three oxidation peaks which can be attributed to hydrogen desorption on Pt(110) or Pt(100) lattice sites. 18 During pulse electrolysis in a 25 cm2 flow cell, an average current density of about 50 mA cm−2 was obtained which is higher than what has been reported by other researchers. 11,46 Figure S2 represents the method used to estimate the average current during electrolysis, using an algorithm based on the time mid-point of each cycle to generate the average line. In this method, the pulse width is divided into two equal subintervals of length 0.5Δt, then by connecting the current values at the midpoints, an average curve of the current was estimated. After about 15 min of electrolysis, approximately 200 ppm ammonia (0.2 mg N-NH3) was removed, which is equal to a Faraday efficiency of about 97% for AOR. Fig. S3 (a) compares the average current density for 50% Pt3Ir/C, 60% Pt9Ir/C, and 40% % PtIr/C catalysts at different NaOH concentrations during ammonia electrolysis in the 25 cm2 flow cell in 8.3 g l−1 (NH4)2SO4 + 18 g l−1 NaOH solution. In all cases, there is an increasing trend in current density when more NaOH is added to the base (NH4)2SO4 electrolyte. A more alkaline electrolyte tends to shift Eq. 2 to the right side by providing more OH− in access, thus increasing the current density associated with AOR. As it is shown in Fig. S3 (a), at different NaOH concentrations, the kinetics of AOR for 60% Pt9Ir/C catalyst is higher than those for 40% Pt1Ir1/C and 50% Pt3Ir/C. The superior activity of Pt9Ir compared to other series of PtIr compositions has been also reported by Vot et al. 36 A possible explanation for the higher activity of Pt9Ir/C might be that the N2H4-formation-mechanism is the predominant mechanism during AOR. 16 This mechanism is more feasible on Pt sites, while the N2-formation-mechanism is more plausible on Ir sites. Hence, for a dominant N2H4-mechanism, improved performance is obtained for those series of PtIr/C catalysts rich in Pt, i.e., Pt9Ir/C. 16,60 The high content of Pt(100) and Pt(111), preferentially crystallographic orientation in Pt9Ir/C, could promote the catalytic activity due to its high tolerance for Nads poisoning effect as well. 56 Additionally, a Pt-rich catalyst such as Pt9Ir/C can increase the recombination tendency of NHx intermediates, thus assisting the formation of gaseous N2, which is the desired product. 36 Taking together, Pt9Ir/C seems to be a suitable choice for subsequent AOR examinations. Figure S3 (b) shows an energy fluctuation throughout the electrolysis process, which corresponds to the pulsing potential (according to E = U × I×t). At the pulse potential of 0.925 V, the corresponding average current was 1.25 A for a 25 cm2 size of the cell, and based on the stoichiometric calculations for 2NH3 → 3H2 + N2 reaction, the electrical energy for 1 g H2 production is about (0.0882 M H2 × 2 g/mole H2 )−1 × 0.003 kWh × (1000 W/1 kW) = 17 Wh, which is in line with what found by Jiang et al. 11 for ammonia electrolysis using Pt-Ir deposited on nickel foam. They reported the required electrical energy of about 17.6 Wh per g of H2 production.
The voltammograms of Pt9Ir/C in the absence and the presence of ammonia are shown in Fig. 3a. A distinct oxidation peak at about −0.15 V vs Hg/HgO is observed after the addition of 2100 ppm ammonia, which is ascribed to the AOR.
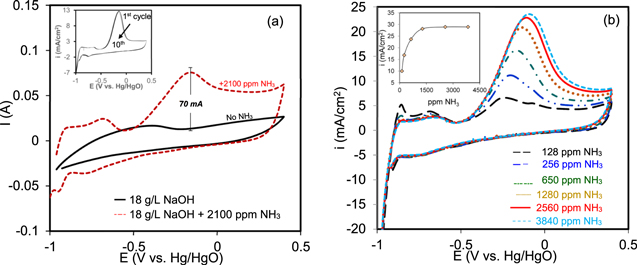
Figure 3. CV response of Pt9Ir/C catalyst in the absence and the presence of ammonia. Inset: repetitive CVs in 8.3 g l−1 (NH4)2SO4 + 18 g l−1 NaOH solution, (b) CVs of 60% Pt9Ir/C catalyst at different ammonia concentrations in a base solution of 18 g l−1 NaOH: scan rate: 25 mV s−1.
Download figure:
Standard image High-resolution imageNo oxidation peak was observed in the absence of ammonia; however, the addition of ammonia yielded a 70 mA rise in the current signal, which indicates the tendency of Pt9Ir/C to interact with and oxidize the ammonia. 55 The shape of the CVs and the appearance of the AOR oxidation peak located at about −0.15 V vs Hg/HgO is similar to what was reported by Diaz et al. 57,58 For the ammonia-free solution, the underpotential deposition of hydrogen at the potential range between −0.7 to −0.4 V vs Hg/HgO was detected. This also accords with the earlier observations by Diaz et al. 57,58 Moreover, the hydrogen desorption peak appeared more notably in the presence of ammonia and shifted to lower potentials, which reveals the influence of ammonia on the hydrogen desorption activity as well. It is likely that in the presence of ammonia, Nads could occupy the active sites on Pt, leaving no spots available for the adsorption of Hads, thereby surpassing the hydrogen desorption. 18,27 AOR as a multistep reaction involves the cleavage of N−H bond on Pt sites, where both Pt and Ir exhibit a dehydrogenation capacity with low affinity for Nads, motivating the formation of gaseous N2. 25 The inset in Fig. 3a represents the successive voltammograms of 60% Pt9Ir/C catalyst in 8.3 g l−1 (NH4)2SO4 + 18 g l−1 NaOH solution. After ten cycles over a wide potential window ranging from −1 to +0.4 V vs Hg/HgO, the Pt9Ir/C catalyst possessed good stability in such an alkaline environment (pH ∼13). The interaction between Pt and the carbon support could drastically suppress the poisoning effect due to Nads., leading to higher activity and durability for the catalyst toward AOR. 27 Wang et al. also reported that structural features of nitrogen-functionalized carbon can lower the agglomeration of Pt clusters. 61 The very slight decay in peak current during the repetitive scans is primarily caused by minor poisoning of Pt sites due to the adsorption of imine and Nads.. 48 The background signal due to the blank solution was always subtracted to eliminate the interference from the catalyst itself. As shown in Fig. 3b, the peak current increases non-linearly with ammonia concentration implying the robust catalytic activity of Pt9Ir/C toward ammonia detection over a wide range of its concentration from 128 to 3840 ppm. The constructed calibration curve vs ammonia concentration follows a similar logarithmic trend as reported by Sarno et al. 25
It has been pointed out that AOR is a strongly pH-dependent process since it tends to take place in the oxyhydroxide regions. 62 Fig. 4 shows the effect of pH on the electro-voltammograms of 60% Pt9Ir/C in 8.3 g l−1 (NH4)2SO4 solution.
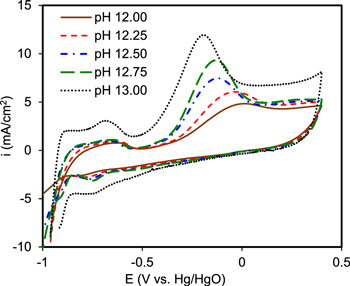
Figure 4. Voltammogram response of 60% Pt9Ir/C catalyst in 8.3 g l−1 (NH4)2SO4 at different pHs.
Download figure:
Standard image High-resolution imageThe peak current augmentation at higher pH is due to the shift of AOR to the right side (Eq. 2) in more alkaline media. 63 The alkalinity is a necessary factor for the completion of AOR since higher OH− facile the electrode activity and triggers AOR. Sharp peaks were clearly obtained at pH > 12 while observing no characteristic peaks at pHs 9 and 11 (Fig. S4), suggesting that the kinetics of AOR is possibly too slow at lower pH (<11). Moreover, more acidic media might retard NRR as the competitive reaction of hydrogen evolution becomes more favorable at lower pH. 6 pH plays a critical role in the existent form of ammonia such that it can control the predominant form of ammonia as NH4 + or NH3 via the following equilibrium: 64

At constant temperature, considering the Nernst equation of thermodynamics (Ecell = E0 + 0.0591 pH + 0.0591 log([NH4 + ]/[NH3 ])), the AOR potential depends on [NH4 +]/[NH3] ratio and pH. Increasing pH can concurrently accelerate the rate of NH4 + and NH3 electro-oxidation via Eq. 2 and Eq. 3, thereby enhancing the thermodynamic feasibility of AOR. As seen in Fig. 4, pH also influences the region of hydrogen desorption likely because of the change of proton donor from hydronium to water in more alkaline media. 65 Local pH drop has been considered a challenge during the non-pulsed potentiostatic/galvanostatic electrolysis. 66 The advantage of the presented pulse approach is that, by the circulation of the solution in a closed loop, the thickness of the dynamic diffusion layer can be diminished during pulsing potentials. 42 The pH was monitored continuously during our test station and the pH drop of about 1.5 was detected after about 4 h of pulse electrolysis (see Fig. S5), mostly due to the removal of ammonia. On the other hand, the local buildup of excess OH− is not desired either since it may cause hydroxyl or nitrate poisoning and blockage of the available active sites to interact with ammonia. 67 Hence, pulse electrolysis can feature unique tunability to maintain an appropriate level of OH− concentration at the surface that could alleviate the undesired impacts of local acidity/alkalinity.
Effect of NaCl addition
In contrast to direct AOR, indirect AOR is a condition when ammonia oxidation occurs through an oxidant intermediate such as Cl2, HClO, ClO−, etc. The effect of NaCl addition on AOR and NRR at constant current/potential has been investigated by several researchers. 68,69 A small amount of NaCl (in a range of 0.5 g l−1) can lead to an improvement in the kinetics of AOR. The CV and Linear Sweep Voltammetric (LSV) of 60% Pt9Ir/C catalyst (loading 0.25 mg cm−2) in 8.3 g l−1 (NH4)2SO4 solution at different NaCl concentrations and two different pHs are depicted in Fig. 5. There is a clear increasing trend in the ammonia detoxification after adding NaCl. In an aqueous solution, Cl− is oxidized to Cl2(aq.), which immediately reacts with water to form strong oxidizing species, i.e., hypochlorite (ClO−) and hypochlorous acid (HClO). As reported by Su et al., 70 in the presence of hypochlorite and hypochlorous acid, additional oxidation pathways such as Eq. 4 are supplied, which could further oxidize ammonium to nitrogen. As seen in Fig. 5b, the peaks related to the hydrogen oxidation reaction show a minor drop in the presence of chloride, implying that Cl− could hinder hydrogen desorption. It could be that the chlorination through Eq. 4 yielded an abundant generation of H+, causing a slight pH drop in the bulk solution that can sluggish the hydrogen desorption. 15 This observation is also consistent with the previous voltammogram results shown in Fig. 4, where hydrogen desorption was favored in less acidic media.


Figure 5. Effect of NaCl addition on voltammetric response of 60% Pt9Ir/C at (a) pH 12.85, (b) pH 11. Base solution: 8.3 g l−1 (NH4)2SO4 + 6 g l−1 NaOH.
Download figure:
Standard image High-resolution imageIt is important to bear in mind that the observed increase in the peak current in the presence of NaCl could be attributed to its effect in reducing the ohmic resistance of the solution. 71 Owing to the problem of iR-drop during DC potentiostatic/galvanostatic mode of operation, pulsing can aid in alleviating the ohmic resistance as described elsewhere. 39,43 During continuous recirculation of the solution through the loop, no chemical precipitation or sediment was observed in the feed tank or the reactor itself.
Two sets of pulse electrolysis were performed in the absence and presence of NaCl in a 225 cm2 flow cell with a pair of 60% Pt9Ir/C catalyst (loading 0.25 mg cm−2) in 8.3 g l−1 (NH4)2SO4 + 18 g l−1 NaOH solution. By adding 1 g l−1 NaCl to the electrolysis cell, the average current, the ammonia removal after 2 h, and the Faraday efficiency improved from 4.45 A to 4.63 A, from 0.80 to 1.4 g, and from 86.4% to 96.4%, respectively. Kapalka et al. argued that the reaction between chlorine and ammonia occurs so fast that it could compete with the decomposition or oxidation reaction of chlorine to chlorate, leaving no harmful chlorate or perchlorate in the system. 72 The authors claimed that free chlorine could also speed up the oxidation of nitrate/nitrite by-products due to their rapid interaction with hypochlorite, which produces ammonia and facilitates the generation of harmless nitrogen. 72 By contrast, a few studies reported that chloride hinders the NRR. 73
Effect of temperature and catalyst loadings
To evaluate the influence of temperature and catalyst loading, two different temperatures and three different catalyst loadings were examined under an applied pulse potential of ±0.925 V. The corresponding current waves are shown in Fig. 6. For all conditions, the electrolysis was carried out in a 225 cm2 flow cell with a pair of 60% Pt9Ir/C electrodes (loading 0.2 mg cm−2) in 8.3 g l−1 (NH4)2SO4 + 6 g l−1 NaOH solution.

Figure 6. Effect of (a) temperature, and (b) catalyst loading on ammonia electrolysis in 225 cm2 flow cell in 8.3 g l−1 (NH4)2SO4 + 6 g l−1 NaOH solution. Anode and cathode electrodes made of 60% Pt9Ir/C.
Download figure:
Standard image High-resolution imageBased on the Arrhenius equation of dependency of reaction rate on temperature, the average current associated with AOR increased from 12.2 mA cm−2 to 31.2 mA cm−2, as the temperature elevated from 38 °C to 60 °C (Fig. 6a). At 60 °C, a higher rate of ammonia removal was attained within a shorter period of electrolysis time. The higher temperatures boost the kinetics of electron transfer, the average speed of the reactant molecules, adsorption, ionic strength, conductivity, and the rate of diffusion-controlled steps, thus improving the overall kinetics. 11 Furthermore, Wang et al., 74 claimed that at high temperatures NH3 is thermodynamically more stable than NH4 +, and consequently, AOR could be triggered via direct oxidation of NH3. As the cell temperature rises, ammonia is initially transformed into hydroxylamine, and further oxidation of adsorbed hydroxylamine might generate either N2 gas or NOx molecules according to 74 :

Operating the flow cell reactors at intermediate temperatures might lead to additional costs, especially when it comes to scaling up. Consequently, tuning the catalyst material itself to obtain greater cell efficiency is preferred economically.
As shown in Fig. 6b, by increasing the loading of the Pt9Ir/C catalyst from 0.25 to 0.35 mg cm−2, the average current density raised first since it enhances the charge transfer, but further increment of the loading could not deliver higher currents. Further increase of the loading beyond 0.35 mg/cm2 would not improve the performance. It could be that at higher loadings the distance between electron transfer sites at the electrode surface increases, thereby lowering the accessibility for the catalyst and enhancing the mass-limitations. 75 It has been reported that hydroxyl concentration plays a more critical role than the mass loading during AOR. 44 The catalyst loading would also affect the electrocatalytic activity by modifying the intercrystallite distance (ICD). 76,77 The ICD in nm could be estimated according to 76 :

where σ, Dp , SAC , and y stand for catalyst density in g/nm3, particle size in nm, specific surface area in nm2/g, and catalyst loading on carbon Vulcan support in wt% respectively. At higher mass loadings the ICD decreases, thereby restricting the further improvement of the catalytic activity. 76
Nitrate electro-reduction —electrocatalytic characterization of CuNi/C cathode
Turning now to the cathode side for nitrate removal, copper is considered among the catalysts with the greatest activity toward NRR. 78,79 Several attempts have reported that CuNi is the most promising catalyst with a strong activity toward NRR. 5,18,32,33,35,78 Alloying Cu with Ni enables upshifting of the d-band center in Cu sites toward the Fermi level that can modulate the adsorption energy of the intermediates such as nitrate, nitrite, and *NH2. 2,35 To find an appropriate CuxNi1-x catalyst for NRR, four different series of metallic CuxNi1-x compositions were initially electroplated and characterized. Four different series of CuxNi1-x catalysts with different elemental compositions were prepared by carefully controlling the molar ratios of metal ions in the electrolyte and controlling the deposition parameters (e.g., deposition time, voltage, current, etc). Figure S6 shows the SEM micrographs of the electroplated CuxNi1-x coatings on a Ni mesh substrate. Figure S7 and Table S3 represent the EDS spectra and summary of the elemental analysis using EDS and the corresponding chemical composition of each grade of CuxNi1-x. The CV and the chronoamperometry of bimetallic CuxNi1-x catalysts with a range of different compositions are compared in Fig. S8. The test solution was 0.1 M NaOH + 23 ppm N-NO3 −. It could be seen that the Cu91Ni9 catalyst retains a more substantial integrated charge with a higher current density associated with NRR. This agrees with Simpson's finding, 80 who reported that the nitrate removal rate for the case of Cu91Ni9 was superior to other CuxNi1-x compositions. This result also matches those observed in earlier studies, 32,33 where the highest performance for NRR was acquired for CuxNi1-x compositions rich in Cu. The oxidation peak seen in Fig. S8a is likely assigned to the oxidation of copper in bimetallic CuNi alloy. 20 According to the chronoamperometric transients shown in Fig. S8b, the highest current density was obtained for Cu91Ni9 catalyst. A lower activity of alloys with excessive ratios of Ni (i.e., Cu60Ni40 and Cu25Ni75) might be due to abundant adsorption of *NH2 that decreases the available Cu sites to interact with nitrate. 2 Pure Ni is almost inactive toward NRR. Ni actually has a synergistic effect on Cu, leading to a better performance for NRR since Ni sites accelerate the adsorption of Hads., while Cu sites act as spots for NO3 − adsorption. 80 Ni addition can tune the electronic structure of Cu thus modifying its adsorption energy to interact with nitrate intermediate. 5 Cu9Ni supported on carbon Vulcan (Cu9Ni/C) is presumably a reasonable choice for the conversion of nitrate to ammonia. Having identified the suitable Cu:Ni elemental ratio, it will be necessary to find the optimal percentage of metallic Cu9Ni to the carbon Vulcan support as well. In achieving this goal, six series of catalysts with different Cu9Ni-to-support ratios were prepared by carefully tuning the concentration of metallic precursors during the polyol process (Table I). Loading more than a particular amount of metallic Cu9Ni nanoparticles on carbon support is not viable since the carbon Vulcan has a specific uptake capacity. As the analysis of weight measurements in Table I shows, the minimum Cu9Ni catalyst loss (about 10%) during the polyol-impregnation process was acquired for 40% Cu9Ni/C. 46.2% and 55.5% of the loss was found for 60% and 50% Cu9Ni/C catalysts, respectively, which indicate that it is impractical to obtain uptakes higher than 50% or 60% Cu9Ni, without remarkable loss of the nanoparticles. Figure 7a shows the XRD patterns and TEM image of the as-prepared Cu9Ni/C catalysts.
Table I. Six different grades of Cu9Ni/C catalysts and the corresponding weight analysis during the polyol process.
| Catalyst | gram Carbon in batch | Grams of Cu9Ni in batch | Expected weight of synthesized batch | Final real weight of synthesized batch | % Difference in weight of metal-carbon support |
|---|---|---|---|---|---|
| 60% Cu9Ni/C | 0.2 | 0.3 | 0.5 | 0.2228 | 55.50% |
| 50% Cu9Ni/C | 0.25 | 0.25 | 0.5 | 0.269 | 46.20% |
| 40% Cu9Ni/C | 0.3 | 0.2 | 0.5 | 0.4485 | 10.00% |
| 30% Cu9Ni/C | 0.7 | 0.3 | 1 | 1.3949 | 39.50% |
| 20% Cu9Ni/C | 0.8 | 0.2 | 1 | 0.5912 | 40.80% |
| 10% Cu9Ni/C | 1.8 | 0.2 | 2 | 3.3731 | 68.60% |
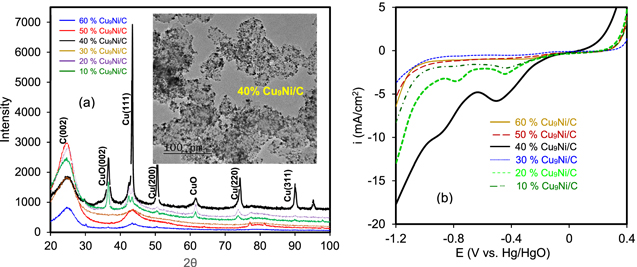
Figure 7. (a) XRD patterns and TEM image of 40% Cu9Ni/C catalyst, (b) LSV for six different series of Cu9Ni/C catalysts in 18 g l−1 NaOH + 165 ppm N-NO3 -, scan rate 25 mV s−1.
Download figure:
Standard image High-resolution imageThe XRD spectrum of as-prepared 40% Cu9Ni/C nanoparticles demonstrates the sharp peak of Cu(111) lattice located at around 43.2o, which is consistent with a composition close to CuNi rich in Cu (card no. ICDD 00–003–1005). Using Debye–Scherrer's equation, a uniform particle size distribution of about 4–5 nm for Cu9Ni nanoparticles was calculated, which agrees with TEM observations in the inset of Fig. 7a. The broad peak located at around 25o is due to the C(002) plane of the carbon Vulcan support. 40% Cu9Ni/C revealed the strongest peak of Cu(111), implying that the polyol-impregnation method of synthesis for this catalyst was more successful than other series. Small CuO XRD peaks can also be seen in the spectra (card no. ICDD 00–005–0661). To calculate the total surface area of the catalysts, the N2 physisorption BET technique was carried out. Based on BET analysis, 20%, 30%, and 40% Cu9Ni/C catalysts showed higher specific surface areas, among which the 40% Cu9Ni/C catalyst with 92.02 m2 g−1 had the highest BET area (Table S4). It is worth mentioning that these three catalysts were those with the lowest material loss during the polyol-impregnation synthesis procedure (see Table I). The specific surface area for the as-prepared 40% Cu9Ni/C catalyst herein is superior to those reported by other researchers. 6,17 Figure S9 compares the quantity of adsorbed nitrogen gas vs relative pressure for three different grades of Cu9Ni/C catalysts. The quantity of the adsorbed N2 gas for the 40% Cu9Ni/C catalyst is higher than those for 30% and 20% Cu9Ni/C. A higher number of active sites can improve the adsorption of the reaction intermediate during NRR, therefore enhancing the denitrification rate for 40% Cu9Ni/C catalyst. 81 Turning now to the comparison of the electrochemical response of these catalysts, Fig. 7b shows the LSV responses of six different series of Cu9Ni/C catalysts in 18 g l−1 NaOH + 165 ppm N-NO3 − solution. The voltammograms show an onset of cathodic current at about −0.2 V vs Hg/HgO. The current signal increases in the order of 40% Cu9Ni/C > 20% Cu9Ni/C > 30% Cu9Ni/C. This observation agrees with BET data (Fig. S9), wherein the highest geometric active surface area was attained for 40% Cu9Ni/C. In addition, the remarkable efficiency of Cu for nitrate removal might be attributed to the high affinity of N-species to be adsorbed on Cu sites to provoke NRR. 9 Mattarozzi et al. demonstrated a synergistic mechanism for Cu9Ni, where Cu sites act as the active sites for nitrate adsorption and Ni sites have the highest affinity for Hads. adsorption. 78 The NRR in alkaline media can be described through a multistep mechanism that proceeds via pathways with at least two steps. 78,82 The possible steps are shown in the following equations:


Observing two peaks as shown in Fig. 7b suggests a two-step mass-transfer-controlled process for NRR on 40% Cu9Ni/C catalyst. 83,84 These peaks did not appear for 40% Cu9Ni/C catalyst in the absence of nitrate (Fig. 8a), which confirms that they are not ascribed to the reduction of Cu2O to Cu as it was observed by other researchers for non-alloyed copper. 4 This shows the beneficial effect of amalgamating Cu with Ni to enhance the corrosion resistance of the cathode in the present work. The NRR initiates with the nitrate adsorption on Cu sites and its subsequent reduction to nitrite, which is recognized as the rate-determining step during NRR. 2,8 It has been reported that the wave at around −0.5 to −0.7 V (Fig. 7b), corresponds to the reduction of nitrate to nitrite, followed by a series of deoxidation steps at more negative potentials according to Eqs. 7–9. 84 At the region of the potential between −0.9 to −1.1 V vs Hg/HgO, which is close to the potential range of the hydrogen evolution reaction, Hads and nitrite interactions are thermodynamically more feasible. 2,32,33 Therefore, at this range of potential, there will be the possibility for nitrite formation. 29,32,33 Our measurements indicated that ammonia was produced with a rate of about 0.12 ppm/min during NRR (see Fig. S10).

Figure 8. LSV of 40% Cu9Ni/C catalysts (a) in absence and in presence of 165 ppm N-NO3 − and (b) at different nitrate concentrations. Base solution: 10 g l−1 NaOH, scan rate 25 mV s−1.
Download figure:
Standard image High-resolution imageFigure 8b illustrates how the increase in nitrate concentration leads to a higher cathodic current for NRR. The blank solution that was used to exclude the other interference was 10 g l−1 NaOH. The peak currents exhibit a linear increase with nitrate concentration, implying that the NRR is likely first order with respect to the nitrate over the concentration range of 300 ppm. The 40% Cu9Ni/C catalyst was also benchmarked in terms of nitrate conversion to ammonia and ammonia selectivity (SNH3 (%)) in a three-electrode cell. Figure S11 displays the selectivity toward ammonia and the rate of nitrate removal using a 40% Cu9Ni/C electrode (applied potential of −1.3 V vs Hg/HgO at 38 °C, duration of electrolysis = 1 h). The following Eq. 14 was used to determine SNH3 (%).

where CNH3,t , CNO3−,i , and CNO3−,t represent the concentration of produced ammonia, initial concentration of nitrate, and nitrate concentration over time, respectively. The selectivity toward ammonia from removed nitrate after 1 h and the average percentage of nitrate removal was calculated to be about 82% and 65%, respectively. The results presented thus far support that 40% Cu9Ni/C can be used as a robust catalyst for NRR.
Simultaneous ammonia and nitrate removal in an undivided cell
Having identified the optimal catalysts for AOR and NRR, in the last section, these two catalysts were integrated into a single cell to concurrently perform both NRR and AOR in an undivided flow cell. The performance of three different cells (No. #1, No. #2, and No. #3) were examined. First, a 25 cm2 lab-scale cell integrating Cu9Ni/C as the cathode (loading 0.25 mg cm−2) and Pt9Ir/C as the anode (loading 0.5 mg cm−2) was assembled (cell No. #1 shown in Fig. S12). The pulse electrolysis was carried out in a solution containing both nitrate and ammonia (8.3 g l−1 (NH4)2SO4 + 6 g l−1 NaOH + 23 ppm N-NO3 −). Meanwhile, the ppm of nitrate/nitrite and ammonia were monitored according to the techniques described previously in the experimental section. Fig. S13a represents the ppm concentration of ammonia/nitrate over time. After 2 h of pulse electrolysis, the removal rate in cell No. #1 was 4.147 ppm NH3/min and 0.025 ppm NO3 −/min. Figures S13b and S13c represent the effect of CuNi/C loading on the average rate loss of ammonia/nitrate and total ppm loss of ammonia/nitrate after 2 h. As the loading of the Cu9Ni/C catalyst increased from 0.25 to 1 mg cm−2, the rate of removal per min increased from about 0.005 to 0.03 ppm NO3 −/min and from 0.42 to 0.52 ppm NH3/min. An electrochemical system integrating Cu9Ni/C as the anode and Pt9Ir/C as the cathode is capable of concurrent AOR and NRR. The catalysts based on Pt and Pt-Ir have been also used for nitrate removal, 85 however, their activity toward NRR is much lower than Cu-based catalysts. Pt9Ir/C catalyst tends to provoke the NRR through the adsorption of Hads. since Pt sites have a remarkable affinity for adsorbing hydrogen. 2 In addition, the synergistic effect between Cu and Ni can remarkably promote the capability of Cu9Ni/C catalyst even for AOR due to the formation of mixed Cu1-xNixOOH intermediates with a strong affinity for binding to Nads.. 86,87 Hence, AOR and NRR are achievable on both electrodes while switching the electrode polarity periodically during the pulse. In addition to the small 25 cm2 cell, the synchronous removal of contaminants was also examined in a large 225 cm2 cell (cell No. #2). Figure 9a illustrates the current waves during the first 40 min of electrolysis in a 225 cm2 flow cell (anode: 60% Pt9Ir/C and cathode: 40% Cu9Ni/C) in a solution that initially contained 1900 ppm ammonia and 32 ppm nitrate. It is worth mentioning that the current wave for cell No. #2 is asymmetric since the electrodes were not identical (in contrast to the symmetric waveform shown in Fig. 2, where both electrodes were the same). The blue and red reference lines represent the average current densities associated with AOR on Pt9Ir/C and NRR on Cu9Ni/C, respectively. Solution samples were taken every half hour to monitor the concentration of nitrate and ammonia. Table S5 and Fig. 9b represent the corresponding concentration profiles over time.
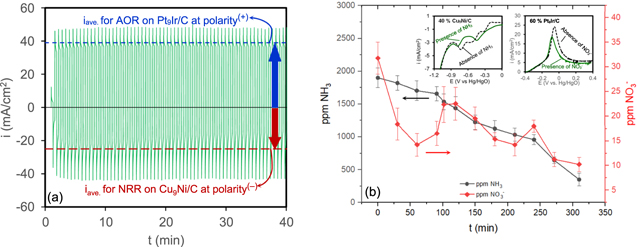
Figure 9. (a) pulse electrolysis, (b) concentration of ammonia and nitrate during pulse electrolysis process in 18 g l−1 NaOH + 1900 ppm ammonia + 32 ppm nitrate in a 225 cm2 cell No. #2 (anode: 60% Pt9Ir/C and cathode: 40% Cu9Ni/C). The insets show the LSVs for 40% Cu9Ni/C and 60% Pt9Ir/C catalysts after addition of 1900 ppm ammonia and 32 ppm nitrate, respectively (base solutions were 10 g l−1 NaOH + 165 ppm N-NO3 - for 40% Cu9Ni/C, and 10 g l−1 NaOH + 1500 ppm ammonia for 60% Pt9Ir/C): scan rate 25 mV s−1.
Download figure:
Standard image High-resolution imageThe rate of removal was about 5.167 ppm NH3/min and 0.073 ppm NO3 −/min. This finding supports the idea that simultaneous removal in an undivided flow cell is achievable under certain alkaline conditions. The residence time of the water is defined as the amount of the reservoir divided by the out/in-flow rate at steady-state. Given the reservoir volume of 2 l for the cell and our operational steady flow rate (2 lPM), the residence time would be about 1 min, which means one pass per minute of the solution is expected. Consequently, the conversion rates would be about 5.167 ppm NH3 per pass and 0.073 NO3 − per pass. The total number of passes was about 310 times. Considering the residence time of 1 min, the pulse width of 18 s. is short enough to assure the residency of the electrolyte in the cell for AOR/NRR reactions to take place. During pulse electrolysis, a large volume of gas bubbles was observed inside the cell. The produced gas was collected and analyzed via gas chromatography (GC) (Fig. S14). The GC analysis shows the sharp peaks corresponding to the gaseous N2 and H2 due to NRR and AOR. It is worth mentioning that the electrolysis does not generates oxygen and the O2 peaks in GC might relate to the sample injection which gets contaminated with air. The rate of gas production was measured to be about 50 cm3/min in this study. The produced hydrogen, as a gaseous energy carrier, could be stored for subsequent recovery of energy. The produced hydrogen was safely diluted by mixing with air and carefully released at room temperature. The viability of simultaneous removal in a 25 cm2 flow cell integrating similar electrodes prepared by spraying an identical mixture of 60% Pt9Ir/C-40% Cu9Ni/C (v/v 50%) ink on both electrodes was also examined (cell No. #3). Fig. S15 represents the electrolysis waveform and the corresponding concentration profiles of ammonia and nitrate. Note that the waveform for cell No. #3 is symmetric (compared with the waveform for cell No. #2 in Fig. 9a), since electrodes are identical both were made of a single mixture of Pt9Ir/C + 40% Cu9Ni/C (v/v 50%). As shown in Fig. S15b, the rate of removal in cell No. #3 was about 1.334 ppm NH3/min and 0.043 ppm NO3 −/min much smaller than those in cell No. #2. Collectively, the performance of the cells for ammonia and nitrate removal improved in order of cell No. #2 > cell No. #1 > cell No. #3 and cell No. #2 > cell No. #3 > cell No. #1, respectively. In general, the performance of the cells for AOR is superior to NRR, which requires further investigations on the effect of pulsing on the kinetics of NRR to further improves its efficiency. In the case of the synchronous removal of nitrate and ammonia, it is essential to examine how both electrodes respond independently to the addition of either nitrate or ammonia. The insets of Fig. 9b show the LSVs of Cu9Ni/C and Pt9Ir/C in the case of multiple ammonia and nitrate contamination (green curves). The dashed black curves show the LSV of Cu9Ni/C and Pt9Ir/C for single nitrate and ammonia contamination, respectively. In the case of multiple contaminants, the characteristic peaks were shifted to more negative potentials with an apparent decrease in the peak current for both AOR and NRR. This is because ammonia retards NRR by competing for electron pairs at adsorption sites of Cu, causing a rise in the required energy for reduction. 8 Similarly, the presence of nitrate retarded the kinetics of AOR as a slight decrease of peak current is seen after nitrate addition. It seems possible that nitrate could act as the site-blocking agent that deactivates the Pt sites available for AOR. 88
Little is known about the dynamic of the mass transfer and the evolution of the double-layer capacitance during pulse electrolysis. 38,39 Two diffusion layers during the pulsing potential are expected 41 ; one dynamic layer adjacent to the electrode surface and the other one further outside which becomes stationary after a few cycles of pulse. 41 The diffusion layer near the surface does not penetrate the convection-controlled region, therefore, the ions being consumed at the surface must be diffused to the boundary of the dynamic layer. 41 In the dynamic layer, the concentration of ions changes sinusoidally. The behavior of the double layer during pulsing potential can be recognized according to Eq. 15 41 :

where CO , Cb , δN , δP , z, and D are the concentration at the outer boundary, the concentration in the bulk, the thickness of Nernst's diffusion layer, the thickness of the dynamic layer, the charge number, and the diffusion coefficient of the ion. δP represents the inherent dynamic feature of the diffusion layer during switching the polarity. At the end of each pulse, the thickness of the dynamic diffusion layer (δP ) is independent of bulk concentration but proportional to the square root of the pulse width. On the other hand, δN is independent of pulse width but proportional to the square root of transition time. During our constant potential electrolysis, the observed transition time to reach the steady plateau was longer than 1 min Thus, the pulse width of 18 s. is fast enough to make the δP extremely thin, thereby diminishing the limitations due to the mass transfer. 41 The thickness of the diffusion layer during the pulse electrolysis is proportional to the square root of the off-time. 39 The off-time in this work was almost zero, which makes the effect of the double-layer capacitance extremely small. No previous study has investigated the mechanism of simultaneous AOR and NRR in an undivided electrochemical cell during pulse electrolysis. During the positive cycle, one electrode is the anode where the ammonia oxidation takes place, and the other electrode is the cathode, where nitrate reduction to ammonia, nitrite, and nitrogen occurs. The opposite happens when polarity is switched from positive to negative. Once nitrate is reduced to ammonia on the cathode side, the produced ammonia diffuses toward the anode side to be oxidized to the harmless species. This circular process gradually reduces overall nitrogen pollution. The peculiar nature of the mass transport and the complex feature of the capacitance double layer during the pulse require further investigation and extend beyond the scope of the present study. According to the Langmuir-Hinshelwood mechanism of AOR, the N−N coupling reaction between *NOx and *NHx (or ammonia) could prompt the formation of N2 on Pt sites. 88 Under the constant potential/current electrolysis, AOR and NRR could be decelerated due to the excess of OH−, NOx, or NHx species at the electrode surface. 88–90 Indeed, the potentiostatic or galvanostatic electrolysis was also tested during our study for a few runs (Fig. S16), but it never delivered the same current as created during the pulse AOR. It could be that pulsing can reduce the ohmic drop effect, as reported by Rocha et al. 39 and Puippe et al. 43 Furthermore, the pulse technique presented herein can mitigate the limitations due to the mass transfer effect by reducing the thickness of the diffusion layer as discussed previously. 38 This technique appears to be a highly efficient approach to target multiple contaminants in a single system treatment pass. The cell size in this study (225 cm2) is larger than the ones fabricated recently by other researchers, 8,26 who built a 20 cm2 cell for the simultaneous removal of nitrogen contaminants. The flow cells and all setups used in this study are easy to build, which is promising for scaling-up purposes in wastewater treatment plants. Further investigations need to be carried out to assess the feasibility of operating the presented pulse technique on a pilot scale in the field in the presence of other water contaminants.
Catalyst stability
Ten consecutive cycles were performed to evaluate the variation of electrode performance with repeated use. The stability of the catalysts was evaluated for 10 electrolysis runs at an intermediate temperature of 50 oC (Fig. 10). Each electrolysis cycle lasted 3 h. The ammonia and nitrate removal after the tenth cycle (79.1% and 64.1%, respectively) were consistent with the initial rate of removal (81.5% and 67.8%, respectively). This indicates the stability of both 60% Pt9Ir/C and 40% Cu9Ni/C catalysts toward AOR and NRR, respectively.

Figure 10. Removal rate over 10 cycles of pulse electrolysis in 18 g l−1 NaOH + 1900 ppm ammonia + 32 ppm nitrate solution (225 cm2 cell: anode: 60% Pt9Ir/C and cathode: 40% Cu9Ni/C).
Download figure:
Standard image High-resolution image
It was also noted that after 10 cycles, the characteristic peaks of iridium oxide (IrOx) appeared in XRD diffraction patterns for the 50% Pt3Ir/C series of catalysts (Fig. S17). Thus, for the 50% Pt3Ir/C catalyst, the long-term electrolysis process may trigger the oxidation of Ir and deteriorate the catalyst activity for AOR. However, such peaks were not detected for 60% Pt9Ir/C, which indicates the superior stability of 60% Pt9Ir/C over 50% Pt3Ir/C in the long term. This was basically the fundamental reason why 60% Pt9Ir/C was chosen initially for further examination in this study. Nads. adsorption is claimed to be the main reason for surface poisoning and subsequent deterioration of the catalyst activity. 27 To tackle the poisoning challenge, pulse electrolysis is reported to be beneficial since it can reactivate the active facets of the catalyst, thereby restoring stability during operating cycles. 42 The choice of operational conditions in this study was in accordance with the subsequent application in zeolite ion exchange columns evaluated by the author's group in the Ammonia GreenBox pilot system at the City of Athens Wastewater Treatment Plant. 49 In this work, we chose to operate at the pulse width of 18 s, since we experimentally tested different scenarios and it was found that a pulse duration of 18–20 s led to the highest current density associated with electrolysis (see Fig. S18 and Table S6). Additionally, the spacing between electrodes was kept fixed at 8 mm because other designs led to lower current output (see Fig. S19 and Table S7). Thus, 8 mm spacing between the electrodes was the optimum design for assembling the flow cells.
Electrical energy consumption
According to an energy calculation in a 2 l flow cell (V = 2 l) with an average pulse current of I = 3.85 A under a pulsed potential of U = 0.92 V after 5 h of electrolysis the electrical energy consumption (Eelectrical ) by taking an average removal of Δppm = 1660 ppm NH3, is determined to be 5.33 × 10⁻³ kWh g−1-NH3 ( 5.33 Whg−1 NH3, Eq. 21), which is about 90% lower energy consumption compared to the other reported techniques for ammonia removal 15,46 and comparable to the results reported by Diaz and Botte, 63 energy consumption is lower when accounted for the hydrogen produced.
Similarly, in a 2 l flow cell system with an average current of 0.12 A under an applied potential of 0.96 V after 5 h of electrolysis, by taking an average removal of 19 ppm NO3 −, Eelectrical is determined to be 1.4 × 10⁻² kWh g−1-NO3 − (Eq. 22), which is about 50% lower energy consumption compared to the other reported techniques for NRR. 1,26,45,47,48
It is worth mentioning that the potential window of operation in the present work is much narrower than what was reported elsewhere for AOR. 4 This can conserve energy in specific ways, making wastewater treatment strategies more affordable. Typically the Ti/IrO2 or RuO2-IrO2/Ti anodes with an operational potential range of about ±2 V to 10 V are reported in the literature for AOR, 4,12,15 which is much higher than the potential range of operation in this study. Fabricating a single cell for the treatment of multiple contaminants at once is more convenient than building a multi-chamber design to remove ammonia and nitrate separately. The introduced pulsed technique discussed herein could be considered a promising one to reduce the capital costs for operating simultaneous AOR and NRR through a one-step treatment technique.
Conclusions
The results of this work demonstrated the great potential of using a pulse technique for the simultaneous removal of nitrate and ammonia in an undivided cell. A series of PtxIr1-x and CuxNi1-x supported on carbon catalysts were prepared to serve for AOR and NRR, respectively. Although applying pulse electrolysis in a flow cell integrating 60% Pt9Ir/C as the anode and 40% Cu9Ni/C as the cathode was vividly capable of synchronous treatment of nitrogen contaminants, further investigations are still required to better understand the mechanistic impact of pulsing on synchronized NRR and AOR in a single cell. The nitrogen pollutants were gradually removed by increasing the number of electrolysis cycles. The hourly rate of removal in a 225 cm2 cell was about 310 ppm ammonia and 4.4 ppm nitrate. The selectivity toward ammonia from removed nitrate and the average percentage of nitrate removal was about 82% and 65%, respectively. In addition, the synthesized catalysts were proved to have good stability after 10 cycles at intermediate temperatures. The method introduced herein uses 5.33 × 10⁻³ kWh g−1-NH3 and 1.4 × 10⁻² kWh g−1-NO3 − electrical energy which is less energy than many other available technologies for nitrogen decontamination. As the next step, the knowledge obtained by the present study should be scaled to a pilot application and evaluated in the presence of other contaminants.
Acknowledgments
This work was partially funded by the National Science Foundation I/UCRC: Center for Electrochemical Processes and Technology (CEProTECH), award number IIP-1362075, the Center for Electrochemical Engineering Research (CEER), and the Chemical and Biomolecular Engineering Department at Ohio University. The authors would like to thank Payman Sharifi Abdar and Benjamin Sheets for their help rendered in conducting the transmission electron microscopy work.
Supplementary data (7.8 MB DOCX)