
Abstract
Mass transport losses in proton exchange membrane water electrolysis (PEMWE) cells have gained increased focus in recent years, however two-phase flow within the anode catalyst layer (ACL) has not been extensively studied. This work uses 2-D, finite element simulations with a capillary pressure based model to study two-phase flow in the ACL. The porous media are characterised using a pore size distribution (PSD), allowing for the impact of structural changes to be analysed. The results show the reaction distribution heavily influences gas accumulation within the ACL: bubbles produced close to the membrane induce high gas pressures in the ACL, while bubbles produced close to the porous transport layer (PTL) allow for an easy escape to the PTL. Very high gas saturations are required in the ACL to have an appreciable impact on performance, which is difficult to achieve given the hydrophilic nature of the anode electrode. Therefore, it is likely that sections of the ACL need to be screened by large bubbles to induce significant losses. The PTL saturation had a minimal effect on ACL saturation, as each layer has a very different intrusion curve. As such, characterization of the ACL microstructure is crucial to understanding PEMWE mass transport limitations.
Export citation and abstract BibTeX RIS

This is an open access article distributed under the terms of the Creative Commons Attribution 4.0 License (CC BY, http://creativecommons.org/licenses/by/4.0/), which permits unrestricted reuse of the work in any medium, provided the original work is properly cited.
A major barrier to the widespread deployment of proton exchange membrane water electrolysis (PEMWE) is its high cost. At present, estimates for the cost of hydrogen produced using renewable energy to split water are 5 $ kg−1, with the US Department of Energy targeting a price of 1 $ kg−1 by 2030 in order to meet climate change goals. 1 High capital costs at the cell level are incurred from the use of rare platinum group metals as catalysts for the hydrogen and oxygen evolution reactions, as well as the titanium based porous transport layer and flow field/end plate in the anode. 2 High operating costs are incurred from the inefficiency of the water splitting due to a variety of losses, typically divided into three categories: (i) kinetic losses, which refer to the overpotential required for the evolution reactions to proceed with the desired current density, (ii) ohmic losses, induced from the transport of charge through various components of the cell; and, (iii) mass transport losses, caused by the inability to supply sufficient reactant, and remove product, to/from the reaction sites. The mass transport losses have received increased focus in recent years, 3,4 with DeAngelis et al. 5 noting that "The influence of this intricate two-phase flow on PEMWE cell performance has been controversially debated for the last decade and, to date, the underlying governing processes remain non-conclusive".
Part of the reason for this lack of certainty is the lack of unequivocal evidence for the mass transport losses in PEMWE. In proton exchange membrane fuel cells (PEMFC), mass transport losses are readily apparent from the limiting current that is observed at high current densities, the magnitude of which is determined by the ability of the cell to transport oxygen to the reaction site. 6 This limiting current can be reliably studied, and therefore the factors that influence the transport of oxygen to reaction sites examined, by methods such as varying the cathode pressure, oxygen content or gas diffusion layer (GDL). 7 In PEMWE, such a distinct indicator of mass transport limitations is rarely seen. For example, Rozain et al. 8 presented polarization data up to 5 A cm−2 and saw no mass transport limitations, the reason for which they attributed to choosing a porous transport layer (PTL) of correct porosity. Lettermeier et al. 9 tested membrane electrode assemblies (MEAs) from a number of suppliers up to 4 A cm−2 without any mass transport limitations. A more extreme example comes from Lewinski et al., 10 who used 3M's nanostructured thin film (NSTF) support to make an iridium based anode catalyst layer (ACL) which operated at over 15 A cm−2 without reaching a limiting current.
A number of works have identified mass transport limitations however, by separating the losses through the use of a 0-D model. 11–17 The Tafel slope and the high frequency resistance (HFR) are used to characterize the kinetic and ohmic losses respectively, and any deviation between experimentally obtained polarization curves and the curve obtained using the model is attributed to mass transport losses. Suermann et al. 12 used this method to show that mass transport limitations can be substantial over a wide current density and operating pressure range. The authors 14 also investigated the impact of PTL pore size and noted that higher transport resistances were observed for higher pore sizes which was contrary to what was expected. Kim et al. 16 studied the impact of bilayer titanium meshes and noted the importance of the interfacial contact between the PTL and ACL and the uniformity of the compression of the PTL on the ACL. Zhao et al. 17 increased the hydrophilicity of a titanium PTL and noted a substantial increase in the performance, due to a reduced gas saturation in the PTL. More extreme examples that clearly showed mass transport limitations include using fully humidified gases to provide water to the anode, rather than liquid water, 18 and using cathode water feed instead of anode water feed. 19 These methods are unlikely to be representative of a large PEMWE system however.
The use of a 0-D model to estimate mass transport losses from a polarization curve is problematic however, as it assumes that the kinetic losses can be characterised by a simple Tafel model, with a slope determined from an in situ measurement. The kinetics of the oxygen evolution reaction (OER) are complex, with a number of mechanisms being proposed. 20–22 It is possible that the Tafel slope for the OER may change at higher overpotentials, 23,24 as has been recorded for the oxygen reduction reaction (ORR) in platinum/carbon (Pt/C) based catalyst layer in PEMFCs. 25–27 Measuring the Tafel slope itself is also difficult, as the very low electronic conductivity of the iridium oxide based catalysts that are commonly used may limit the range of current densities for which the ohmic resistance is negligible. For example, Schuler et al. 22 measured the HFR of an MEA at very low current densities with an ACL composed of IrO2 on TiO2, and found that the HFR increased with increasing current density after only 10 mA cm−2, therefore the authors considered less than 10 mA cm−2 to be the kinetic region. This method for defining the kinetic region does not take in account that the HFR may not be representative of the total ohmic resistance of the cell, as a catalyst layers contribution to the overall HFR is dominated by the more of conductive phase. 28,29 In contrast to Pt/C based CLs in PEMFCs, both phases in the ACL of a PEMWE can have poor conductivity, 30 i.e., charge transport through each phase is non-negligible. As such, it is possible that the upper limit of the kinetic region may be even lower than 10 mA cm−2. Unfortunately, it is very common to assume the kinetic region extends substantially beyond 10 mA cm−2, 12,16,17 as linearity in the Tafel plot is still observed. In terms of the ohmic losses, the use of the HFR to characterize the entire cell resistance may neglect part of the CL resistance, as discussed. In addition, it is not known how well the interfacial resistance between the PTL and ACL is captured by the HFR, and this resistance is gaining increased focus in recent years due to the high electronic resistance of the ACL. 31 This discussion is not intended to invalidate the previously cited works that quantified the mass transport resistance using the 0-D model method described, as it will likely depend on the specific electronic conductivity of the ACL used in each work, which is rarely measured. However, care should be taken when using a simple 0-D model to quantify the mass transport losses, as a number of additional losses are not accounted for. This point was also raised by Etzold et al., 4 who noted that the use of lumped parameters such as the Tafel parameters and the HFR to characterize complex phenomena fail to provide deeper insight into the causes of performance loss.
Etzold et al. 4 cited the need for more detailed mechanistic simulations of mass transport in PEMWE. As Lettenmeier et al. 32 noted however, the nature of the two-phase flow in the anode is not well understood, and also called for numerical modelling to elucidate the impact of mass transport limitations when high current density operation is used. A number of researchers have attempted visualisation studies to gain insights into the nature of the two phase flow regime, which is crucial for the formulation of a mechanistic model. Neutron imaging, 15,33–35 X-ray tomography 35–37 and direct visualisation 33,38–42 have been used to investigate the nature of the water and oxygen mixture in a working PEMWE. The focus of these works was to understand the nature of bubble formation, movement through the PTL and into the channel. Dedigama et al. 38 and Li et al. 39 found that at intermediate current densities there is a transition from bubble to slug flow in the channel. The diameter of the bubbles increases with current density and decreases with increasing temperature and water flow rates. Wang et al. 41–43 used an etched PTL with straight-through pores to allow for the bubbles emerging from the ACL to be imaged, allowing for comparison with those emerging from an PTL. The authors showed that bubbles emerging directly from the ACL tend to be smaller than those from the PTL, allowing for easier removal from the channel and a reduction in the number of slugs. Seweryn et al., 34 Leonard et al. 37 and Zlobinski et al. 35 noted that despite the hydrophilicity of the titanium PTL, a significant portion of the PTL is filled with oxygen even at low current densities. A gradient in water thickness builds up through the PTL at low current densities that is unaffected by changes in the operating current density, implying that a network of oxygen filled pores is built that transports all of the oxygen out of the ACL. Capillary forces are, therefore, thought to be the dominant transport mechanism. Arbabi et al. 36 used a microfluidic cell to mimic the transport of oxygen out of the anode PTL and had similar conclusions. Based on these visualisation studies, two-phase flow in PEMWE modelling papers are commonly described using capillary pressure models.
A number of numerical models have been developed that have investigated mass transport effects in PEMWE. Of particular interest are higher dimensional models that resolve transport through the individual layers, allowing for better design of the layers. However often the ACL is not resolved, preventing a direct study of the interaction between the two-phase flow and the OER. Han et al. 44,45 developed a model that considers only the PTL, and solves for the liquid saturation using Darcy's law and the Leverett-J function to describe the relationship between capillary pressure (the pressure difference between two phases in a pore) and saturation. Boundary conditions are not easy to apply for saturation based models: Han et al. used a function based on the current density with a fitting parameter as the boundary condition at the PTL/channel interface. Furthermore, the saturation based models assume continuity in the saturation throughout the domain, which is non-physical at the interface between two layers with different intrusion curves. The pressure of each phase will be continuous, which will result in a jump in saturation at these interfaces. Instead of saturation based models, many authors have used a capillary pressure model, where the gas and liquid pressures are obtained using Darcy's law, with the saturation obtained using a variety of methods. Olesen et al. 46 determined the saturation using a model based on the breakthrough pressure of the medium. However, the ACL was not resolved, as the focus of the work was on the channel. The ACL was assumed to be infinitely thin, with the liquid saturation in the PTL, at the ACL interface, assumed to be equal to that of the ACL. Chen et al. 47 used the same Leverett-J function as Han et al. 45 While the CL appeared to be resolved, no discussion was given regarding the gas saturation in the ACL, as the focus was on land/channel effects and liquid saturation distribution in the PTL.
A number of works do resolve the ACL and describe the two-phase phenomena within. Garcia-Salaberri 48 used a capillary pressure/saturation correlation model based on the breakthrough pressure of the medium with van Genuchten's equation. He noted the importance of the electronic conductivity to PEMWE performance and found that concentration losses were negligible for the current densities studied. Wu et al. 49 used the Leverett-J function from Han et al. 45 to relate the capillary pressure and liquid saturation. The oxygen content at the PTL/channel interface was obtained by solving a volume-of-fluid model in the channel only, with the resulting saturation being used as a boundary condition for the 3D model that captures the MEA. Wu et al. noted the importance of capturing the oxygen content in the channel, as the local current density and liquid saturation in the ACL were significantly affected. Wang et al. 40 also used the same Leverett-J function and studied along-the-channel effects as well as performing a parametric study on operating conditions and PTL properties. Wrubel et al. 50 used a capillary pressure model, where intrusion curves were used to relate the pressure to the liquid saturation. The authors noted the lack of data for intrusion curves corresponding to PEMWE ACLs in the literature and so used a curve obtained on a platinum/carbon based catalyst layer. The ACL was resolved in their model and they noted the dependence of the local current density on the ACL liquid saturation.
The aforementioned numerical models have studied the impact of two-phase flow on PEMWE performance, however their investigative abilities are somewhat limited by the need to use the Leverett-J function, an intrusion curve from a PEM fuel cell catalyst layer, or the van Genuchten model that was fitted to PEM fuel cell porous media. As such, it was not possible to vary parameters that characterize the microstructure of PEMWE ACLs, such as the characteristic pore radius, the distribution of pore radii in the layer, or the wettability of the ACL, and determine their impact on the cell performance. An alternative is to use a pore size distribution (PSD) model, which has been studied extensively in the PEM fuel cell literature, 51–56 and captures such microstructural information. To the knowledge of the authors, such a model has not been used to study two-phase flow in PEM water electrolysis.
This work presents, to the knowledge of the authors, the first PEMWE model in the literature that takes into account the anode microstructure by means of a PSD model to couple capillary pressure to micro-structure in order to predict saturation, absolute and relative permeability, and other CL intrinsic properties. This model is in contrast to those previously reported in the literature 48–50 in which the microstructure is captured with significantly less detailed models. The PSD-based PEMWE model is used to provide insights into the relationship between the microstructure, two-phase flow and cell performance. In this work, it will be shown that different OER catalysts having different effective protonic and electronic conductivities result in varying OER reaction distributions, i.e., the reaction being concentrated at either the PTL or the membrane. Oxygen will therefore be shown to evolved close to either the PTL or the membrane. The resulting impact on mass transport in the ACL will be examined, along with the impact of micro-structural parameters such as characteristic pore radius and hydrophilicity. The influence of the PTL on the ACL liquid saturation will also be discussed.
Experimental
The experimental data for this work was obtained in-house, using the methodology detailed in the works of Mandal et al. 30,57,58 The polarization data for the IrOx (ELC-0110, Tanaka Kikinzoku Kogyo (TKK)) catalyst is taken from reference 58 for the case where zero carbon was added as a pore former. The polarization data for the Ir black catalyst (3000020267 Umicore) was obtained for this work. The ACLs were fabricated with a Nafion loading of 35 wt% for the IrOx catalyst, and 5 wt% for the Ir, from a Nafion solution (Liquion LQ-1105 100EW 5 wt%, Ion Power). The ink was deposited onto an N211 membrane using the inkjet printing method, 59 to a loading of 1 mg cm−2 for each catalyst, with an electrode area of 5 cm2. The cathode catalyst layer (CCL) had a Pt/C loading of 0.1 mg cm−2 (46.7 wt% Pt/C, TEC10EA50E, TKK), a Nafion loading of 30 wt%, and was prepared using the methodology described in reference. 30
A single cell with single serpentine channel bipolar plates, consisting of a custom-made titanium plate in the anode and a graphite plate in the cathode, was used for testing. A sintered Ti PTL was used in the anode, while an SGL 28BC and an SGL 24BC were used in the cathode of the IrOx and Ir PEMWE cells, respectively. The cell was maintained at 80 °C, while the water flow rate in the anode was 15 ml min−1 throughout testing. No gases are flown through the cathode; a water lock was used to collect any water exiting with the hydrogen. The cell was conditioned by applying current densities of 0.02, 0.1, 0.2 and 1 A cm−2 for 15 min each, followed by 5 min at 2 A cm−2. Polarisation curves were obtained using linear sweep voltammetry with a potentiostat (SP300, Biologic). A scan rate of 1 mV/s was used to minimize transient effects. The potentiostat was also used to perform electrochemical impedance spectroscopy (EIS) in order to obtain the HFR for each cell.
Numerical Model
A 2-D, across-the-channel, isothermal model is used. The model solves for the potential of the solid phase, ϕs , and ionomer phase, ϕm , in Volts using Ohm's Law. Two-phase flow is accounted for by solving for both gas, pg , and liquid pressure, pl , in Pascals using the Darcy equation, with a PSD model being used to obtain transport parameters, in a similar manner to that used by Zhou et al. 55 and Kosakian. 60 The ionomer phase is assumed to be liquid equilibrated, as electro-osmotic drag and diffusion will carry water to the cathode from the anode, with the anode being continually supplied with water. As such the water content of the ionomer is not solved for. Species transport is also not solved for, as the primary impact of species concentration is on the rate of the reactions in each electrode, in particular the OER. This impact is instead accounted for using the two-phase model to predict the liquid saturation in the ACL and reducing the active area to account for gas displacing water at the reaction site.
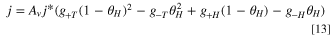
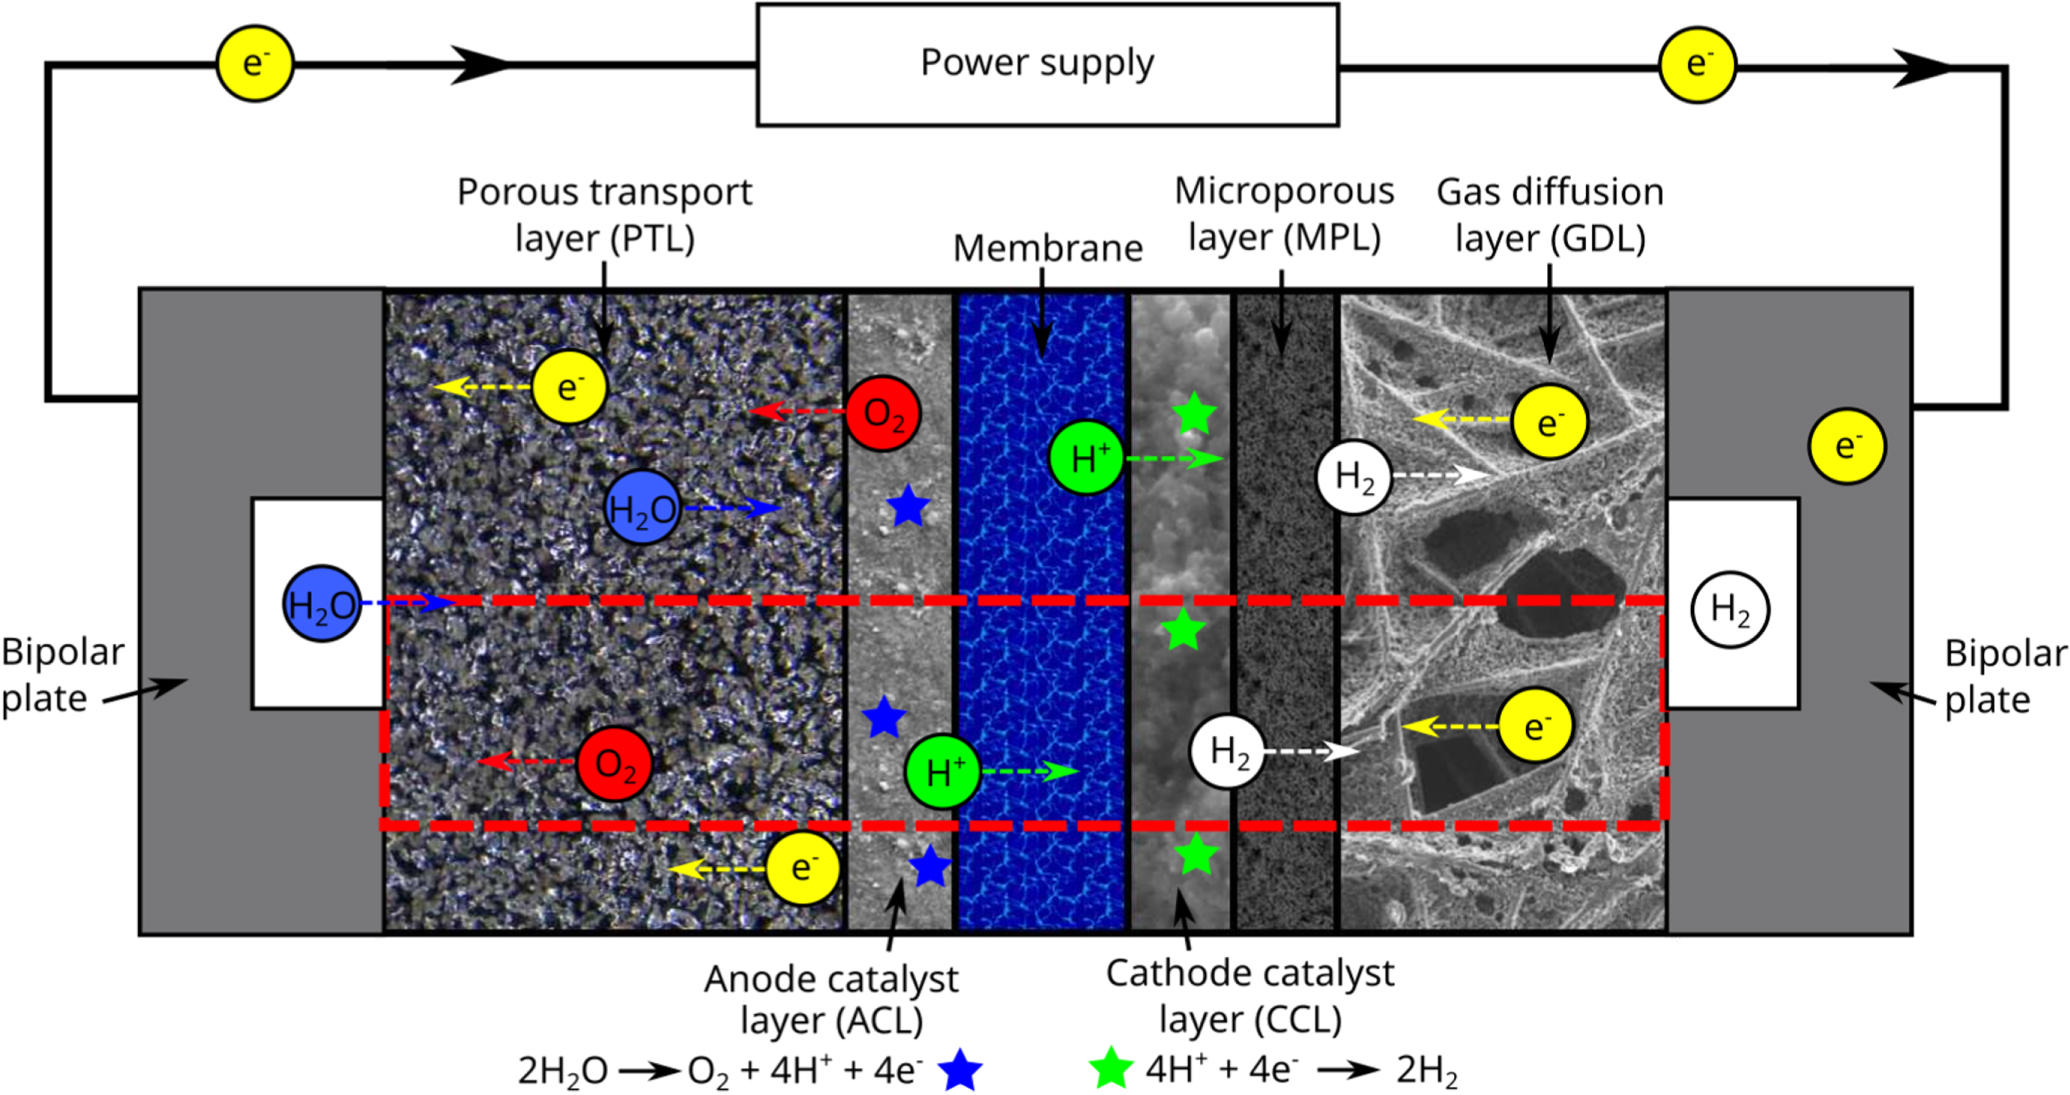
Figure 1 shows the domain in which the simulations are performed, which includes the membrane, the anode catalyst layer, cathode catalyst layer, a gas diffusion layer and microporous layer (MPL) on the cathode and a porous transport layer on the anode. The left and right boundary includes half of the channel and half of the land, with symmetry boundary conditions applied at the top and bottom of the domain.
Figure 1. Transport processes within the cell. The computational domain for all simulations is shown in the red dashed line, which includes the PTL, ACL, membrane, CCL, MPL and GDL.
Download figure:
Standard image High-resolution imageGoverning equations
The governing equations are:


where the source terms Si
for each equation are based on the current produced in each catalyst layer, as shown in Table I and is discussed below. The effective layer electronic conductivity is denoted  , while the protonic is
  . ki
is the permeability, μi
is viscosity and ρi
is the density of phase i, which is either water or oxygen. Note that Zhou et al.
55
considered the evaporation and condensation of water as additional source terms for the liquid and gas pressure equations, however it is assumed in this work that the oxygen bubbles formed in the anode are fully humidified. Many of the assumptions made in reference
55
also apply in this work, namely: liquid transport is dominated by surface tension forces, there exists a representative elementary volume in each layer that contains homogeneous hydrophilic and hydrophobic pore networks, gas and liquid water are incompressible and the membrane is impermeable to water and gas. Note that because of the membranes impermeability, liquid water cannot exist on the cathode side. It is assumed that the cathode electrode does not contribute significantly to the cell performance and so two-phase flow is not studied there. The permeability of the liquid, kl
, and gas phase, kg
, is computed using the PSD model as is discussed below. The viscosity, μg
, and density, ρg
, of the gas phase are computed assuming a mixture of oxygen that is fully saturated with water vapor.
. ki
is the permeability, μi
is viscosity and ρi
is the density of phase i, which is either water or oxygen. Note that Zhou et al.
55
considered the evaporation and condensation of water as additional source terms for the liquid and gas pressure equations, however it is assumed in this work that the oxygen bubbles formed in the anode are fully humidified. Many of the assumptions made in reference
55
also apply in this work, namely: liquid transport is dominated by surface tension forces, there exists a representative elementary volume in each layer that contains homogeneous hydrophilic and hydrophobic pore networks, gas and liquid water are incompressible and the membrane is impermeable to water and gas. Note that because of the membranes impermeability, liquid water cannot exist on the cathode side. It is assumed that the cathode electrode does not contribute significantly to the cell performance and so two-phase flow is not studied there. The permeability of the liquid, kl
, and gas phase, kg
, is computed using the PSD model as is discussed below. The viscosity, μg
, and density, ρg
, of the gas phase are computed assuming a mixture of oxygen that is fully saturated with water vapor.
Table I. Source terms for the governing equations.
| Source term | Anode | Cathode |
|---|---|---|

| jOER | −jHER |

| −jOER | jHER |
| Sgas |

|

|
| Sliquid |

| — |
Kinetic models
The kinetics of the OER and hydrogen evolution reaction (HER) are typically described by the Butler-Volmer or Tafel equation in the modelling literature, 61 with the exception of Oliveira et al. 62,63 who developed a multi-scale cell model with multi-step kinetics for the OER. The nature of the OER is not well understood, with numerous mechanisms proposed that have not been experimentally validated. 21 The primary concern for this work is a model that can capture any change in the Tafel slope for the OER, which is occasionally seen experimentally. 23,24 Ma et al. 24 proposed a simplified reaction mechanism using the same methodology proposed by Wang et al. 64 for the ORR. The model assumes a single intermediate species with two intermediate reactions, and was used by the authors to capture the kinetics of the OER on Ir/Ru oxide core-shell catalysts. This model is used in this work to capture the reaction kinetics as a Tafel model was not able to provide an accurate fit to the experimentally obtained polarization curves as is discussed below. The model assumes the following intermediate steps:


from which the current density can be computed using:

where the active area is given by Av and the reference prefactor, j*, is used to scale the reaction. In practice, it was found that this model was also not able to capture the kinetics of the OER for the TKK catalyst, as very low Tafel slopes were required, necessitating the use of transfer coefficients greater than one and therefore forward and backward transfer coefficients that are decoupled (i.e. the backward is not one minus the forward). Then, the coverage of the assumed intermediate species, θO , is given as:

and the gi terms are given as:


where  are the activation energies of the assumed intermediate reactions,
  is the adsorption energy of the assumed intermediate species, αi,f
and αi,b
are the forward and backward transfer coefficients of reaction i respectively, and η is the reaction overpotential. It is worth noting that the kinetic model is likely a major oversimplification of the true reaction mechanism, with a number of more complex mechanisms proposed,
21
hence no insights regarding the nature of the OER are considered in this work. Furthermore, the original model assumed αi,f
+ αi,f
= 1, however the use of fractional stoichometric coefficients in Eqs. 5 and 6 implies that the assumed reactions are not single electron transfer reactions. Therefore both forward and backward transfer coefficients are fitted separately which helped to more accurately reproduce the reaction kinetics.
is the adsorption energy of the assumed intermediate species, αi,f
and αi,b
are the forward and backward transfer coefficients of reaction i respectively, and η is the reaction overpotential. It is worth noting that the kinetic model is likely a major oversimplification of the true reaction mechanism, with a number of more complex mechanisms proposed,
21
hence no insights regarding the nature of the OER are considered in this work. Furthermore, the original model assumed αi,f
+ αi,f
= 1, however the use of fractional stoichometric coefficients in Eqs. 5 and 6 implies that the assumed reactions are not single electron transfer reactions. Therefore both forward and backward transfer coefficients are fitted separately which helped to more accurately reproduce the reaction kinetics.
The inclusion of the liquid saturation, sL , in Eq. 7 accounts for blocking of the active area by gas bubbles and is the method used to induce mass transport losses. An alternative method is to use a concentration ratio and compute the concentration of water molecules at the reaction site, which allows for the possibility of water vapor within a gas bubble maintaining the OER at a reduced level. Reducing the active area was chosen to determine the worst case scenario with regard to the mass transport limitations predicted by the model. This method is commonly used in the literature however validation is required to determine the most appropriate method of accounting for mass transport limitations.
The hydrogen evolution reaction in the cathode proceeds on a platinum catalyst, which has been extensively researched in the literature. There are a number of models that can capture the kinetics of the reaction, 65–67 however this work uses the model proposed by Wang et al. 27 for the hydrogen oxidation reaction (HOR) which was applied by Elbert et al. 68 to study both the HOR and HER on Pt/Ru core-shell catalysts. The model is given as:
where the intermediate absorbed hydrogen coverage is denoted θH and the gi terms are exponentials given as:


where  are the activation energies of the intermediate reactions. The values used in this work are not fitted as the losses incurred from the HER are significantly smaller than other losses, such as the OER and ohmic losses. The activation energies reported by Wang et al.
27
from rotating disk electrodes experiments are used in this work.
are the activation energies of the intermediate reactions. The values used in this work are not fitted as the losses incurred from the HER are significantly smaller than other losses, such as the OER and ohmic losses. The activation energies reported by Wang et al.
27
from rotating disk electrodes experiments are used in this work.
Micro-scale structural model of the porous media
The pore size distribution model is used to characterize the porous media present in the catalyst and transport layers. The PSD is used to relate the pressures computed by the Darcy equations to the liquid saturation at each point in the domain, and allows for the permeability of the gas and liquid phases to be computed. The model conceptualises the porous medium as being a bundle-of-capillaries and is described in greater detail in references, 54,55 with an updated formulation provided in reference 60 which is used in this work. The gas and liquid pressure is used to compute the capillary pressure within each pore, which is used to compute the critical radius according to the Young-Laplace equation:

where γ is the surface tension of the water, θ is the contact angle of the porous medium and the capillary pressure, pc , is taken in this work as the difference between the liquid and gas pressures, i.e. pc = pl − pg . The critical radius of a hydrophobic medium will be the smallest pore size that will be invaded by liquid water at a particular pressure, for a hydrophilic medium it will be the largest pore size invaded.
The PSD used in this work is given by

where X(r) is the volume of the liquid invaded pore space, normalised to the total pore volume, i.e. X(r) = Vlw (r)/Vp . X(r) can be described using a log-normal distribution, which is given as:

where  is given by:

The PSD can be comprised of a number of modes, k, each of which has a characteristic radius, ri,k , and standard deviation, si,k , and take up a fraction, fi,k , of the pore volume assigned to phase i. The hydrophobic/hydrophilic portions of the PSD are denoted by subscript i, with each having a fraction, Fi , of the total pore space, i.e., FHO + FHI = 1.
The liquid saturation is computed based on the local capillary pressure, as all the pores larger than the hydrophobic critical radius will be water filled, as will all pores smaller than the hydrophilic critical radius. As such the liquid saturation is computed by integrating over all the pores that have been invaded by water:

The analytical solution to this integral is given as:
where ξHI = 1 and ξHO = − 1. The computed liquid saturation defines the volume of the pore space that is filled with water, i.e.:

while the gas saturation is given by sG = 1 − sL .
The permeability can be computed by comparing the velocity of a fluid passing through a cylindrical pore according to Hagen-Poiseuille equation to that computed by the Darcy equation: 60
where

where Pl−l is the probability of a water-filled pore being in contact with another water-filled pore. The gas permeability can be found in a similar manner:

where Pg−g is the probability of two gas filled pores being in contact. The probabilities are based on determining the water/gas cross-sectional area per unit volume and are given as:
where ac is the water/gas cross-sectional area at a given capillary pressure, amax is the total area for the entire pore volume and λPSD is the pore interconnectivity factor, which is used as a fitting factor.
Boundary conditions
The boundary conditions for the potential of the electronic phase are zero volts at the cathode GDL/land, and is the applied potential at the anode PTL/land, while no flux is applied elsewhere. A no flux boundary condition is applied for the protonic potential at all boundaries. Ohm's law for the protonic potential is not solved in the transport layers so the boundary condition is essentially applied at the CL/transport layer interface. The liquid pressure boundary condition is artificially set to a high negative pressure at the cathode channel to ensure that the liquid saturation is zero. The anode boundary condition is set to atmospheric pressure plus half the pressure drop down the single serpentine channel. The gas pressure is set to atmospheric in the cathode channel, while on the anode the gas pressure is set to that required to generate a bubble half the size of the channel according to the Young-Laplace equation, i.e.:

The boundary conditions used in the anode electrode are greatly simplified, and could be improved to better reflect the two-phase regimes that are present in the anode channel under different operating current densities. The transition between bubbly, slug and annular flow has been well studied in the literature, however the use of the two-phase model in this work is primary concerned with the impact of the liquid saturation in the ACL and how the differing catalyst conductivities impact the two-phase flow within the ACL and the subsequent impact on the cell performance. A study was performed on the boundary condition used for the gas pressure in the anode, and while the liquid saturation in the PTL reduced significantly with increasing gas pressure at the boundary, the liquid saturation in the ACL was hardly affected. This is because of the weak coupling of two-phase effects between the PTL and ACL as is shown below.
Post-processing
The model can be used to compute the ohmic resistance of the cell, allowing for comparison with experimentally obtained resistances, such as the HFR. Using the ohmic heating method, 69 the resistance to charge transport through a finite element can be computed using:


where i is the current density of the cell and A is the geometric area of the cell.
Implementation
The model described was implemented in OpenFCST, an in-house, open-source software developed to model electrochemical systems. 70 Second order Lagrange finite elements are used, with approximately 3000 cells, for a total of approximately 50,000 degrees of freedom. The governing equations are linearised using Newton's method, the resulting linear system is solved using UMFPACK. A tolerance of 10−8 was used for the residual of the Newton solver. A polarization curve up to a cell potential of 2 V took approximately ten minutes to obtain, using an Intel®CoreTMi7-8700K CPU at 3.7 GHz.
Model Parameters
Tables II to VI contain the parameters used in this work with further discussion provided for the parameters fitted to the experimental data used. Where possible, parameters were measured for this work, or were obtained from previous works from the authors group 28,30,58,71–73 who used the same or similar materials. The transport parameters for the cathode GDL and MPL are the same as those presented by Kosakian et al., 60,71 though this work used an SGL 28BC and an SGL 24BC, as opposed to the SGL 29BC used by Kosakian et al. The impact of the cathode is minimal on the performance of the cell and the difference between the two GDLs is unlikely to impact the results of this study. Similarly, the transport parameters for the CCL are the same as Kosakian et al., despite a slightly different catalyst being used (40 wt% Pt/C HySa-K40 vs 46.7 wt% Pt/C TEC10EA50E TKK).
Table II. Layer thickness.
| Layer | Thickness [μm] | References |
|---|---|---|
| PTL | 280 | This work |
| ACL | 4.48 (Ir), 4.4 (IrOx) | Ref. 58 |
| Membrane | 25.4 | Manufacturer |
| CCL | 2.8 | Ref. 71 |
| MPL | 37 | Ref. 71 |
| GDL | 109 | Ref. 71 |
| Channel height | 800 | This work |
| Land height | 800 | This work |
Table III. PSD parameters for Ti sinter PTL.
| Parameter | References | |
|---|---|---|
| rk [μm] | 13.4, 10 | This work |
| fk [—] | 0.562, 0.438 | This work |
| sk [—] | 0.937, 0.318 | This work |
| FHI [—] | 1 | This work |
| θHI [—] | 56 | Ref. 74 |
| λPSD [—] | 0.1 | This work |
Table IV. PSD parameters for the ACL.
| Small | Medium | Large | |
|---|---|---|---|
| Parameter | Kosakian 71 | Hegge et al. 75 | Wrubel et al. 50 |
| HI VF [—] | 0.9 | 0.9 | 0.8 |
| θHI [—] | 80 | 80 | 80 |
| rk HI [nm] | 8.79, 22.2, 38.4 | 300, 900 | 800, 1650, 450, 6000 |
| fk HI [—] | 0.09, 0.34, 0.57 | 0.75, 0.25 | 0.594, 0.281, 0.0625, 0.0625 |
| sk HI [—] | 0.725, 0.446, 0.348 | 0.5, 0.4 | 0.225, 0.4, 0.2, 0.6 |
| HO VF [—] | 0.1 | 0.1 | 0.2 |
| θHO [—] | 107 | 107 | 107 |
| rk HO [nm] | 8.79 | 300, 900 | 600 |
| fk HO [—] | 1 | 0.75, 0.25 | 1 |
| sk HO [—] | 0.725 | 0.5, 0.4 | 0.9 |
| λPSD | 4.1 | 0.75 | 0.75 |
Table V. Kinetic and transport parameters for the ACLs.
| Parameters | Ir CL | IrOx CL | References |
|---|---|---|---|
 [eV] [eV] | 0.714 | 1.004 | This work |
 [eV] [eV] | 1.123 | 1.479 | This work |
| α1,f [—] | 0.589 | 1.174 | This work |
| α1,b [—] | 0.669 | 0.462 | This work |
| α2,f [—] | 0.813 | 1.362 | This work |
| α2,b [—] | 0.033 | 1.468 | This work |
 [eV] [eV] | 2.881 | 1.855 | This work |
j* [A/cm![${}_{{Ir}}^{2}]$](https://content.cld.iop.org/journals/1945-7111/170/4/044503/revision2/jesacc898ieqn15.gif)
| 2.42 × 10⁵ | 9.42 × 10⁷ | This work |
Av
[cm /cm /cm![${}_{{geo}}^{3}]$](https://content.cld.iop.org/journals/1945-7111/170/4/044503/revision2/jesacc898ieqn17.gif)
| 511 011 | 618 750 | This work |
| σs [S cm−1] | 2.9 × 10⁻² | 3.59 × 10⁻⁵ | Ref. 30 |
| σm [S cm−1] | 5.03 × 10⁻³ | 2.6 × 10⁻² | Ref. 30 |
| ε [—] | 0.545 | 0.215 | Ref. 58 |
Table VI. Kinetic and transport parameters for the CCL, PTL and membrane.
| Operating conditions | |
|---|---|
| Cell temperature, [°C] | 80 |
| Cell pressure, [Pa] | 101 325 |
| HER Kinetic parameters | References | |
|---|---|---|
 [eV] [eV] | 0.195 | Ref. 27 |
 [eV] [eV] | 0.294 | Ref. 27 |
 [eV] [eV] | 0.75 | Ref. 27 |
j* [A/cm![${}_{{Pt}}^{2}]$](https://content.cld.iop.org/journals/1945-7111/170/4/044503/revision2/jesacc898ieqn21.gif)
| 1000 | Ref. 27 |
| Membrane | Refrence | |
|---|---|---|
| σm [S cm−1] | 0.2 | This work |
| Ti sinter | Refrence | |
|---|---|---|
| σs [S cm−1] | 1802 | This work |
PSD parameters
The PSD for the titanium sinter was fitted to mercury intrusion porosimetry data obtained in house, and its pore connectivity factor was adjusted to fit the permeability value reported by Jung et al. 72 The resulting relative gas and liquid permeabilities are shown in Fig. S2 in the Supporting Information (SI). The contact angle for the PTL was reported by Bromberger et al. 74 as 56°. This value was not fitted as two phase transport in the PTL was not found to influence gas saturation in the ACL and therefore did not affect the cell performance, as discussed in the results section.
Obtaining the PSD of the Ir and IrOx ACLs used in this work would require performing mercury intrusion porosimetry (MIP) or focused ion beam scanning electron microscopy (FIBSEM) on the layers. The former is very challenging given the small thickness of the electrode, while the latter is expensive and time consuming. As the PSD was not fitted to experimental data presented in this work, the model is used to assess the impact of different PSD parameters on predicted performance of the cell. Several PSDs were used, representing extreme cases discussed in the literature. Three PSDs were available: a PSD with small pores used by Kosakian, 60 a PSD from Hegge et al. 75 with medium pores sizes, and a PSD from Wrubel et al. 50 which had large pores. The base case uses the small PSD, while the other two PSDs are studied to provide a contrast. Each PSD will be applied in turn to both the Ir and IrOx based ACLs studied in this work, in order to understand the interplay between the reaction distribution and the ACL microstructure. The PSD from Hegge et al. 75 was obtained by performing FIBSEM on an IrRuOx layer from a commercial CCM, with pore sizes on the order of a few hundreds of nanometres, as shown in Fig. 2a. Wrubel et al. 50 used a similar numerical model to this work to study PTLs that had been chemically etched to obtained tunable features and used an intrusion curve based on a Pt/C layer. This intrusion curve was used in this work as the starting point to generate PSD under the assumption of an 80° contact angle, resulting in a PSD with a majority of pores close to a micron in size. The resulting PSD did not generate an intrusion curve that perfectly matched that from Wrubel et al., as their curve did not show zero liquid saturation. However, the resulting PSD was used as it was sufficiently different from the other two used in this work and allowed for the impact of having very large pore radii to be studied. It should be noted that a portion of this PSD has a characteristic pore radius of 6 μm, which is larger than the thickness of the layer. These pores are included as they are necessary to capture the intrusion curve used by Wrubel et al. despite perhaps being non-physical, though they could be considered to represent cracks through the ACL. The PSDs from Hegge et al. and Wrubel et al. have characteristic pore radii that do not appear to be present in surface SEM images of the catalyst layers used in this work; examples of these images can be seen in reference. 58 As such, a PSD used by Kosakian 60 based on FIBSEM analysis of a Pt/C CCL used in PEM fuel cells 73 is also studied, as its characteristic pore radius is of the order of tens of nanometres.

Figure 2. (Left) Comparison of the PSDs from Kosakian (small), Hegge et al. (medium) and Wrubel et al. (large), along with the Ti sinter PTL. The smaller curves with markers are the assumed hydrophobic portions of the PSDs, while those without markers are the hydrophilic. (Right) Intrusion curves for the same PSDs. Note the use of negative capillary pressure on the x-axis, positive pressures are not shown as they are not achieved in these simulations.
Download figure:
Standard image High-resolution imageThere is considerable uncertainty regarding the remaining parameters used in the PSD model, namely the contact angle of the hydrophilic and hydrophobic portions of the ACL, the fraction of the PSD that is hydrophilic, and the pores connectivity, i.e. the parameter λPSD in Eq. 28, which determines the permeability of the layer. As such, these parameters will be part of a parametric study to determine their impact on performance. As a base case, it is assumed that the hydrophobicity of the ACL is caused by the ionomer, in particular its PTFE backbone. A value of 107° is used based on contact angle measurements on PTFE films. 76 Note that the assumption that the hydrophobicity of the ACL is caused by the PTFE backbone is not meant to imply the ionomer is overall hydrophobic, as Nafion thin films are thought to be hydrophilic in the presence of liquid water. 77 In this work, only a small fraction of the ACL is assumed to be hydrophobic, with a contact angle that is chosen on the basis that the PTFE backbone is likely the only part of the ACL that is hydrophobic. The hydrophilic contact is assumed to be 80° for the base case as was used by Wu et al. 49 in their numerical simulations. Wang et al. 42 measured a contact angle of 22°–53° depending on whether the ACL was conditioned or not, while contact angle measurements on iridium oxide films used in bioelectrodes suggest a contact angle closer to 10°. 78,79 The values of the pore interconnectivity factor, λPSD , for the small and medium PSD is adjusted in order to obtain reasonable permeability values. Hegge et al. reported permeabilities of the order of 4 × 10⁻¹⁵ m2, leading to a pore interconnectivity factor of 0.75 for the medium PSD. For the small PSD, the value of 4.1 reported by Kosakian 60 is used. The hydrophilic portion for these two PSDs is assumed to be 90% on the basis of the parametric study that follows. Kosakian assumed that only the smallest pores were hydrophobic, hence the use of only one mode for the hydrophobic portion. It is unknown which pores are hydrophobic in the PSD from Hegge et al., so each mode was included in the hydrophobic portion. For the large PSD, the intrusion curve used by Wrubel et al. implied both a hydrophilic and hydrophobic portion, as the curve showed part of the layer is invaded for both negative and positive capillary pressures, leading to a hydrophilic fraction of 80%. Wrubel et al. did not report permeability values so the interconnectivity factor for their PSD was assumed to be the same as that used for Hegge et al. The pore interconnectivity was found to have no impact on the two phase behavior for this PSD. The assumption of a contact angle of 80° was made on the basis that smaller contact angles require larger pores in order to reproduce the intrusion curve used by Wrubel et al. For example, a contact angle of 40° results in an even large PSD, with the majority of pores having a characteristic pore radius of 3.7 microns. The relative gas and liquid permeabilities for each PSD using the parameters described are shown in Fig. S3 in the SI.
Layer conductivities
The membrane ionic conductivity is adjusted to match the membrane resistance reported by Mandal et al. 30 for a liquid equilibrated N-211. Mandal et al. also reported the resistance of the cell hardware to be 19.7 mΩ.cm2, which included the cathode GDL, which is modelled in this work, as well as two current collectors and bipolar plates, which are not included in the model. The GDL electronic conductivity was taken from Kosakian et al., 71 which results in a resistance of approximately 7.5 mΩ.cm2 being computed using the ohmic heating method, see Eq. 30. The remaining 12.2 mΩ.cm2 from the cell hardware is attributed to components not included in these simulations, so the experimental data was corrected to account for this resistance. This resistance was also removed from the experimentally obtained HFR. The PTL conductivity was adjusted to match the resistance reported by Mandal et al., 30 who used a four point probe method to obtain the in-plane conductivity, which was assumed to match the through-plane conductivity due to isotropic nature of a sintered titanium PTL. The electronic and protonic conductivities of the cathode catalyst layer were again obtained from Kosakian et al. 71 These layers were not found to contribute significantly to the resistance of the cell.
The conductivities of the solid, σs , and ionomer, σm , phases in the ACL are dependent on whether an Ir or IrOx catalyst is used. The IrOx ACL electronic and protonic conductivities were based on the values reported by Mandal et al., 30 using the data at a relative humidity (RH) of 100%. The Ir ACL conductivities were measured using the same methodology for this work. It should be noted that the hydrogen pump method used to measure the protonic conductivity of the Ir ACL may overpredict the layer conductivity. The Ir catalyst is active to the hydrogen reaction, which may result in the charge being transported through the electronic phase. 30,80 However if this is the case, the trends described in this work will still be valid, as the electronic conductivity will still be higher than the protonic. As such the reaction distribution in the Ir layer will not be changed. The effective protonic conductivity at 100% RH, with an ionomer loading of 5%, was measured as 5.03 × 10⁻³ S cm−1, while the effective electronic conductivity was 0.048 S cm−1. These values, and those reported in reference 30 for the IrOx, might not be representative of the ACL conductivities in the presence of liquid water, therefore they were slightly adjusted so that the HFR computed numerically would match that obtained experimentally (including the adjustment from the cell hardware resistance). The HFR from the numerical model is obtained by summing the electronic and protonic resistances of each layer computed from ohmic heating, besides the CCL and ACL. The contribution of an individual CL to the HFR, at low current densities, can be estimated as: 28,29

where L is the thickness of the layer, and σeff is either the effective electronic or protonic conductivity of the CL. Equation (32) shows that the computed resistance will be dominated by the more conductive phase, which was assumed to be the protonic phase for the IrOx ACL, and the electronic for the Ir ACL, based on the conductivity measurements from Mandal et al., 30 therefore only the conductivity of the more dominant phase was adjusted to match the HFR. For the Ir ACL, the electronic conductivity was adjusted from the measured value of 0.048 S cm−1 to 0.029 S cm−1. It can be expected that the electronic conductivity of the ACL will be lower when liquid equilibrated compared to at 100% RH, as the swelling of the ionomer may cause loss of connectivity between catalyst particles. 81 The IrOx protonic conductivity was increased from a measured value of 0.011 S cm−1 to 0.026 S cm−1, which again is reasonable given that the ionomer will likely be more conductive when in contact with liquid water. Ideally the conductivities of these layers should be measured in a liquid equilibrated state to remove the uncertainty noted here.
Kinetic parameters
The kinetic parameters were obtained by fitting to the experimental data at low current densities. Typically, the Tafel equation is used to describe the reaction kinetics of the OER and is obtained by fitting a straight line on a Tafel plot of the kinetic region of the experimentally obtained polarization curve, that has been corrected to account for the HFR. Using this method failed to provide a reasonable fit for either catalyst, as did fitting the kinetic model from Ma et al.
24
instead of the Tafel equation, up to a current density of 0.5 A cm−2. In order to obtain kinetic parameters that would result in a close fit to the experimental polarization curve, it was necessary to account for the resistance of the ACL while fitting the kinetic model. To do this, 2-D simulations were run with the ACL only, in which the kinetic parameters were fit to experimental polarization data that had the resistance of every other layer removed. The other layers were removed to minimize the computational requirements for the fitting procedure, which used a pattern search algorithm implemented in Dakota.
82
The fitting parameters were the free energies of activation,  , free energy of adsorption
  , and the forward and backward transfer cofficients for each intermediate step, αi,f
and αi,b
. The current densities fitted ranged from 3-500 mA cm−2, smaller current density ranges did not produce as good a fit, which may be because the change in Tafel slope occurs at a high potential, circa 1.4-1.5 V, as is shown in Fig. S1 the SI. The resulting kinetic parameters are shown in Table V, and were used to obtain the numerical polarization curve shown in Fig. 3a. While the OER is a multi-step reaction which could exhibit a changing Tafel slope, and there is some experimental evidence for the change in Tafel slope in OER reaction kinetics,
23,24
it is possible that the use of the kinetic model from Ma et al. is actually capturing a different effect such as the interfacial resistance between the ACL and PTL. The extremely close fit between the numerical and experimental data suggests that the additional voltage loss at least mimics a change in Tafel slope. The fact that the ACL resistance needed to be accounted for when fitting the kinetic parameters raises a number of questions about how kinetic parameters should be determined in PEMWE, and what constitutes the kinetic region. Finally, it should be noted that mass transport effects were not accounted for during the fitting of kinetic parameters, as relatively low current densities were used.
, and the forward and backward transfer cofficients for each intermediate step, αi,f
and αi,b
. The current densities fitted ranged from 3-500 mA cm−2, smaller current density ranges did not produce as good a fit, which may be because the change in Tafel slope occurs at a high potential, circa 1.4-1.5 V, as is shown in Fig. S1 the SI. The resulting kinetic parameters are shown in Table V, and were used to obtain the numerical polarization curve shown in Fig. 3a. While the OER is a multi-step reaction which could exhibit a changing Tafel slope, and there is some experimental evidence for the change in Tafel slope in OER reaction kinetics,
23,24
it is possible that the use of the kinetic model from Ma et al. is actually capturing a different effect such as the interfacial resistance between the ACL and PTL. The extremely close fit between the numerical and experimental data suggests that the additional voltage loss at least mimics a change in Tafel slope. The fact that the ACL resistance needed to be accounted for when fitting the kinetic parameters raises a number of questions about how kinetic parameters should be determined in PEMWE, and what constitutes the kinetic region. Finally, it should be noted that mass transport effects were not accounted for during the fitting of kinetic parameters, as relatively low current densities were used.
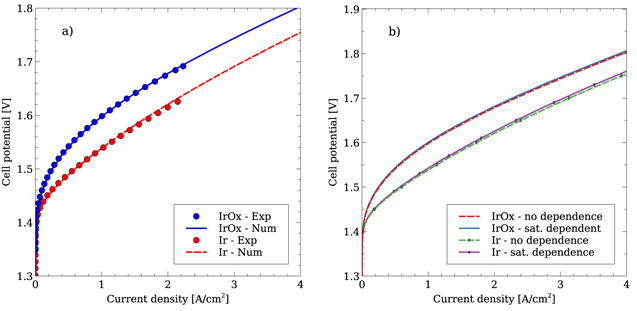
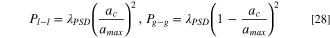
Figure 3. Comparison between experimentally and numerically obtained polarization curves with an Ir and IrOx ACL (left), and the impact of including a liquid saturation dependent active area (right) with the small PSD.
Download figure:
Standard image High-resolution imageResults and Discussion
Base case analysis
Figure 3a shows the fit of the numerical model to the experimental data for both the Ir and IrOx catalysts. A very close match is obtained, with the parameters indicated in Tables II to VI. The reason for studying the two catalysts noted in this work is the difference in the effective conductivities of the two phases in the ACL. The Ir based ACL has an electronic conductivity that is almost ten times that of the protonic phase, whereas the electronic conductivity of the IrOx based ACL is three orders of magnitude lower than the protonic. An interesting consequence of the fact that the electronic conductivity is higher for one catalyst and lower for the other is that the OER will tend to occur at opposite sides of the ACL, as shown in Fig. 4. Overall, the numerical model is capable of reproducing the performance for both catalysts despite the very different behavior exhibited between them.

Figure 4. OER distribution for an Ir ACL (left) and an IrOx ACL (right) at 100 mA cm−2. Note the use of a log scale for the IrOx ACL and that both images are stretched by 50 times in the x direction.
Download figure:
Standard image High-resolution imageThe reaction distribution at 100 mA cm−2 for the IrOx catalyst in Fig. 4 is extremely localised to one side, requiring a log scale to allow the distribution to be seen. A video of how the reaction distribution changes throughout the polarization curve without the log scale is available in the SI. Therefore, any oxygen bubbles created in the IrOx ACL will be produced close the PTL and will have an easy escape from the ACL. Figure 5 shows the gas, liquid and capillary pressures in the IrOx ACL at 4 A cm−2, along with the liquid saturation. The gas pressure does not show a significant increase, particularly in comparison to the Ir ACL which is discussed later. The liquid pressure hardly changes at all. This suggests that the water consumed by the OER is rapidly replenished by the PTL. This was found to be the case even if the average PTL liquid saturation dropped to 5%. Using Faraday's law, the flux of liquid water required to maintain a current density of 4 A cm−2 is of the order of 1 × 10⁻⁴ ml/(cm2.sec), which the model suggests can be easily transported by the PTL since the liquid saturation in the ACL is quite uniform even at high current densities. Zhao et al. 17 showed that water can be transported rapidly through micro-scale cracks and at the interfaces between Ti particles of very hydrophilic PTLs, which may explain the PTLs ability to transport water even at very high gas saturations. As such the liquid saturation in the ACL does not change with increasing current density and there is little impact on the predicted polarization curves from mass transport losses, as shown in Fig. 3b.
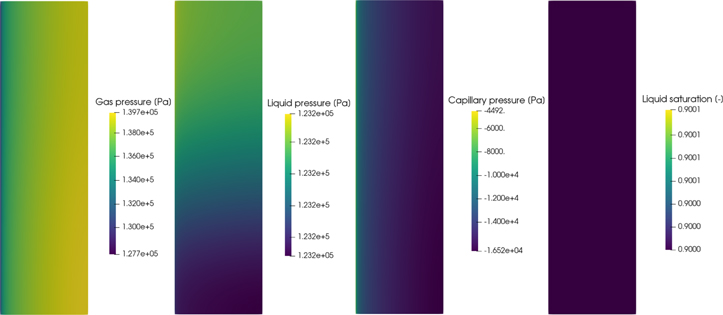
Figure 5. Gas, liquid and capillary pressure profiles, as well as the liquid saturation in the IrOx ACL at 4 A cm−2. Note that the PEM is to the right of the ACL in these images.
Download figure:
Standard image High-resolution imageFor the Ir catalyst, the bubbles will be produced close to the PEM, which will become more localised as the current density increases, requiring bubbles to traverse most of the ACL in order to escape to the PTL. That the gas bubbles must take a tortuous path to escape the Ir based ACL is highlighted in Fig. 6, which shows the gas, liquid and capillary pressures in the ACL at 4 A cm−2, along with the liquid saturation. Very high gas pressures are generated at the ACL/PEM interface because of the small, hydrophilic pores that comprise the small PSD. It is unlikely that the ACL can withstand such high pressures and the ACL would likely be damaged by gas trying to escape the layer. Despite the high gas pressures in the ACL, the resulting ACL liquid saturation is not changed significantly. The pores are of the order of tens of nanometres which theoretically would require extremely high pressures to displace the water, despite the relatively high contact angle of 80°. Figure 2b shows the intrusion curves for each of the PSDs examined in this work. The small PSD requires capillary pressures of the order of 7 bar to achieve a liquid saturation of 0.5, which is likely not feasible. The liquid pressure is not significantly changed, as the hydrophilic nature of the ACL allows for water to be quickly replenished at the OER sites. As such, there is very little change in the cell performance when the liquid saturation dependent active area is used, as shown in Fig. 3b. It would appear, therefore, to be very difficult to induce significant mass transport limitations with the small PSD and the catalysts used in this work, which is also true for the other PSDs, as will be discussed later. At this point it is worth noting that the homogeneous nature of the model used in this work fails to capture the impact of discrete blockages. For example, it would not capture a large gas bubble being trapped at a particular location, e.g. in the PTL at the ACL/PTL interface, and blanking a large section of the ACL. That the pressures, and therefore liquid saturation, and ACL properties are averaged throughout the domain means that there is always a hydrophobic fraction of pores that can move gas bubbles out of the ACL. This study would therefore suggest that research into mass transport limitations should be concerned with determining the conditions under which these discrete blockages can occur. For example, if performing neutron or X-ray imaging of the gas buildup in a PTL during operation, the focus should be on reporting the size and frequency of gas bubbles close to the PTL/ACL interface, rather than the average gas saturation across the entire PTL.

Figure 6. Gas, liquid and capillary pressure profiles, as well as the liquid saturation in the Ir ACL at 4 A cm−2. Note that the PEM is to the right of the ACL in these images.
Download figure:
Standard image High-resolution imageThere is some evidence for the very high gas pressures in the Ir based ACL in the literature. Mandal et al. 58 obtained polarization curves up to 4 A cm−2 for both the Ir and IrOx catalysts used in this work, with a very similar cell construction. Post operation SEM imaging revealed the presence of a large number of small cracks throughout the surface of the Ir ACL that were not present prior to operation. The cracks had a volcanic appearance and may have been caused by the gas bubbles building significant pressure deep within the ACL before rupturing the layer to release this pressure. These volcano-like cracks did not appear on the IrOx based ACL, indicating that a pressure buildup did not occur during operation, as predicted by the numerical model in this work. It should be noted that the Ir based ACL used a Ti felt PTL on the anode, while the IrOx ACL used a sinter. Furthermore, Mandal et al. 58 studied the impact of adding carbon particles, as a pore former, to the ACL ink before fabrication, with the intent of corroding these particles during operation, thereby altering the porosity and PSD of the layer. With the addition of the pore former to the Ir ACL, the volcano-like cracks did not appear after operation, indicating that the change in porosity and PSD induced by the pore former prevented the gas pressure from building up. The fact that the ACL could be ruptured by the gas pressure buildup suggests that an ACL with a small PSD will have its microstructure altered during operation, resulting in an increase in the mean pore size and permeability of the layer. As such, it may not longer be possible to build high enough gas pressures to displace the water from the pores, as shown will be shown in the case of the larger PSDs discussed below.
Other possible evidence for the build up of gas pressure in the ACL is from Trinke et al. 83 who studied gas permeation through the membrane during PEMWE operation, using an Ir black catalyst in the ACL that likely has similar effective conductivities to the Umicore Ir black catalyst studied in this work. The authors noted that the rate of oxygen permeation through the PEM to the cathode increases with increasing current density. The authors attributed this increased flux to an oxygen supersaturation in the ACL; this supersaturation may have been caused by an increased oxygen pressure generated at the PEM/ACL interface, due to the nature of the OER distribution with an Ir black catalyst. Figure 7 shows that the maximum gas pressure generated in the ACL is dependent on the current density for the Ir catalyst, whereas the pressure changes very little for the IrOx catalyst. As such, it is possible that Trinke et al. would not have made their observation had they used a different catalyst.

Figure 7. Comparison between between the averaged liquid saturation in the ACL and the maximum gas pressure reached in the ACL with an Ir and IrOx catalyst with the small PSD.
Download figure:
Standard image High-resolution imageImpact of PTL
The PTL used in this work is a Ti sinter, with its PSD and intrusion curve shown in Fig. 2. Figure 8a shows the average gas saturation in the in-plane direction in front of the channel, and is plotted at a number of points in the through plane direction. An explanatory figure is provided in Fig. S4 in the SI that shows the locations of this averaging. There is a build up of gas within the PTL with increasing current density, in agreement with observations by De Angelis et al. 5 using X-ray tomography. It should be noted that Seweryn et al. 34 and Zlobinski et al. 35 reported that the PTL gas saturation was independent of the current density. De Angelis et al. suggested that the higher resolution of their equipment was needed to reveal the dependence. The rapid increase in the gas saturation moving from the channel into the PTL was not observed by De Angelis et al., and may be an artifact of the Dirichlet boundary conditions used at the channel for the gas pressure. Of particular interest, however, is that at the ACL/PTL interface, there is a significant jump in gas saturation, which was also noted by Garcia-Salaberri. 48 This is not unexpected, as the gas and liquid pressures must be continuous. Therefore, there must be a jump in saturation between the two layers due to the significant differences between their PSDs and their intrusion curves. These differences may be indirectly observed in the works by Wang et al., 41,43 who showed that bubbles emerging from the PTL tend to be larger and tends to occur more slowly than those emerging directly from the ACL. The smaller bubbles are likely a result of the smaller pores in the ACL, with the higher frequency of emergence from the ACL being impacted by the higher hydrophilicity. This result means that experimental observations of the gas saturation in the PTL may not be representative of the gas saturation in the ACL, and in fact the PTL gas saturation could be significantly higher than the ACL. As such, the importance of mass transport limitations may be overpredicted based on these experimental observations. It is also interesting to note that ACL gas saturation appears to be independent of the PTL gas saturation, as the ACL gas saturation is very similar at each current density, while the PTL gas saturation varies significantly. This is a result of the much smaller PSD in the ACL and would indicate that determining ACL PSD properties is vital for understanding the impact of mass transport limitations in PEMWE.

Figure 8. Profile of gas saturation in the PTL and ACL at different current densities, for the small (left) and large (right) PSDs.
Download figure:
Standard image High-resolution imageAgain it should be pointed out that the homogeneous nature of the model means that if the model predicts a gas saturation of 30% at the PTL/ACL interface at 4 A cm−2, that also means that there is 70% liquid saturation at the same location which will provide enough water for the ACL to wick into the layer. It is more likely that the gas bubbles that comprise that 30% gas saturation are concentrated into a single capillary finger, in which a significant portion of the ACL is blanked from receiving water, an effect not captured by volume-averaged models such as the one presented. This process would likely induce more significant mass transport losses and would depend on the morphology of the PTL to determine the size of the area blanked by the gas, and on whether the liquid permeability of the ACL is high enough to allow water to be drawn to the blanketed area from other portions of the ACL in the in-plane direction. However, the ability of the ACL to transport water in the in-plane direction is likely determined by the PSD, hence further study on the structure of these layers is required. This idea implies that greater insights into these losses may be obtained from experimental imaging works that report localised gas saturations close to the PTL rather than averaged across the layer, e.g. using tomography. 5
Impact of the ACL pore size distribution
The use of the PSD model allows for the ACL microstructure to be parametrised and its impact on performance to be assessed, which was achieved by studying the medium and large PSDs shown in Fig. 2a. These PSDs have significantly larger pore sizes than the small PSD, though it should be noted that there are also differences in the hydrophilic volume fraction and the pore interconnectivity factor. The impact of the liquid saturation dependent active area using the medium and large PSD is given in Fig. 9. The IrOx catalyst shows a very minor change in performance, though it is larger for the largest PSD. This is due to the hydrophilic volume fraction, which is 0.9 for the small and medium PSD, and 0.8 for the largest PSD. The Ir catalyst also shows very minor changes for the medium PSD, however a noticeable difference is seen for the large PSD, indicating that the model used in this work is capable of inducing mass transport losses for certain PSDs. Interestingly, mass transport effects can be observed throughout the polarization curve, rather than at high current densities only. The importance of the hydrophilic fraction can be shown by considering the intrusion curves. The maximum capillary pressures at 4 A cm−2 induced by the Ir based ACLs are 280 kPa, 12 kPa and 1.3 kPa for the small, medium and large PSDs respectively, as seen for example in Fig. 6 for the case of the small PSD. Each of these capillary pressures are close to the "knee" for their respective intrusion curves, as shown in Fig. 2b. As such, the impact of the saturation based kinetics is controlled by the hydrophilic portion of the PSD and does not vary with current density.
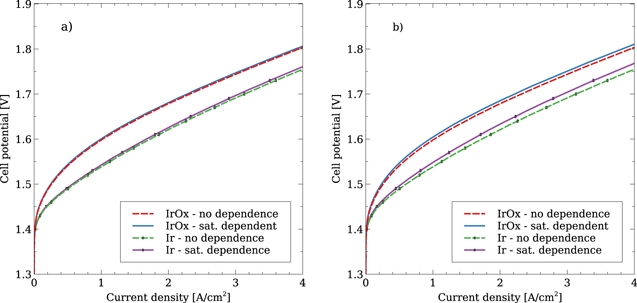
Figure 9. Impact of accounting for a liquid saturation dependent active area for the medium (left) and large (right) PSDs.
Download figure:
Standard image High-resolution imageFigure 10 shows the average ACL liquid saturation and maximum gas pressures observed for both PSDs and catalysts. The medium PSD shows significantly lower pressures are induced in the ACL for the Ir, as compared to the small PSD in Fig. 7, because the larger PSDs are more permeable to gas. The liquid saturation for the IrOx catalyst remains at 0.9, while the Ir only has a small deviation at higher current densities. In general, the medium PSD results in liquid saturation and pressures profiles that are more similar to each other as compared to the small PSD when changing catalysts. This effect is clearly demonstrated for the large PSD, where pressure and liquid saturation profiles are identical for both catalysts, indicating that the mass transport behavior of the layer is no longer dictated by the reaction distribution. The very large pores present in the large PSD, as well as the reduced hydrophilic content, greatly improve the transport of gas out of the layer, alleviating the large gas pressures predicted with the small PSD. It is interesting to note that the volcano-like cracks observed by Mandal et al. 58 in Ir based ACLs post operation are of the order of a few microns across, in a layer that appears to have very small pores. The volcano-like cracks, once formed, are of a similar size to the 6 μm pores present in the large PSD, and so likely significantly improve the permeability of the ACL, as implied by the results obtained for the large PSD. In addition, the large PSD shows a slightly stronger coupling between the PTL and the ACL. This is shown in Fig. 8b, where the gas saturation in the ACL for the large PSD shows some variation with current density and therefore PTL gas saturation. That the PTL exerts a greater influence can be expected, as the intrusion curves for the the large PSD is the closest to that of the Ti sinter compared to the other two PSDs, as shown in Fig. 2b.
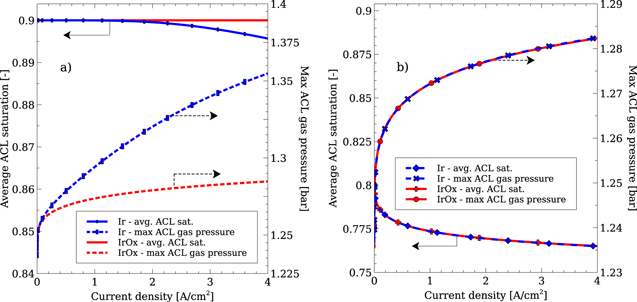
Figure 10. Dependence of the average ACL liquid saturation, and the maximum gas pressure in the ACL, for the medium (left) and large (right) PSDs, and for both catalysts.
Download figure:
Standard image High-resolution imageIt is interesting to note that despite the ACL liquid saturation in the largest PSD being identical for both catalysts, the Ir ACL sees a larger drop in performance in Fig. 9b compared to the IrOx when mass transport effects are accounted for. At 4 A cm−2, the Ir ACL has a mass transport induced voltage loss of 13.4 mV, compared to 6.9 mV for the IrOx. This discrepancy can be explained by examining the kinetics of the OER, and is demonstrated using the Tafel equation for simplicity. A multi-step model was used in this work, however the model will behave as a Tafel model at potentials that are sufficiently higher than the potential at which the change in Tafel slope occurs (approximately 1.4-1.5 V for parameters used in this work). The Tafel equation, including the liquid saturation dependent active area, is given as:

where b is the Tafel slope in Volts per decade, which can be extracted from Fig. S1 in the SI, and i0 is the exchange current density. The equation can be rearranged to obtain the overpotential, η:

The voltage loss induced by a reduction in the liquid saturation can be obtained by subtracting the overpotential obtained at a liquid saturation of one (i.e., no mass transport losses), from the overpotential obtained with a lower liquid saturation. The result is given as:

Using the equation above, the voltage loss from mass transport can be computed for each catalyst. At 4 A cm−2, both catalysts had an average liquid saturation of approximately 0.765. At high cell potentials, the Ir catalyst has a Tafel slope of 118.2 mV dec−1, giving a voltage loss of 13.74 mV, while the IrOx layer has a Tafel slope of 59.25 mV dec−1, giving a voltage loss of 6.89 mV. These values match very closely with those obtained from the difference in the polarization curve. This result highlights the importance of understanding the activity of the catalyst when studying mass transport losses. It should be noted however, that the analytical method described will not be as accurate if the liquid saturation distribution depends strongly on the reaction distribution, or there is a significant variation throughout the ACL.
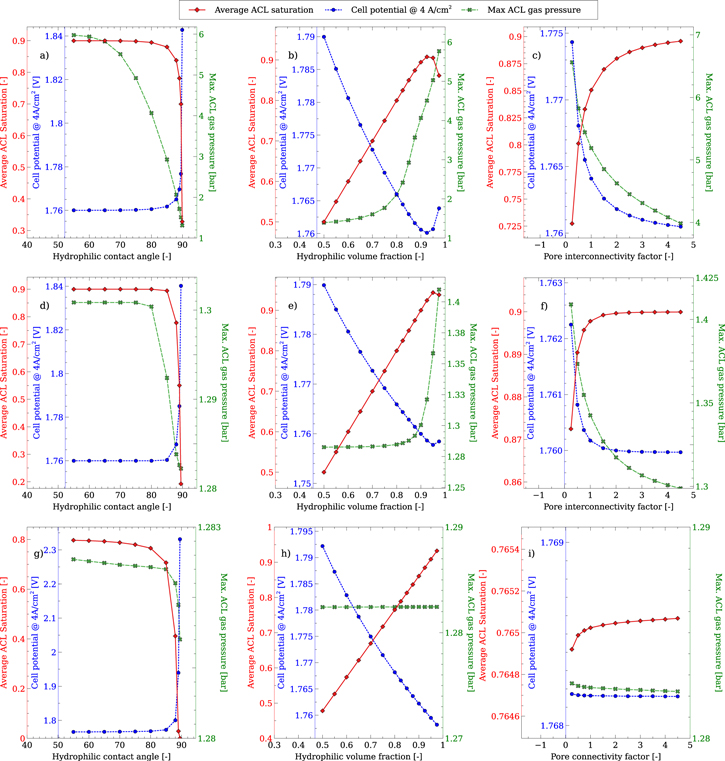
Effect of PSD model parameters
Due to the uncertainty in obtaining certain PSD parameters, such as the hydrophilic portion, pore connectivity factor and the contact angle for the hydrophilic and hydrophobic portions, a parametric study was carried out on these parameters, using the three PSDs. Both catalysts were studied, however the IrOx did not show significant changes in behavior, so the results are not shown here. The study varied one parameter at a time, at a current density of 4 A cm−2, where mass transport limitations should be most significant. The hydrophobic contact angle was not found to induce any change in behavior for either PSD or catalyst so is not shown. As the gas pressure will always be higher than the liquid pressure, the capillary pressure in the ACL will always be negative. As such, it is not possible for the water to invade the hydrophobic pores, so changing the contact angle of these pores cannot affect the mass transport behavior.
Figures 11a, 11d and 11g show that changing the hydrophilic contact angle can have a significant effect on the average liquid saturation and maximum gas pressure in the ACL, as well as the cell potential. For low contact angles, the liquid saturation is close to 0.9 or 0.8, which is the hydrophilic volume fraction of the ACL. At contact angles close to 90°, the liquid saturation drops dramatically for each PSD, as the pores are unable to hold onto the liquid water, and voltage losses increase. The largest PSD sees a very large decrease in ACL liquid saturation causing a large increase in the voltage required to reach 4 A cm−2, as large pores with a high contact angle require very little pressure to invade. As such it may be possible to induce very significant mass transport losses with this homogeneous PSD model. However, it is not likely that the contact angle of the iridium based catalysts are close to 90°, particularly in light of the values reported by Cruz et al. 78 and Chung et al. 79 which were closer to 10°. Note that varying the IrOx hydrophilic contact angle also showed the same behavior for the liquid saturation as the Ir did, i.e. at very high contact angles, the liquid saturation dropped significantly. The gas pressure for the smallest PSD is strongly impacted by the contact angle, as lower angles prevent the gas from invading liquid filled pores, requiring high pressures to escape through hydrophobic section, which only makes up the remaining 10% of the volume. The gas pressure for the other two PSDs is less affected, due to their larger pore sizes which prevent gas pressure buildup.
Figure 11. Parametric study on PSD parameters and their impact on the average ACL liquid saturation and maximum gas pressure in the ACL for the small (top row), medium (middle row) and large PSDs (bottom row) at 4 A cm−2.
Download figure:
Standard image High-resolution image
The change in the hydrophilic volume fraction induces an almost linear change in the liquid saturation, up to a volume fraction of approximately 0.9 for the small and medium PSDs, as the ACL liquid saturation essentially matches the hydrophilic volume fraction. As was discussed previously, the hydrophobic portion of the ACL is never invaded by the water, and provides an increasingly permeable pathway for the gas with decreasing hydrophilic volume fraction. This result suggests that an ACL with a hydrophobic portion of 50% means that 50% of the active area is unavailable for the OER, causing a significant reduction in the catalyst utilization. At very high HI volume fractions, the trend deviates from linearity for the smaller PSDs, as the reduced hydrophobic volume fraction reduces the permeability of the layer, requiring higher gas pressures to move the gas out. The increased gas pressure allows for more of the hydrophilic portion to be invaded by the gas, thereby reducing the liquid saturation. However, significantly reducing the liquid saturation again requires very high gas pressures.
Finally, the pore interconnectivity factor reduces the liquid saturation in the ACL, as it makes the ACL less permeable. However, there is a corresponding rise in the gas pressure, to values that would likely damage the ACL. The larger the PSD, the less impactful the interconnectivity factor becomes.
Conclusions
In this work, a 2D macro-homogeneous model describing the MEA of a PEM water electrolyser was presented. Charge transport is accounted for using Ohm's Law, while the mass transport effects were accounted for by considering the local liquid saturation in the ACL. Darcy's law was used to predict liquid and gas pressures throughout the domain, while a PSD model is used to relate capillary pressure to the liquid saturation and to obtain gas and liquid permeabilities. The governing equations were solved using the finite element method. A detailed fitting procedure was described, in which the layer conductivities are chosen to match the cell resistance and the high frequency resistance. It was found that the standard Tafel equation was not capable of matching the experimentally obtained polarization data in the kinetic region, instead a model that could account for a change in the Tafel slope was used and fitted with a model that accounted for the low effective conductivities of Ir and IrOx based ACLs reported by Mandal et al. 30 The fitted model was found to have very good agreement with the experimentally obtained polarization data.
The impact of mass transport losses was investigated by obtaining polarization curves up to 4 A cm−2 with and without the active area being reduced by the local liquid saturation in the ACL. It was found that in general it is very difficult to significantly reduce the liquid saturation, as the pores in the ACL were considered to be the order of tens of nanometres and hydrophilic, based on experimental data, requiring very high gas pressures to force the water out. Larger pores in the ACL are easier to invade, and minor mass transport losses were observed for pore radii of the order of 700 nm, however it is also difficult to build the gas pressures required to remove larger amounts of water from the ACL and cause a large drop in performance. The quantity of liquid water consumed is extremely low and is readily supplied by the PTL, even at low PTL liquid saturations. The model presented here is, however, a volume-averaged model that cannot account for discrete events, such as a single large bubble blocking a large portion of the ACL and preventing water from reaching the active sites. The model suggests that if there are mass transport losses in PEMWE, they are unlikely to be caused by the generation of a distributed network of gas that significantly reduces the liquid saturation across the entire ACL, and so may be caused by the discrete events instead.
The reaction distribution was found to have a significant impact on mass transport in the MEA. The IrOx ACL has a significantly lower electronic conductivity as compared to the protonic, resulting in the reaction occurring close to the PTL. As such, any evolved oxygen can quickly escape the ACL to the PTL and be removed in the channel. In contrast, the Ir based ACL has a lower protonic conductivity compared to the electronic, so the gas is evolved close to the membrane. The gas is then forced to pass through much of the ACL, which can induce very high gas pressures if the pores are in the tens of nanometres range. Such high pressure can potentially damage the ACL, as evident from volcano-shaped cracks observed in post-operation layers. 58 In addition, the high oxygen pressures at the membrane interface may induce a flux of oxygen to the cathode that will increase with increasing current density, as was observed by Trinke et al. 83 These observations suggest that researchers studying mass transport limitations in PEMWE should note the nature of the catalyst used in the ACL, as catalysts that produce oxygen close to the membrane may have very different mass transport characteristics compared to those that produce the oxygen close to the PTL.
The study also examined the impact of changing the ACL PSD to reflect catalyst micro-structures reported in the literature that had large characteristic pore radii. The larger pores were easier to invade, and therefore more susceptible to mass transport limitations. The presence of such large pore sizes (several hundreds of nanometres) in the ACL may be difficult to realize due to the need to reduce ACL loadings and therefore ACL thicknesses, which are already of the order of only a few microns. Cracks could be introduced to improve ACL permeability if the average pore size is very small, 84–86 though consideration would have to be given to its impact on the in-plane conductivity. 87 Other microstructural parameters were also examined, such as the hydrophilic contact angle and the hydrophilic fraction of the PSD. It was found that water will not occupy the pores of the ACL that are hydrophobic, as the capillary pressure will always be negative. Therefore, any portion of the ACL that is hydrophobic will not have access to water, and would be unavailable to the OER. However, it is likely that the only component of the ACL that is hydrophobic would be the Teflon backbone of the Nafion ionomer; the catalyst surface should always be hydrophilic and therefore have access to water. Varying the hydrophilic contact angle showed that significant mass transport losses can be induced when the angle is very close to 90°, however this is not likely in PEMWE ACLs. It was demonstrated using the developed model that the wettability of the ACL and its pore size have a significant impact on the PEMWE performance. Therefore, accurate characterization of those layers is a crucial step in the further development of the technology.
Finally, the impact of the PTL on the ACL liquid saturation was assessed. It was found that the liquid saturation in the PTL was current density dependent, however the ACL saturation exhibited little change. The liquid saturation in the ACL appears to be only very weakly coupled to that in the PTL, as each layer has a very different intrusion curve. Measurements of the liquid saturation in the PTL using neutron or X-ray imaging are likely not representative of the saturation in the ACL.
Acknowledgments
As a part of the University of Albertas Future Energy Systems research initiative, this research was made possible thanks to funding from the Canada First Research Excellence Fund (https://futureenergysystems.ca; Grant No. T06-P04) to M. Secanell. There are no conflicts to declare.