
Abstract
Prussian White is a promising active material for the positive electrode of sodium-ion batteries as it is comprised of Na, Mn, Fe, C, and N and thus offers high sustainability and low cost. However, exposure of Prussian White to moisture results in chemical changes due to the formation of surface contaminants, as well as structural changes due to the absorption of water into the bulk crystal structure. Here we report an analysis of the formation rate of surface contaminants and bulk water absorption by weight tracking, infrared spectroscopy, and X-ray diffraction over extended periods of storage in high relative humidity air for fully sodiated Na1.8Mn0.8Fe0.2[Fe(CN)6]0.9 and partially sodiated Na1.3Mn0.8Fe0.2[Fe(CN)6]0.9. Fully sodiated Prussian White gains almost 20% in mass due to the formation of interstitial water during 20 h of storage in 100% relative humidity at 25 °C. Surface hydroxides and carbonates are found after storage and a structural change from the rhombohedral to a monoclinic crystal structure is observed. It is found that vacuum drying of Prussian White powder or electrodes at 150 °C can remove the majority of interstitial water and restore the rhombohedral crystal structure, but not remove surface contaminants. Prussian White immersed in water during aqueous electrode processing also shows interstitial water and a monoclinic crystal structure, but no surface contaminants. This suggests that aqueous electrode processing of Prussian White is feasible when effective drying strategies are employed. Indeed, Prussian White electrodes made from H2O-based slurries with CMC/NaPAA binder vacuum-dried at 150 °C show higher specific capacity and similar capacity retention in full cells as Prussian White electrode made from NMP-based slurries with PVDF binder.
Export citation and abstract BibTeX RIS

This is an open access article distributed under the terms of the Creative Commons Attribution 4.0 License (CC BY, http://creativecommons.org/licenses/by/4.0/), which permits unrestricted reuse of the work in any medium, provided the original work is properly cited.
The significant carbon footprint of the transportation sector requires a shift from internal combustion engine vehicles to zero-tailpipe emission battery electric vehicles. 1–4 Lithium-ion batteries are well suited for application in electric vehicles due to their high volumetric energy density and long lifetime. 5 However, a global shift to battery electric vehicles would require on the order of 100 TWh of deployed energy storage in batteries. Storing 1 TWh of energy in lithium-ion batteries with state-of-the-art LiNi0.8Mn0.1Co0.1O2 positive electrode material 6,7 requires approximately 1 million tons of nickel and 100,000 tons of lithium. A massive increase in battery production with predictions for 2030 ranging from 1.2 to 6.6 TWh/year, 8,9 will likely result in resource limitations and price surges of critical metals like lithium and nickel. 10,11
Prussian White (PW) with the general structure NaxMe[Fe(CN)6]y zH2O, where 0 ≤ x ≤ 2, y ≤ 1, Me is one or more metals, e.g. Fe, Mn, etc, and z denotes interstitial water per formula unit, is a nickel- and lithium-free positive electrode material for sodium-ion batteries. Sodium-ion batteries based on such materials have the potential to be low-cost and sustainable alternatives to lithium-ion batteries, but they will likely have inferior energy density (especially with PW due to its low density of 1.98 g cm−3),
12
putting into question their suitability for electric vehicle applications. Nevertheless, their use in stationary battery packs for storage of renewable energy (potentially 300–400 TWh could be needed) would free up important resources for the mobility sector.
13–15
zH2O, where 0 ≤ x ≤ 2, y ≤ 1, Me is one or more metals, e.g. Fe, Mn, etc, and z denotes interstitial water per formula unit, is a nickel- and lithium-free positive electrode material for sodium-ion batteries. Sodium-ion batteries based on such materials have the potential to be low-cost and sustainable alternatives to lithium-ion batteries, but they will likely have inferior energy density (especially with PW due to its low density of 1.98 g cm−3),
12
putting into question their suitability for electric vehicle applications. Nevertheless, their use in stationary battery packs for storage of renewable energy (potentially 300–400 TWh could be needed) would free up important resources for the mobility sector.
13–15
Prussian White has an open framework crystal structure, which results in excellent rate performance as sodium-ions can easily move in and out. 16–18 Unfortunately, this open structure also allows the material to absorb water, which can result in structural changes and poor cycling performance. 19–22 This makes Prussian White more moisture sensitive than oxide-based positive electrode materials that typically suffer from the formation of surface contaminants but do not show structural changes. 23–26 While there have been numerous studies examining the water uptake of Prussian White, the reversibility of this process is currently not understood.
In this study, fully sodiated Na1.8Mn0.8Fe0.2[Fe(CN)6]0.9 and partially sodiated Na1.3Mn0.8Fe0.2[Fe(CN)6]0.9 are exposed to high relative humidity or immersed in water to investigate the effect of sodium content on water uptake, the formation of surface contaminants, e.g., NaOH and Na2CO3, and changes to the crystal structure. After different storage times, ranging from 30 min to one week, the materials are weighed and characterized by infrared spectroscopy and X-ray diffraction. Our study reveals that the immersion of PW in water results in significant water uptake, but not the exchange of intercalated sodium ions with protons, a process that would be analogous to the Li+/H+ exchange in the near-surface region of layered oxide positive electrode materials for lithium-ion batteries. 23–26 Thus, aqueous processing of PW is feasible if structural changes can be reversed. We will explore an efficient vacuum drying method to enable an environmentally friendly H2O-based slurry processing, which also utilizes benign binders instead of polyvinylidene difluoride (PVDF) and toxic N-methyl-2-pyrrolidone (NMP).
Experimental
Preparation of Na1.8MnHCF.—Commercial grade Prussian White, Na1.3Mn0.8Fe0.2[Fe(CN)6]0.9zH2O, z ≈ 1, or Na1.3MnHCF, was provided by Natron Energy, USA.
27
The as-received material was chemically sodiated with a procedure adapted from Brant et al.
28
For this, Na1.3MnHCF (5 g, 16.86 mmol) was dispersed in 25 ml solution of 1 molar equivalent NaI (2.54 g) in water-free acetonitrile (MeCN, Sigma-Aldrich, USA) and heated to 70 °C for 24 h. The reaction produced I2 gas and a white solid with the approximate composition Na1.8Mn0.8Fe0.2[Fe(CN)6]0.9zH2O, or Na1.8MnHCF, which was then washed repeatedly with MeCN, filtered and dried at 150 °C in vacuum (∼10−4 mbar) for 14 h. The sodium content of x = 1.8 in sodiated NaxMnHCF is consistent with the first charge capacity of this material (see coin cell experiments), and close to maximum sodiation given the ∼10% Fe(CN)6 detect sites in this material.
Storage and washing of PWs
The accelerated materials exposure test used in this study was first described by Sicklinger et al. for lithium-ion layered oxide positive electrode materials. 29 Briefly, Prussian White with different sodium content (Na1.3MnHCF and Na1.8MnHCF) was stored for up to one week over an open water bath at 25 °C, located in a vessel that contained a lid with a small hole to allow intrusion of ambient air. This resulted in a controlled atmosphere with high relative humidity (RH ≈ 100%) and ∼400 ppm CO2. Materials referred to as "washed" were immersed in purified water at a 1:5 by weight PW:H2O ratio and stirred with a magnetic stirrer for 20 min Afterwards, the washed PW was vacuum-filtered. Na1.8MnHCF powder undergoing this procedure changes its color from white after chemical sodiation to dark blue after washing and back to white after drying. Exposed samples were dried in a heated antechamber for at least 4 h at 70 °C under dynamic vacuum (∼10−4 mbar) to remove physisorbed H2O, and subsequently stored in an Ar-filled glove box without exposure to ambient air after drying. Note that we did not observe any Na+/H+-exchange during the washing procedure. The water solution did not change its pH and the washed and reheated material did not show a reduced first charge capacity (see coin cell experiments). A summary of the various samples is given in Table I.
Table I. Prussian White materials used in this study.
| Sample | Stoichiometry | Treatment | Duration |
|---|---|---|---|
| pristine Na1.3MnHCF | Na1.3Mn0.8Fe0.2[Fe(CN)6]0.90H2O | vacuum-dried at 150 °C | 14 h |
| stored Na1.3MnHCF | Na1.3Mn0.8Fe0.2[Fe(CN)6]0.9zH2O | storage at ∼100% RH and ∼400 ppm CO2 | 1 h, 3 h, 6 h, 12 h, 24 h, 48 h, 1 week |
| pristine Na1.8MnHCF | Na1.8Mn0.8Fe0.2[Fe(CN)6]0.90H2O | vacuum-dried at 150 °C | 14 h |
| stored Na1.8MnHCF | Na1.8Mn0.8Fe0.2[Fe(CN)6]0.9zH2O | storage at ∼100% RH and ∼400 ppm CO2 | 1 h, 3 h, 6 h, 24 h, 48 h, 1 week |
| washed Na1.8MnHCF | Na1.8Mn0.8Fe0.2[Fe(CN)6]0.9zH2O | immersed in water (1:5 by weight PW:H2O) | 20 min |
Thermogravimetric analysis (TGA)
Pristine and stored PW samples were analyzed on a SDT Q600 TGA system (TA Instruments, USA). First a conditioning step at 25 °C for 15 min with an argon flow rate of 100 ml min−1 was done to remove any air introduced in the TGA sample chamber during the transfer. Afterwards the argon flow rate was reduced to 20 ml min−1, the temperature was increased from 25 to 190 °C with a constant heat ramp rate of 5 K min−1 and the final temperature of 190 °C was held for 15 min Beyond this temperature hydrogen cyanide (HCN) can be released from the decomposition of the MnHCF framework. 19,30 To quench any HCN, the TGA carrier gas stream was diverted to a sodium hypochlorite wash bottle instead of being sent to a mass spectrometer.
Fourier transform infrared (FTIR) spectroscopy
FTIR spectra were collected using a Cary 630 FTIR spectrometer (Agilent Technologies) equipped with a germanium crystal attenuated total reflectance (ATR) accessory. Sixteen scans were collected for each background and sample measurement at a resolution of 1 cm−1 using the MicroLab PC software. All measurements were performed inside an Ar-filled glovebox to minimize exposure to air.
X-ray diffraction (XRD)
XRD patterns of pristine and storage PW powders were collected with a Bruker D8 diffractometer equipped with a Cu target X-ray tube and a diffracted beam monochromator. Samples were measured in the scattering angle (2θ) range of 10°–70° with 0.02° steps. Air-sensitive samples that were previously dried or only exposed for a controlled amount of time were measured in a custom-made air-tight XRD-sample holder with an acquisition time of 20 s/step to improve the signal-to-noise ratio (total measurement time of 17 h/sample). 31,32 All other samples were measured in a regular XRD-sample holder with a shorter acquisition time of 3 s/step (total measurement time 2.5 h sample).
Electrode preparation
Positive electrodes were made from PW in various conditions (see Table I) mixed with C65 carbon black and PVDF at a weight ratio of 90:5:5 in NMP. Negative electrodes were made from hard carbon (HC, Kuranode, Type II, BET surface area 9 m2/g, Kuraray, Japan) mixed with C65 and PVDF at a weight ratio of 94:1:5 in NMP. H2O-based positive electrodes were made from 90% PW mixed with 5 wt% C65 conductive carbon and a mixture of 2.5 wt% carboxymethyl cellulose (CMC) and 2.5 wt% sodium polyacrylate (NaPAA, Sigma-Aldrich, USA) binders. H2O-based negative electrodes were made from 94.5% hard carbon mixed with 1 wt% C65 conductive carbon and a mixture of 2.5 wt% CMC and 2 wt% styrene-butadiene rubber (SBR) binders. Before making the H2O-based positive electrodes, the voltage stability of the various binders was tested by cyclic voltammetry (see below). For that, carbon electrodes consisting of 75 wt% C65 and 25 wt% of either CMC, SBR or NaPAA were made. The slurry viscosities were adjusted by adding appropriate amounts of water. For reference, an NMP-based carbon electrode with 75 wt% C65 and 25 wt% PVDF was made. The slurries were cast onto aluminum foil with a 150 μm notch bar spreader as described by Marks et al. 33 The electrodes were dried in a convection oven at 120 °C for 3 h. Dried electrodes were then calendared at a pressure of 2000 atm, positive electrodes were punched with a diameter of 11.25 mm, and negative electrodes with a diameter of 12.75 mm. Before coin cell fabrication, the electrodes were further dried under vacuum (∼10−4 mbar) for 14 h at 150 °C (for materials referred to as "reheated") or 120 °C (for all other materials). After drying, the positive active material loadings were 10–12 mg cm−2, negative active material loadings were 6–7 mg/cm2.
Electrochemical testing
Galvanostatic cycling is carried out in 2325-type coin cells in a temperature-controlled box at 30 °C using battery testers from Neware (Shenzhen, China). Half cells were assembled with a PW positive electrode, two pieces of Celgard 3501 as the separators with a PP-mesh between them, and metallic sodium foil as the counter-electrode. These cells were filled with 50 mg of 1.5 M NaPF6 in FEC:DMC (1:4 by weight) electrolyte (Shenzhen Capchem, China). Full cells were assembled with a PW positive electrode, one piece of BMF (blown microfiber, 3 M, Canada) as the separator, and a HC negative electrode. These cells were filled with 50 mg of 1.5 M NaPF6 in EC:DMC (1:4 by weight) electrolyte + 4 wt% vinylene carbonate (VC) additive. After assembly, all cells rested for 1 h prior to charge/discharge cycling in order to allow complete wetting; C-rates refer to the nominal specific capacity of 170 mAh/g for sodiated PW. Cells were formed at C/20 between 2 and 4 V for half cells and 1.5 and 4 V for full cells. Half cells were cycled in constant current constant voltage (CCCV) mode with a CV hold at top of charge to a C/50 current cut-off, full cells had an additional CV step on discharge to prevent the accumulation of sodium in the overhang region. After formation, cells were cycled with a similar protocol, but at C/5 rate with C/20 current cut-off in the CV steps and C/20 checkup cycles every 50 cycles.
Cyclic voltammetry (CV)
Cyclic voltammograms were recorded to test the voltage stability of various binders (see above) in 2325-type coin cells with 12.75 mm diameter carbon working-electrodes, two pieces of Celgard 3501 as the separators with a PP-mesh between them, and metallic sodium foil as the counter-electrode. Three subsequent CV cycles were measured with a VMP3 potentiostat (Bio-Logic, France) at 0.1 mV s−1 and 25 °C between 3 and 4.5 V vs Na+/Na.
Results and Discussion
Mass increase of PW during storage
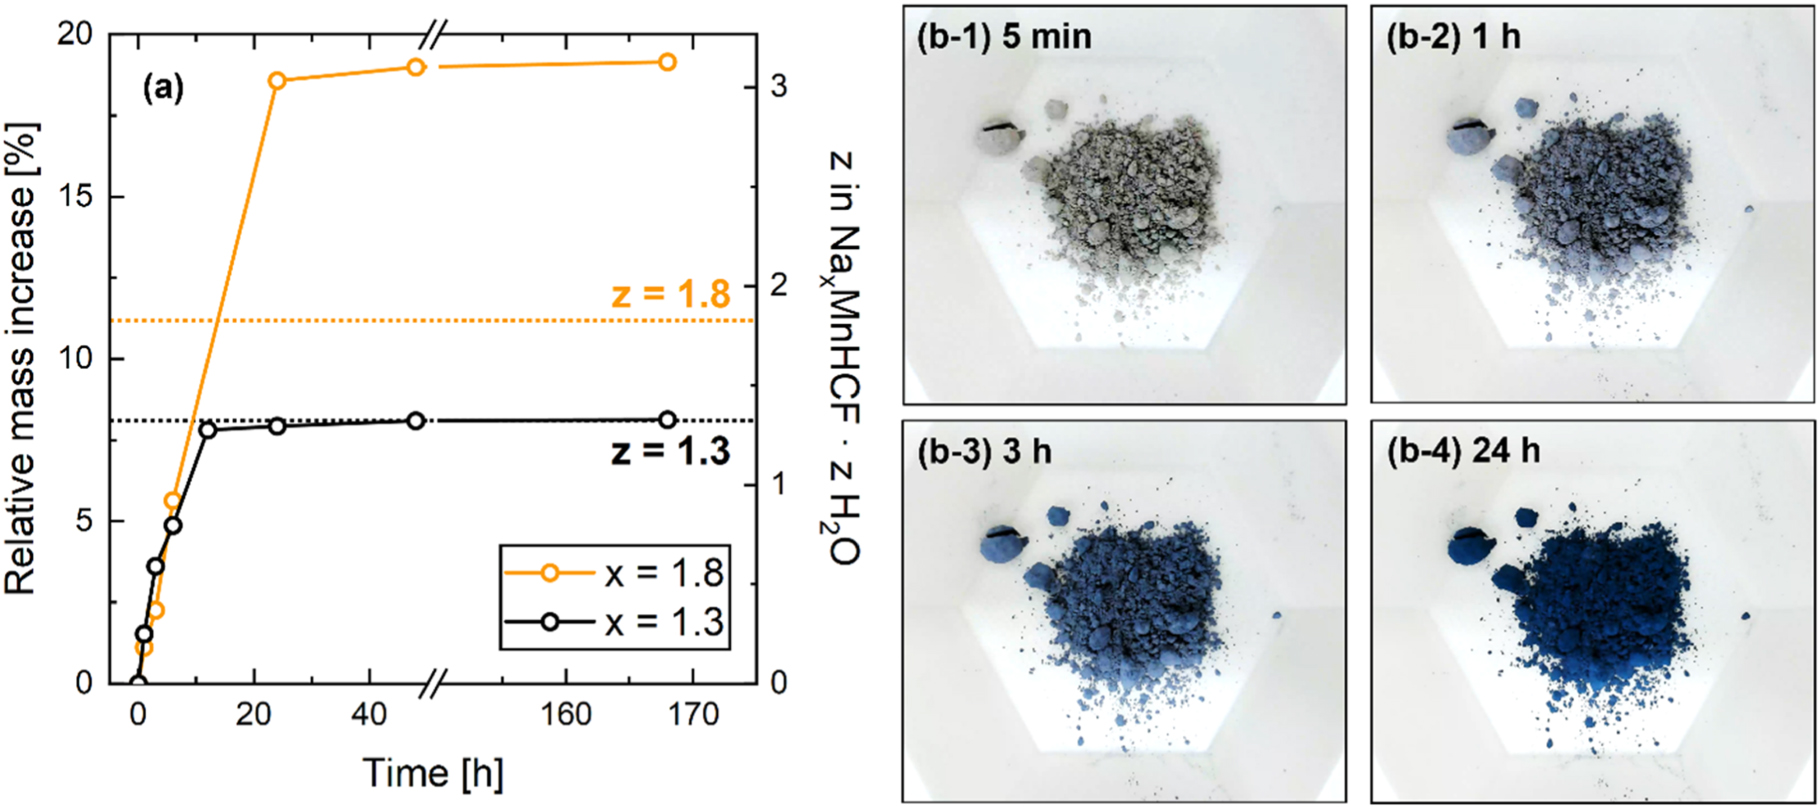
Figure 1a shows the relative mass increase of partially sodiated Na1.3MnHCF (black) and fully sodiated Na1.8MnHCF (yellow) during an accelerated materials exposure test at 100% RH and 25 °C in air. The right y-axis shows the number, z, of water molecules per formula unit calculated from the relative mass increase. For reference, the dashed lines show the mass increase for equal numbers of sodium and water per formula unit (z = x). Both materials were vacuum-dried at 150 °C for 14 h prior to storage to make sure they are mostly dehydrated (z ≈ 0).

Figure 1. (a) Relative mass increase of Na1.3MnHCF (black line) and Na1.8MnHCF (yellow line) as a function of storage time at 100% RH and 25 °C in ambient air. Both PW types were stored simultaneously (up to 1 week or 168 h) in the same storage vessel to minimize differences in storage conditions. The right y-axis shows the number, z, of water molecules per formula unit calculated from the relative mass increase. The dashed lines show the mass increase for equal numbers of sodium and water per formula unit (z = x). (b-1 to b-4) Pictures of the Na1.8MnHCF powder after exposure to 100% RH and 25 °C in ambient air for 5 min, 1 h, 3 h and 24 h. A video of the color change of Na1.8MnHCF as a function of storage time can be found in the Supplementary Information.
Download figure:
Standard image High-resolution imageOver the first day of storage, a rapid mass increase is observed for, both, Na1.3MnHCF and Na1.8MnHCF. After that, the mass of the Na1.3MnHCF sample plateaus at 7.8% increase relative to its starting mass at the 24 h mark and only increases slightly to 8.2% after 1 week of storage. Similarly, the Na1.8MnHCF sample plateaus at a mass increase of 18.6% after 24 h and increases slightly to 19.5% after 1 week. This data shows a clear correlation between the sodium content of PW and the mass increase during storage at high relative humidity, with the fully sodiated material exhibiting more than twice the water uptake of the partially sodiated material. Interestingly, for Na1.3MnHCF, the number of water molecules per formula unit (z = 1.3) calculated from the mass increase is close to the number of sodium atoms (x = 1.3). However, for Na1.8MnHCF this correlation does not hold, and the mass increase would suggest ∼3 H2O per formula unit. The observed mass increase of almost 20% for Na1.8MnHCF is significantly larger than the mass increase by <1% for LiNi0.8Mn0.1Co0.1O2 in an identical exposure test. 26 Other PW materials like Na1.80Fe[Fe(CN)6] showed a similar mass increase when stored at high RH. 20 Such large mass increase indicated the presence of interstitial water in PW after storage, which has been shown to lead to structural changes. 19
Figure 1b shows pictures of the Na1.8MnHCF powder after exposure to 100% RH and 25 °C in ambient air for 5 min, 1 h, 3 h and 24 h. The material is white in its dehydrated state but gradually changes to dark blue the longer the exposure time. A timelapse of the first 24 h of storage can be found in the Supplementary Information showing a clear color change of PW powder from white to dark blue associated with the uptake of interstitial water.
Characterization of surface species on stored PW by FTIR
Figure 2 shows the FTIR transmission spectra of pristine Na1.8MnHCF (black) and Na1.8MnHCF stored at 100% RH and 25 °C for 1 h, 3 h, 24 h, 48 h and 1 week (168 h, yellow). The FTIR measurements were performed on Na1.8MnHCF since it showed more mass increase than partially sodiated PW (see Fig. 1) and would likely show more IR active surface species. The vertical lines in Fig. 2 mark the IR absorption peaks associated with the CN−-bridges in MnHCF at 2050 cm−1, the OH−-vibration of surface hydroxide, adsorbed H2O, or interstitial H2O at 1620 cm−1, and the CO3 2−-vibration at 1300 cm−1 (main carbonate group vibration mode, side peaks of the asymmetric vibrations are marked in light grey at 1460 cm−1 and 1780 cm−1). 19,34–39 It has to be noted that it is not possible to differentiate surface impurities containing OH−-groups from interstitial H2O inside of the crystal structure or from H2O adsorbed on the PW surface with FTIR as the vibrational modes of these species are very similar.
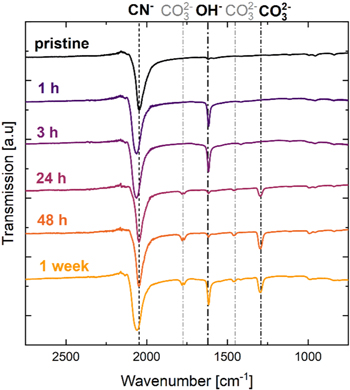
Figure 2. Infrared transmission spectra for pristine Na1.8MnHCF (black) and Na1.8MnHCF stored at 100% RH and 25 °C for 1 h, 3 h, 24 h, 48 h and 1 week (168 h, yellow). Individual lines are offset for better visibility. Signal intensities are normalized to the CN−-stretching mode feature at ∼2050 cm−1. Absorption bands at 1300, 1470 and 1780 cm−1 correspond to CO3 2−, and those at 1620 cm−1 to OH− or H2O. All samples were measured in an Ar-filled glovebox to prevent further exposure to moisture.
Download figure:
Standard image High-resolution imagePristine Na1.8MnHCF shows only one absorption peak at 2050 cm−1, which can be assigned to the CN−-bridge vibration of PW. 19,34–36 No other peaks are visible indicating the absence of IR active surface impurities, e.g., carbonates and hydroxides. PW stored for 1 h shows a slight shift of the CN− absorption band to a higher wavenumber of 2060 cm−1, which will be discussed later. Furthermore, this sample shows a significant peak at 1620 cm−1, which can be assigned to the OH−-vibration in surface hydroxide or H2O. 19,37–39 Storing the material for 3 h leads to a large OH− peak at 1620 cm−1. Interestingly, after 24 h of storage, the OH−-feature at 1620 cm−1 decreased and new absorption bands appeared at 1300 cm−1,1470 cm−1 and 1780 cm−1, which can be assigned to CO3 2−. 29,40–42 This could indicate that the OH−-feature mostly stems from surface hydroxide which converts into carbonate by reaction with atmospheric CO2 during prolonged storage. 29 The cation associated with these anions is likely Na+, which is removed from the PW surface during storage. Note that these samples were heated to 70 °C in a vacuum chamber before bringing them into a glovebox for FTIR measurements, which can explain the absence of adsorbed H2O, but would likely not affect surface hydroxide or carbonate. PW stored for 48 h shows more pronounced CO3 2− peaks than the 24 h sample. The sample stored for 1 week shows similar CO3 2− peaks and a strong pronounced OH−-absorption band from H2O or hydroxide.
Structural changes during PW storage by XRD
Figure 3 shows the powder X-ray diffractograms of pristine Na1.3MnHCF and Na1.8MnHCF (black), as well as Na1.8MnHCF stored at 100% RH and 25 °C for 1 h, 3 h, 24 h and 1 week (168 h, yellow). Vertical lines indicate the characteristic peaks for the monoclinic/cubic phase of PW at 16.9° and the rhombohedral phase of PW at 18.1°.
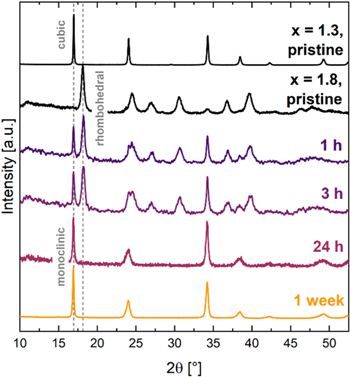
Figure 3. Powder XRD patterns for pristine NaxMnHCF with x = 1.3 and 2 (black), as well as Na1.8MnHCF stored at 100% RH and 25 °C for 1 h, 3 h, 24 h and 1 week (168 h, yellow). Individual lines are offset for better visibility. The first and last sample were measured in a regular XRD-sample holder; all other samples were measured in an air-tight XRD-sample holder to prevent further exposure to moisture, which resulted in a lower signal-to-noise ratio.
Download figure:
Standard image High-resolution imagePristine Na1.3MnHCF shows a cubic structure in Fig. 3, which is in agreement with Song et al. 19 who showed that partially sodiated PW exhibits a cubic crystal structure in, both, hydrated and dehydrated state. In contrast, fully sodiated Na1.8MnHCF was shown to exhibit a rhombohedral structure in its dehydrated state, which converts into a monoclinic structure upon water uptake. 19 Indeed, pristine Na1.8MnHCF shows a rhombohedral phase in Fig. 3, but after only 1 h of storage a peak at 16.9° along with other smaller peaks indicates the presence of a partial monoclinic phase. After 3 h of storage the peak at 16.9° increased in intensity and some peak splitting is observed at higher scattering angles indicating the presence of, both, a rhombohedral and monoclinic phase. After 24 h of storage, Na1.8MnHCF completely converted into a monoclinic phase. The cubic and monoclinic phase of PW have a similar diffraction pattern, which makes it difficult to differentiate them with our in-house XRD. However, it can be observed that the monoclinic phase has slightly broader peaks than the cubic phase and synchrotron XRD work by Song et al. 19 has confirmed that fully sodiated PW exhibits a monoclinic crystal structure. After 1 week of storage, the material is still in its monoclinic phase with no change compared to the 24 h spectrum, indicating that the structural change is completed after at least 24 h.
Removing interstitial water by reheating
Figure 4 shows the normalized mass loss (a) and the derivative of the mass loss (b) as a function of temperature during a TGA experiment with pristine Na1.8MnHCF (black), Na1.8MnHCF stored at 100% RH and 25 °C for 6 h (purple), and 1 week (yellow), as well as Na1.8MnHCF after immersion in water for 20 min (blue) and subsequent filtering and drying at 70 °C. The TGA mass loss data can be compared to the mass increase shown in Fig. 1 and allows to probe if interstitial water can be removed by heat treatment.
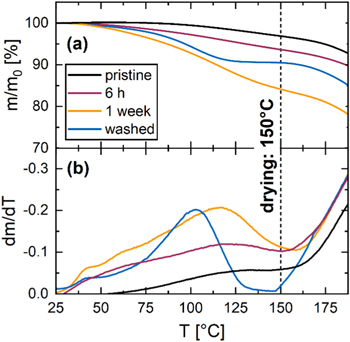
Figure 4. Normalized mass loss (a) and derivate of mass loss with temperature (b) for pristine Na1.8MnHCF (black), Na1.8MnHCF stored at 100% RH and 25 °C for 6 h (purple), and 1 week (yellow), as well as Na1.8MnHCF washed in water (blue). The dotted line marks the drying temperature of 150 °C used in this study. All TGA measurements were done in argon.
Download figure:
Standard image High-resolution imagePristine Na1.8MnHCF shows only a small mass loss of 3% up to 150 °C, which likely stems from adsorption of moisture during sample transfer to the TGA machine. After 6 h of storage Na1.8MnHCF shows a mass loss of 6.3% at 150 °C, which fits well with the mass increase of 5.7% after 6 h in Fig. 1, suggesting that physisorbed and interstitial water can be removed by heating to 150 °C. Na1.8MnHCF stored for 1 week shows 15.9% mass loss at 150 °C, which is again in reasonable agreement with the mass increase of 19.5% observed in Fig. 1. The difference could be explained by loss of adsorbed water during the 70 °C drying prior to the TGA experiment (see Experimental section) and the fact that the carbonate surface impurities formed during storage (see Fig. 2) would not be removed at 150 °C. Immersing Na1.8MnHCF in water for 20 min allows to deconvolute the combined effect of moisture and atmospheric CO2 from simple exposure to water during aqueous electrode processing. The washed sample shows 10% mass loss at 150 °C, which is smaller than the 15.9% observed for the sample stored for 1 week, potentially due to the significantly shorter exposure time. Interestingly, the washed material shows a plateau in the mass loss curve at 150 °C, which corresponds to a minimum in the derivative of the mass loss curve. Thus, the removal of physisorbed and interstitial water typically observed in this temperature range seems to be completed at 150 °C for the immersed sample, 19,30 making it a promising drying temperature for PW electrodes made in an aqueous slurry process.
Heating PW to 190 °C-200 °C would lead to a sharp weight loss due to the decomposition of the MnHCF framework. 19,30 These temperatures need to be avoided in a practical drying procedure, since the material would release toxic HCN gas. 19,30 However, since the weight loss does not completely cease beyond 150 °C, one could explore drying temperatures between 150 and 200 °C or drying at higher vacuum, which will be part of future studies.
Removal of surface groups by reheating
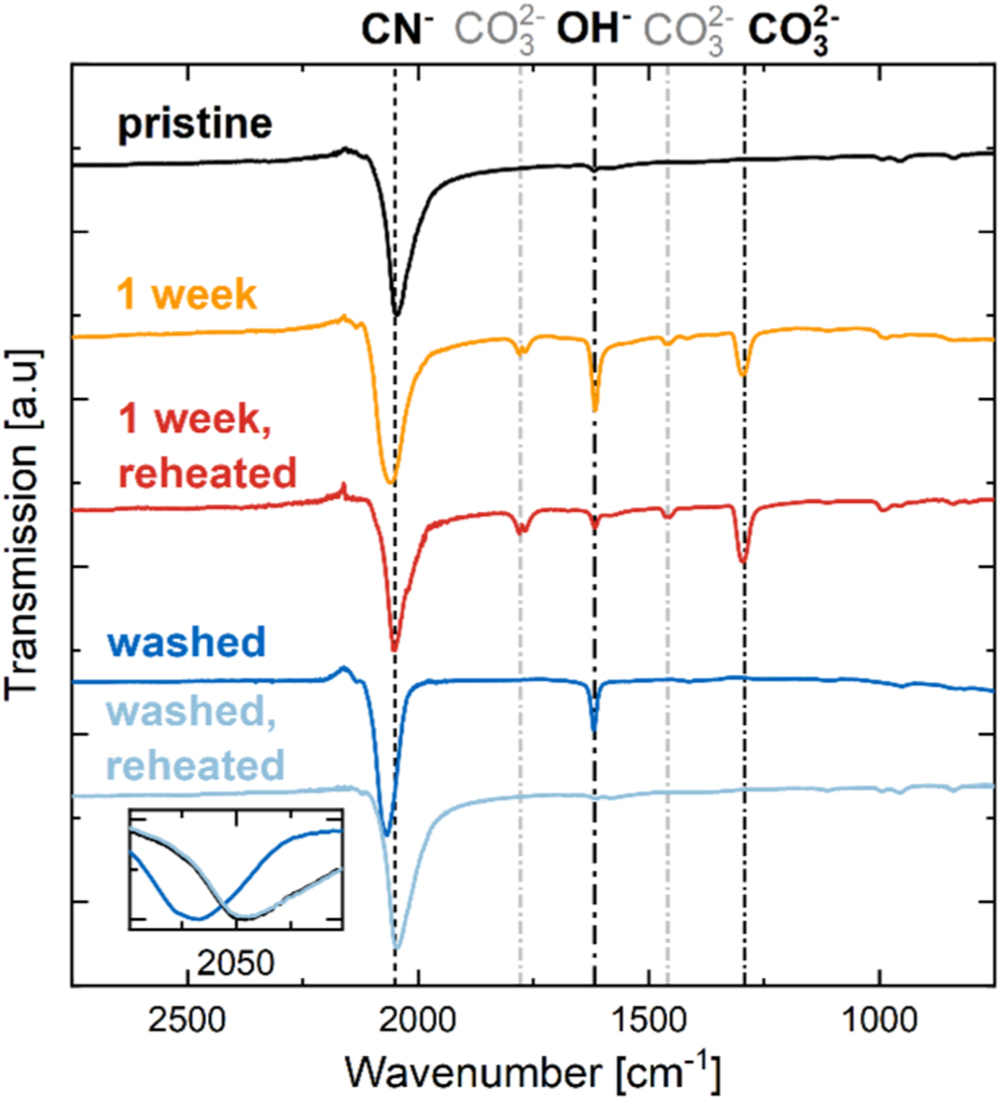
Figure 5 shows the FTIR spectra of pristine Na1.8MnHCF (black), Na1.8MnHCF stored at 100% RH and 25 °C for 1 week (168 h, yellow), the same material reheated at 150 °C for 14 h in vacuum (red), as well as Na1.8MnHCF washed in water (blue) and reheated at 150 °C for 14 h in vacuum (light blue). Note that pristine and 1 week stored Na1.8MnHCF were already shown in Fig. 2.
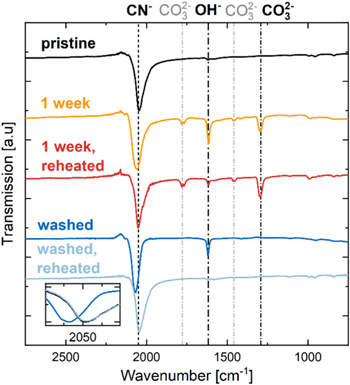
Figure 5. (a) Infrared transmission spectra for pristine Na1.8MnHCF (black), Na1.8MnHCF stored at 100% RH and 25 °C for 1 week (168 h, yellow), the same material reheated at 150 °C in vacuum (red), as well as Na1.8MnHCF washed in water (blue) and reheated at 150 °C in vacuum (light blue). Individual lines are offset for better visibility. Signal intensities are normalized to the CN−-stretching mode feature at ∼2050 cm−1. Absorption bands at 1300, 1470 and 1780 cm−1 correspond to CO3 2−, and those at 1620 cm−1 to OH− or H2O. The inset shows the CN−-stretching mode without offset to illustrate a shift to higher wavenumbers for washed Na1.8MnHCF that is reversed and identical to pristine materials upon reheating. All samples were measured in an Ar-filled glovebox to prevent further exposure to moisture.
Download figure:
Standard image High-resolution imageMaterial that was stored for 1 week and subsequently reheated shows a significant decrease in the OH− absorption band at 1620 cm−1, which can be interpreted as a removal of adsorbed and interstitial water. The small remaining peak at 1620 cm−1 could be from residual NaOH, which would only decompose above 318 °C. 43 There are no changes to the CO3 2− bands upon heating since surface carbonates would only decompose at much higher temperatures, e.g., 900 °C in the case of Na2CO3. 44 Interestingly, washed Na1.8MnHCF shows a somewhat smaller OH− absorption band than the sample stored for 1 week and no CO3 2− bands. Although semi-quantitative, the fact that less interstitial water and fewer surface species are observed for the washed samples compared to the sample stored for 1 week is consistent with the smaller weight loss in Fig. 4. After heating the washed sample to 150 °C, the OH− band is completely gone and the sample looks identical to pristine Na1.8MnHCF. This is further proof that vacuum-drying of washed PW at 150 °C can remove absorb and interstitial water. It also suggests that no hydroxide or carbonate is formed during washing, but rather adsorbed water and interstitial water is found. This means that Na+/H+ exchange needed for the formation of NaOH or Na2CO3 is not observed during the short 20 min immersion of PW in water. The absence of NaOH and Na2CO3 could also be explained by the immediate dissolution of these surface species during washing. However, as we will see later, reheated PW after washing does not exhibit a cubic phase (see Fig. 6), nor does it have reduced charge capacity (see Fig. 8). Thus, there is no significant Na loss during washing.
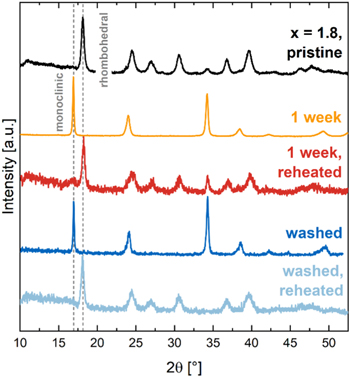
Figure 6. Powder XRD patterns for pristine Na1.8MnHCF (black), Na1.8MnHCF stored at 100% RH and 25 °C for 1 week (168 h, yellow), the same material reheated at 150 °C in vacuum (red), as well as Na1.8MnHCF washed in water (blue) and reheated at 150 °C in vacuum (light blue). Individual lines are offset for better visibility. The second sample was measured in a regular XRD-sample holder; all other samples were measured in an air-tight XRD-sample holder to prevent further exposure to moisture, which resulted in a lower signal-to-noise ratio.
Download figure:
Standard image High-resolution imageThe inset in Fig. 5 highlights the shift of the CN− absorption band of PW to a higher wavenumber of 2070 cm−1 upon washing. After drying the washed sample, the CN− band shifts back to 2050 cm−1 and overlaps with that of pristine material. This shift is very similar to the one observed by operando FTIR spectroscopy of the desodiation process of Prussian blue analogs. 34 It has been shown that interstitial H2O molecules are located close to intercalated Na+-ions, which could mean that H2O shields the electrostatic interaction between Na+-ions and the CN−-bridges and make the CN− vibration mode similar to the one observed in desodiated PW. 19,45 At any rate, the complete reversal of the CN− shift is further proof that all interstitial H2O has been removed from the material.
Reversal of structural changes by reheating
Figure 6 shows the XRD patterns of pristine Na1.8MnHCF (black), Na1.8MnHCF stored at 100% RH and 25 °C for 1 week (168 h, yellow), the same material reheated at 150 °C for 14 h in vacuum (red), as well as Na1.8MnHCF washed in water (blue) and reheated at 150 °C for 14 h in vacuum (light blue). Note that pristine and 1 week stored Na1.8MnHCF were already shown in Fig. 3.
Material that was stored for 1 week and subsequently reheated shows a change from a monoclinic to a rhombohedral crystal structure. Apart from a small peak at 16.9° and slight peak splitting at higher angles, the diffraction pattern for reheated material resembles the one of pristine Na1.8MnHCF. After 20 min of washing, Na1.8MnHCF shows a monoclinic structure, which resembles the crystal structure of material stored for 1 week, indicating that both, storage at high RH and immersion in H2O, lead to the same phase change from rhombohedral to monoclinic. Upon heating the washed material, the phase change can be fully reversed and a rhombohedral crystal structure is obtained that is identical to the one of pristine Na1.8MnHCF.
Combining the information from FTIR (see Fig. 5) and XRD (see Fig. 6), it can be concluded that PW absorbs water in its crystal structure regardless if it is water vapor during ambient storage or liquid water during aqueous electrode processing. Furthermore, the interstitial water can be easily removed by heating the material to 150 °C in vacuum. Unfortunately, hydroxide and carbonate surface species formed during ambient storage cannot be removed by heating the material to 150 °C. However, these surface contaminants do not form during ∼20 min immersion in water, which suggests that they would also not form during brief aqueous electrode processing. Thus, vacuum drying of PW electrodes should fully reverse any chemical and structural changes experienced by the material during immersion in water and enable a low-cost, environmentally friendly electrode manufacturing process. It should be noted, however, that slurry mixing of large batches in industry would take longer than 20 min, which warrants future studies of long-term water exposure of PW.
Voltage stability of binders for aqueous PW electrodes
Appropriate binders have to be selected for aqueous PW electrodes that provide electrode cohesion and adhesion to the Al current collector. In particular, the voltage stability of the polymer binders needs to be tested since PW/HC full cells are charged to 4.0 V, which means the polymer binder in the positive electrode experiences ∼4.1 V vs Na+/Na, which would be equivalent to ∼4.4 V vs Li+/Li. Graphite negative electrodes and LiFePO4 positive electrodes for lithium-ion batteries can be made in an aqueous slurry process. 46,47 A typical binder system for aqueous graphite negative electrodes is CMC combined with SBR. 48 For aqueous LiFePO4 positive electrodes, combinations of CMC, SBR, PTFE, PAA and other binders have been explored. 49,50 LiFePO4/graphite cells typically charge to 3.65 V, 51 which is significantly lower than the voltage experienced by binders in PW positive electrodes.
Figure 7 shows CVs of C65 carbon electrodes prepared from a H2O-based slurry with either 25 wt% CMC (red), SBR (blue), or NaPAA (light blue), as well as carbon electrodes made from an NMP-based slurry with 25 wt% PVDF (black dashed line) for reference. The CVs were recorded in 2325 coin cells with a Na metal counter-electrode to test the voltage stability of the three different binders in a range from 3.0 to 4.5 V vs Na+/Na.
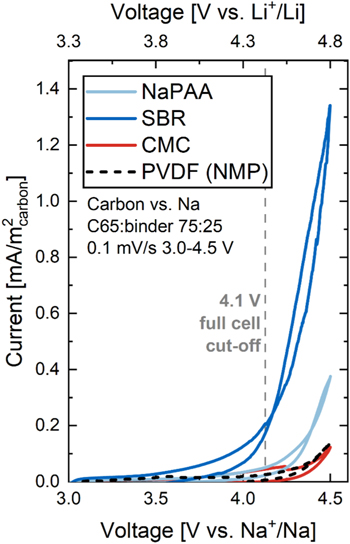
Figure 7. Cyclic voltammograms of carbon electrodes made from a H2O-based slurry with either 25 wt% CMC (red), SBR (blue), or NaPAA (light blue), as well as carbon electrodes made from an NMP-based slurry with 25 wt% PVDF (black dashed line). All CVs were recorded in 2325 coin cells with a Na metal counter-electrode and 50 mg 1M NaPF6 FEC:DMC (1:4 by weight) electrolyte at 0.1 mV s−1, 3–4.5 V vs Na+/Na, and 25 °C. The grey dashed vertical line marks the 4.1 V voltage cut-off in Na1.8MnHCF/HC full cells.
Download figure:
Standard image High-resolution imageThe PVDF-bonded carbon electrode shows minimal current at 4.1 V vs Na+/Na (max. positive electrode voltage in PW/HC full cells) and ∼0.1 mA m−2 carbon surface area normalized current density at 4.5 V vs Na+/Na (≈4.8 V vs Li+/Li), which is in agreement with Jung et al. 52 Similarly small currents are observed with CMC-bonded carbon electrodes indicating high voltage stability of this binder. SBR-bonded carbon electrodes show 0.2 mA m−2 at 4.1 V vs Na+/Na and >1.3 mA cm−2 at 4.5 V vs Na+/Na, highlighting the susceptibility of this polymer to oxidative decomposition. A possible reason for the voltage instability of SBR could be the presence of carbon-carbon double bonds in the polymer chain from which electrons can be withdrawn. This is consistent with a report by Yabuuchi et al., which shows that the unsaturated C=C of butadiene chains in SBR is irreversibly oxidized at voltages above 4.2 V. 53 In addition to cyclic voltammetry, the authors use a chemical staining technique by osmium tetraoxide to proof that the double bonds of the butadiene unit in SBR can be electrooxidized. 53 SBR is typically used in combination with CMC to improve cohesion of graphite negative electrodes, 48,54 but the data in Fig. 7 suggests that it cannot be used at the high voltages experience in PW positive electrode. An alternative to SBR with better voltage stability could be NaPAA. NaPAA-bonded carbon electrodes show similarly low currents as electrodes with CMC up to 4.1 V vs Na+/Na making it a suitable binder for combination with CMC in aqueous PW electrodes.
Half cell voltage profiles and differential capacity
Figure 8 shows the first cycle voltage profiles and differential capacity vs voltage plots of PW half cells with electrodes made from (a) pristine Na1.8MnHCF (black) and Na1.8MnHCF stored for 1 week at 100% RH and 25 °C (yellow), as well as (b) Na1.8MnHCF stored for 1 week at 100% RH and 25 °C heated to 150 °C before slurry making (red) and Na1.8MnHCF electrodes made from a H2O-based slurry with CMC/NaPAA binder dried at 150 °C in vacuum (light blue).
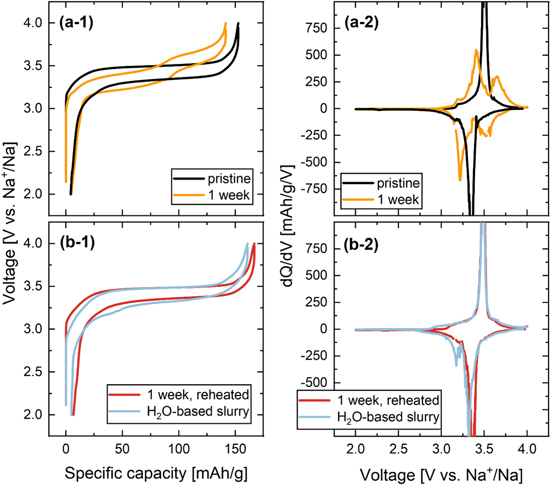
Figure 8. Cell voltage vs specific capacity curves and dQ/dV vs V during the first C/20 cycle for PW half cells with electrodes made from (a) pristine Na1.8MnHCF (black) and Na1.8MnHCF stored for 1 week at 100% RH and 25 °C (yellow), or (b) Na1.8MnHCF stored for 1 week at 100% RH and 25 °C heated to 150 °C as electrodes (red) and Na1.8MnHCF electrodes made from a H2O-based slurry with CMC/NaPAA binder dried at 150 °C in vacuum (light blue). Cells were cycled at 30 °C with 50 mg 1.5M NaPF6 FEC:DMC (1:4 by weight) electrolyte, two Celgard 3501 separators with a polymer mesh between them and areal loadings of ∼1.5 mAh/cm2 for PW.
Download figure:
Standard image High-resolution imageThe voltage profile of pristine Na1.8MnHCF shows a single plateau during charge and discharge at 3.5 V and 3.35 V vs Na+/Na, respectively (see panel a-1). Accordingly, only a single dQ/dV peak is visible for this material (see panel a-2). This is in agreement with Song et al. 19 who showed that dehydrated rhombohedral PW has a single voltage plateau. 19 Pristine Na1.8MnHCF achieves 150 mAh g−1 discharge capacity (theoretical capacity 170 mAh g−1) and only shows a small irreversible capacity of 2 mAh g−1. After 1 week of storage, Na1.8MnHCF shows a step in its voltage profile and two distinct dQ/dV peaks centered around 3.4 V and 3.65 V vs Na+/Na. The first cycle discharge capacity is reduced to 140 mAh g−1. Electrodes from this material have been dried at 120 °C, which means that residual interstitial water is likely remaining in the material leading to the characteristic voltage step of hydrated PW and the reduced specific capacity (7 wt% H2O would be sufficient to explain the observed 10 mAh g−1 reduction in specific capacity, due to the mass increase of the electrode). 19 In contrast, 1 week stored Na1.8MnHCF reheated to 150 °C (see Fig. 8b) shows only a single voltage plateau and dQ/dV peak at 3.5 V vs Na+/Na characteristic of dehydrated material and a relatively high first cycle discharge capacity of 157 mAh g−1, which is better than pristine material heated to 120 °C. The improved performance of reheated PW is in agreement with the removal of interstitial water shown by FTIR and the rhombohedral phase found by XRD. Surface hydroxide and carbonate which remained on the exposed material after reheating (see Fig. 5) may account for the difference between experimental and theoretical capacity. Finally, Na1.8MnHCF processed in H2O with CMC/NaPAA binder, which was subsequently vacuum-dried at 150 °C shows a single voltage plateau and dQ/dV peak at 3.5 V vs Na+/Na confirming that it is mostly dehydrated even after immersion in H2O. Its specific discharge capacity of 155 mAh g−1 is similar to PW dehydrated after storage and the voltage profile as well as dQ/dV features show no indication of CMC/NaPAA binder instability.
Performance of full cells with aqueous PW and HC electrodes
Figure 9 shows voltage profiles, differential capacity and capacity retention data for PW/HC full cells with both, the positive and negative electrode processed in H2O (light blue), and both electrodes processed in NMP (black). The H2O-based slurries had CMC/NaPAA binder for the positive electrode and CMC/SBR binder for the negative electrode. The NMP-based slurries had PVDF binder for both electrodes. Aqueous PW electrodes were vacuum-dried at 150 °C, all other electrodes were vacuum-dried at 120 °C. These full cells will allow to compare the capacity retention of NMP and H2O-processed PW in the absence of sodium-metal, which is prone to dendrite formation and low coulombic efficiency over extended cycling. 55,56
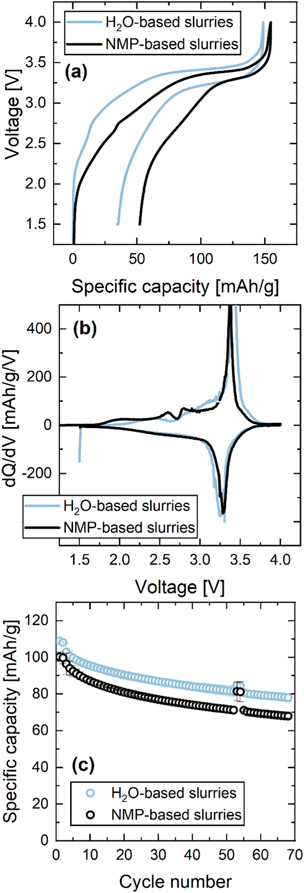
Figure 9. Cell voltage vs specific capacity (a) and dQ/dV vs V (b) during the first C/20 cycle, as well as specific capacity vs cycle number (c) for PW/HC full cells with pristine Na1.8MnHCF. PW electrodes were either made from NMP-based slurries with PVDF (black) or H2O-based slurries with CMC/NaPAA binder (light blue) dried at 150 °C in vacuum. Cells were cycled at 30 °C with 50 mg 1.5 M NaPF6 EC:DMC (1:4 by weight) + 4% VC electrolyte, one BMF separator and areal loadings of ∼1.7 mAh/cm2 for HC and ∼1.5 mAh/cm2 for PW.
Download figure:
Standard image High-resolution image
The voltage profiles of both full cell types differ from the half cell voltage profile, due to the characteristic voltage of HC upon sodium insertion and removal, with a sloped high voltage region and a low voltage plateau around 0.15 V vs Na+/Na. 57,58 Full cells with NMP-based electrodes show a first charge capacity of 154 mAh g−1 (see Fig. 8a), which is similar to half cells with pristine Na1.8MnHCF (see Figs. 7a–71). Upon discharge, however, a high irreversible capacity of 52 mAh g−1 is observed leading to a specific discharge capacity of 102 mAh g−1. Note that the NP-ratio of 1.13 in these cells was not optimized and future work will focus on improving the first cycle efficiency of HC, e.g., by selecting appropriate electrolyte additives. Full cells with H2O-based electrodes achieve a slightly lower first charge capacity of 149 mAh g−1, but also a smaller irreversible capacity loss of 34 mAh g−1, resulting in a higher specific discharge capacity of 115 mAh g−1. The improved first cycle efficiency could be related to a difference in surface groups on hard carbon immersed in water compared to hard carbon that reacted with moisture, N2, O2, and CO2 in the air. 59–61 Furthermore, Dahbi et al. found an improvement of the first cycle efficiency and better cycling performance if a water-based CMC/SBR binder was used for hard carbon anodes instead of PVDF binder. 62 The dQ/dV vs V curves in Fig. 9b show that both cells have their main dQ/dV peak at ∼3.3 V. The absence of a second peak towards higher voltage suggests that both PW electrode materials are dehydrated.
Figure 9c shows the capacity retention of full cells with NMP- and H2O-based electrodes. The former shows a specific discharge capacity of 102 mAh g−1 at C/20 and 97 mAh g−1 at C/5 (error bars indicate standard deviation of pair cells). The latter show a slightly higher specific discharge capacity of 110 mAh g−1 at C/20 and 103 mAh g−1 at C/5 due to their higher first cycle efficiency (see Fig. 9a). Both cells show a similar capacity retention of 75% after 70 cycles with unoptimized carbonate electrolyte. While this capacity retention is clearly not sufficient for practical application, it shows that full cells with H2O-based PW electrodes are feasible if chemical and structural changes due to water uptake are reversed by effective drying. It should be pointed out that the manganese hexacyanoferrate material used in this study can cycle 40,000 times at 25 °C to 80% of its starting capacity when couple with a manganese hexacyanomanganate negative electrode. 27 Also, CATL announced a long cycle life sodium-ion battery that is based on Prussian White and hard carbon. 63 This underlines the opportunity for careful electrolyte optimization in order to improve the cycle life of sodium-ion full cells with Prussian White positive electrodes and hard carbon negative electrodes.
Conclusions
In this study, we have shown that the formation of surface contaminants and the rate of bulk water absorption for fully sodiated Na1.8MnHCF and partially sodiated Na1.3MnHCF during storage in high relative humidity air can be characterized by weight tracking, infrared spectroscopy, and X-ray diffraction. It was found that significant mass increase of up to 20% for Na1.8MnHCF is due to interstitial H2O, which can be removed by vacuum-drying at 150 °C. Surface hydroxides and carbonates from storage in humid air have been shown to remain after drying. Na1.8MnHCF exposed to humidity exhibits a monoclinic crystal structure which can be converted into a rhombohedral structure upon drying that closely resembles the structure of pristine, fully sodiated and dehydrated Prussian White.
The reversibility of chemical and structural changes of Na1.8MnHCF upon drying motivated the aqueous processing of this material to enable electrodes with environmentally benign and voltage stable CMC/NaPAA binder. Na1.8MnHCF immersed in H2O for 20 min shows the formation of interstitial water and a monoclinic crystal structure. However, vacuum-drying at 150 °C could remove the interstitial water and retore the rhombohedral crystal structure characteristic of dehydrated Prussian White. Prussian White electrodes made from H2O-based slurries with CMC/NaPAA binder dried under these conditions showed higher specific capacity and similar capacity retention in full cells as Prussian White electrode made from NMP-based slurries with PVDF binderS. This suggests that aqueous electrode processing of Prussian White is feasible when effective drying strategies are employed.
Supporting Information
Video showing color change of Prussian White as a function of storage time.
Acknowledgments
This work was funded under the auspices of NSERC/Tesla Canada Alliance Grant program. L.H. thanks Hubert Gasteiger for the opportunity to do a research stay at Dalhousie University. We thank Natron Energy, USA, for providing the Prussian White material used in this study.