

Abstract
Doping of Ni-rich LNMC cathode materials with tungsten via solid-state route has been shown to stabilize the materials against structural degradation at high voltages during electrochemical cycling. Here we use a wet-chemical doping method to homogeneously introduce 0.5 mol% tungsten into dense NMC811 (Li[(Ni0.8Mn0.1Co0.1)]O2), followed by a detailed structural and electrochemical characterization. A homogeneous distribution of W in the materials was evidenced by elemental mapping and TOF-SIMS. The increase in bond-dissociation energy to oxygen (BDEO) of the transition metal (TM) site led to compressed slab thickness (TMO6 octahedron width in c-direction), indicating shorter, and thus strengthened, TM–O bonds, as also confirmed by TGA-MS results. Importantly, statistical analysis of electron backscatter diffraction (EBSD) data revealed a W-induced radial alignment of a–b planes of the primary particles. The cycling stability of the doped material was more than 7% higher for the W-doped (92.4%) as compared to the undoped NMC811 (85.3%) material at a higher upper cut-off voltage of 4.5 V vs Li/Li+. Furthermore, the voltage decay was lower (0.2 V vs 0.29 V), leading to >2% lower energy loss (5.3% vs 7.4%) for the W-doped material.
Export citation and abstract BibTeX RIS
Lithium-ion batteries (LIBs) and their application in electric vehicles (EVs) have become one of the main strategies to decrease mobility-related CO2 emissions. However, there is still a demand for longer driving ranges and increased lifetime at overall lower process and material costs than currently existing state-of-the-art Li-ion battery technologies can offer. 1–5 Due to its increased Ni-amount, high-Ni layered cathode materials such as NMC811 (Li[Nix Coy Mnz]O2 with x = 0.8, y = 0.1, z = 0.1) provide more energy compared to lower Ni-amounts leading to increased driving ranges. However, with increasing Ni-stoichiometry the cathode active materials face thermal and structural instabilities leading to safety issues and declined cycling stability. These phenomena mainly originate from a phase transition from layered R−3m phase to a spinel Fd−3m and finally to a rock-salt phase Fm−3m at the surface of the particles, resulting also in a release of oxygen from the structure. Also, the resulting crystal phases at the surface that prevent lithium-ion diffusion, lead to further increased capacity fade. The gas evolution increases further due to higher amount of unstable Ni4+ at the surface, which react with the electrolyte forming additional gases such as e.g. O2, CO, CO2. These issues become are getting more severe when operating the battery at higher voltages. 6–10 Increasing the operating window of a NMC811 battery to a higher upper cut-off voltage leads to a deeper de-lithiation, and to an increased concentration of Ni4+ at the surface of the material. Additionally, for higher upper cut-off voltages (such as 4.5 V vs Li/Li+), particle crack and microcrack formation is getting more pronounced. The higher degree of de-lithiation is accompanied by an increased unit cell volume variation for the material during cycling, which generates higher local mechanical stresses. This provides additional surface area which undergoes the same phase transition and parasitic side reactions leading to more gas generation. 6–10 This enhances also the probability of thermal runaway, affecting the overall safety parameters of the battery. 11–14
Taken together, for high-Ni NMCs, increasing the upper cut-off voltage can be a strategy to achieve higher driving ranges in EVs, albeit on the expense of a decreased battery lifetime, lower safety, and usually increasing process and cell design costs.
Several strategies has been attempted in order to address these problems, including substituting cations of the material by other cations (e.g. Al, Na, Mg, W, Zr, Ta, Nb). 15–18 When introducing high valent cations like W, Ta, or Mo into the structure, an increase in Li–Ni mixing can be expected. To maintain charge balance at the transition metal site, one proposed mechanisms is the reduction of Ni3+ to Ni2+. 19,20 Compared to Ni3+, Ni2+ with its similar ionic radius compared to Li+ (Li+: 76 pm; Ni2+ 69 pm) is more likely to enter a Li-site. 21 Thus, high-valent dopants can increase the amount of Ni2+ in the structure, leading to increased Li–Ni mixing. If we assume a homogenously distributed doping within the bulk of the material, an ordered occupation of dopant at transition metal sites, and thus an ordered Li–Ni mixing, can be expected. This could lead to increased stability due to the "pillar effect," which is has been suggested to stabilize electrochemically inactive Li-sites in the host structure, preventing the crystal lattice from collapsing, especially at increased upper cut-off voltages. 19,20 Another doping strategy is to increase the average TM-site bond dissociation energy to oxygen (BDEO). It has been proposed that the use of dopants with high BDEO values (W, Mo, Nb, Ta, Hf) can suppress surface phase transitions, which in turn lowers the amount of oxygen released from the structure in the process. 18–20,22–26 Additionally, the amount of Ni4+ at the surface of the cathode active material could be reduced leading to decreased intensity of the parasitic gas generating side-reactions with the electrolyte. 18
W-doping in NMC material was widely studied in the past years, reporting its stabilizing effect on the cathode active material's structure. 20,23–25 However, in this study, the focus lays on a comprehensive structural analysis of one W-doped material and its comparison to the undoped NMC811 in order to gain further and coherent insights on the impact of W-doping of high-Ni NMCs to better picture underlying mechanisms of electrochemical and structural stabilization for operation at higher upper cut-off voltage. Therefore we chose a wet-impregnation doping approach to increase the probability of homogenous distribution of W in the bulk of the dense hydroxide precursor material, in order to allow the detection of W-induced changes on unit cell dimensions as well as on electrochemical properties with higher significance compared to solid state approaches. Furthermore, we analyze the homogeneity of the W-distribution and are able to conclude the absence of a pure W-containing coating at the near surface by in-depth TOF-SIMS measurements. To add further support to our hypothesis, that W-doping can help to increase the average BDEO on transition metal site, we investigate the release of oxygen and carbon dioxide by TGA-MS measurement of fresh and initially charged electrodes.
Experimental
Synthesis of the materials
Spherical and dense NMC811 hydroxide precursor Ni0.8Co0.1Mn0.1(OH)2 was synthesized through continuous co-precipitation method (Fig. S1). A mixed solution of NiSO4·6H2O (Roth, >99%, ACS), MnSO4·H2O (Roth, >99%, ACS), and CoSO4·7H2O (Roth, >97%) (Ni:Mn:Co = 8:1:1, in molar ratio, 2.3 M) was pumped into a continuously stirred tank reactor (1350 ml) at 45 °C during stirring. Simultaneously, the reactor was fed with separate solutions of NH4OH (aq., 7 M) and NaOH (aq., 8 M). A constant pH-value of 11.7 was maintained over the reaction time. After filtration and washing with deionized water the precursor was dried overnight at 120 °C. To obtain undoped NMC811 the dry precursor was mixed with LiOH·H2O (Alfa Aesar, >98%, Li:TM = 1.03) and then calcined at 800 °C, for 16 h with a heating rate of 5 °C min−1 under pure oxygen atmosphere. The W-doped material was synthesized by firstly impregnating the dry hydroxide precursor in an Ar-glovebox with dried and degassed ethanol followed by addition of tungsten ethoxide (Alfa Aesar, >99,9%). Following this, the mixture was stirred for 2 h at room temperature. Afterwards, the ethanol was evaporated under inert conditions. Then, the obtained powder was vacuum dried at 120 °C overnight. Finally, LiOH was added (Li:TM = 1.03) and the mixture was calcined in the same calcination run as the undoped samples.
Material characterization
Transmission electron microscopy—energy dispersive X-ray spectroscopy (TEM-EDX) study was performed using a LIBRA 200 MC Cs scanning TEM (Carl Zeiss) operating at an accelerating voltage of 200 kV, the EDX was performed using a detector of Oxford instruments attached to the TEM. The source of X-ray detected is generated by the 200 keV electrons bombarded into the material. TEM lamellae for EDX and standard TEM imaging were prepared by standard life-out technique in a SEM/FIB system (Carl Zeiss NVision 40). The lamellae for HRTEM were prepared by further thinning and polishing using FIB at 5 keV. The XPS data were collected using a PHI Quantera II device (operating voltage: 15 keV) with monochromatic Al-Kα radiation. For Time-of-Flight secondary ion mass spectroscopy (TOF-SIMS) deep profiling measurements were conducted using a TOF-SIMS 5 (ION TOF) device with Bi+ analysis beam (25 keV, 0.75 pA) and O2 + sputter beam (1 keV, 150 nA). To gain insights on the homogeneity of element distribution reaching from the surface into the bulk of single grains of cathode particles, based on previous experiences using this set-up on similar materials, the sputter time was set to 230 s what is assumed to correspond to a penetration depth of 50 nm. For each sample three TOF-SIMS analyses were carried out to validate reproducibility. The crystal structure of the obtained cathode active materials were analyzed by powder X-ray Diffraction (XRD, D8 Advanced, Bruker AXS). The measurements were conducted in the 2θ range of 10°–90°, with a scan rate of 1.2 s−1 and a step size of 0.02° in Bragg-Brentano geometry with a non-chromatic Cu-Kα radiation source and 2D detector (Lynxeye_XE, Bruker AXS). The data were analyzed with focus on phase purity and crystal structure using TOPAS software (Bruker AXS, Topas, Version 5) and integrated Rietveld-method. For further investigation on crystallographic orientation electron backscattering diffraction (EBSD) results were carried out. After embedding the powder samples in epoxy resin cross-sections were prepared via ion beam milling (Leica EM TIC020). For SEM and EBSD analysis of the cross-sections a FE-SEM Crossbeam 550 (Zeiss) with symmetry detector (Oxford) was used. In-operando X-ray diffraction (in-operando XRD) studies were conducted using a Empyrean Series 3 diffractometer (Malvern Panalytical) with Mo X-ray source (55 kV and 40 mA) and GaliPIX3D detector (2D-mode). The single layer pouch cell samples were charged with a current rate of C/10 (1C = 200 mAh g−1) using a battery test system (Biologic, SP-150). X-ray Data were collected in 20 mV steps with following OCV-step (20 min) in the 2θ range of 2°–50°, with a scan rate of 200 s−1 and a step size of 0.014° in transmission set-up for the voltage range of 3.5 V–4.4 V vs graphite anode. The obtained X-ray data was evaluated using Highscore Plus software (Version 4.9). Differential scanning calorimetry (DSC) analyses of delithiated cathodes with additional 5 μl electrolyte (1 M LiPF6 in a mixture of ethylene carbonate and ethyl methyl carbonate, EC:EMC 3:7 + 2% vinylene carbonate, Merck) were conducted using a Netzsch DSC 204 F1 Phoenix device. The samples were analyzed in CrNi steel closed crucibles under nitrogen atmosphere with a heating rate of 5 K min−1 in the temperature range of RT-350 °C. Thermogravimetric analysis with mass spectroscopy (TGA-MS) of charged and uncharged electrodes without electrolyte were conducted in aluminum oxide crucibles under nitrogen gas flow using a TGA/DSC 3 + (Mettler Toledo) and a ThermoStar (Pfeiffer Vacuum, Primaplus QMG 220 Kompakt MS). The heating rate was set to 10 K min−1. The collected data (temperature range 200 °C–1000 °C) were analyzed using STARe (Version 16.20c) and QUADERA software.
Electrode and cell preparation
The cathode active materials were mixed with conductive agent (Super-P Carbon Black, Imerys) and polyvinyliden fluoride binder (Solvay, Belgium) in N-Methyl-2-pyrrolidone (Carl Roth, Germany, NMP, purity >99%) using a centrifugal mixer (Speedmixer DAC 600.2 Vac-P, Hauschild) to obtain a slurry according to the mass ratio of 94:3:3 (CAM:carbon additive:binder). The slurry (65 wt% solid content) was then coated onto Al foil (20 μm thickness) using a doctor blade to obtain electrodes with an active material loading of 8.0 ± 0.2 mg cm−2. After drying the electrodes for 6 h at 60 °C they were pressed to an electrode thickness of 45 μm leading to composite density of 3.0 g cm−3. Afterwards, they were punched and vacuum dried (overnight, 130 °C, <0.01 mbar). The electrodes were transferred into an Ar-filled glovebox to build 2032-type coin cells with Li metal as anode (12 mm diameter, 450 μm thickness) using one 1 mm spacer, one spring, two glassfiber separators (Whatman GF/A) and 150 μl of electrolyte (1 M LiPF6 in a mixture of ethylene carbonate and ethyl methyl carbonate, EC:EMC 3:7 + 2% vinylene carbonate, Merck). For higher upper cut-off voltages, such as 4.5 V Al2O3-coated bottom parts were used. For building single layer pouch cells (63 × 38 mm cathode, 65 × 40 mm anode) the electrodes were handled in a dry room with a dew point of <−60 °C. After drying the cathodes (8 mg cm−2, 1C = 200 mAh g−1, 1.60 mAh cm−2, N/P: 1.10 ± 0.05.) and anodes (1.75 mAh cm−2) for 16 h at 80 °C under vacuum, the single layer pouch cells were built using a polyolefin separator (Cellgard). After transferring the pouch cells to an Ar-filled glove box, the cells were further dried at 80 °C for 18 h under vacuum. Afterwards, 900 μl of electrolyte (1 M LiPF6 in a mixture of ethylene carbonate and ethyl methyl carbonate, EC:EMC 3:7 + 2% vinylene carbonate, Merck) were added and the cells were welded.
Electrochemical testing
The electrochemical tests were conducted using a galvanostatic Basytech Cell test system at room temperature. For all coin cell tests and all synthesized materials 1C was nominated to 180 mAh g−1. A comprehensive test procedure with 80 charge-discharge cycles including discharge rate capability (0.1C charge for each step; 3x 0.1C, 3x 0.3C, 3x 0.5C, 3x 1C, 3x 3C, 3x 0.1C discharge; 3.0–4.5 V vs Li/Li+) followed by long-term cycling test (62x 1C/1C discharge; with charge current voltage step until I < 0.1C; 3.0–4.5 V vs Li/Li+) was performed for all samples.
Additionally, electrochemical impedance spectroscopy (EIS, 5 mHz–1 MHz) data using a VMP-3 (Biologic) device were collected for coin half cells vs lithium metal anode. Current controlled a state of charge of 50% was set followed by 30 min. OCV period. The procedure was analogue to the rate and stability test. EIS was measured after C/10 formation cycle, after analogue rate-test and after 50 1C cycles to have comparable data.
Results and Discussion
Structural investigation
Figure 1 shows SEM images of (a) NMC811 hydroxide precursor, (b) calcined reference NMC811 (c) cross section for calcined reference material. The as-synthesized hydroxide precursor exhibits a dense surface structure. From particle cross-section the dense core structure of the calcined material is visible. The D50-value of particle size distribution was measured by laser-diffraction analysis. For hydroxide precursor D50 was determined to be 9.5 μm, while for both W-doped and undoped calcined material the corresponding value was 10.9 μm. For all materials the D90 value was <20 μm and the D10 value >4 μm. Figures 1d–1h TEM-EDX results indicate homogenous distribution of W within the bulk of each grain of the doped material. Furthermore, HR-TEM analyses (Figs. 1i–1j) reveals the typical α-NaFeO2 layered structure of NMC materials (space group R
 m, No. 166).

Figure 1. SEM images showing (a) the as-synthesized hydroxide precursor (b) the calcined reference material, and (c) a cross section (microtome) of the reference sample. TEM-EDX (d) elemental mapping results for the W-doped sample (e) Ni, (f) W, (g) Mn and (h) Co. HR-TEM (i) and Fourier-transformed pattern (j) indicating layered structure of the reference material.
Download figure:
Standard image High-resolution imagePrevious studies state that W exclusively occupies the TM site in Ni-rich CAM. 20 Using this structural model, we obtain the most reasonable data from Rietveld-refinements (Fig. S2). Ni2+ is considered as the ion with the highest probability of occupying the Li-position, as it has the closest ionic radius compared to Li+ (rNi2+ 0.69 Å, rNi3+ 0.56 Å, rMn4+ 0.53 Å, rCo3+ 0.55 Å, rW6+ 0.60 Å and rLi+ 0.76 Å, octahedral coordination). 21 Considering this, values for the occupation of the Li-site by transition metals were calculated. For all materials, we evaluate the volume weighted crystallite size from integral breadth and the volume-weighted microstrain by using the double Voigt approach. With these assumptions Rietveld-refinements are conducted. Using the refined c-parameter of the unit cell and the refined z-parameter of oxygen (corresponding to Wyckoff position 6c), slab thickness S and interslab space thickness I (S - distance of oxygen atoms in TMO6 in c direction,; I - distance of oxygen atoms in LiO6 in c direction) have been calculated. 27 The results are summarized in Table I.
Table I. Overview for crystallographic data obtained by Rietveld refinement for Li[(Ni0.8Co0.1Mn0.1)−xWx]O2 (x = 0 reference NMC811; x = 0.005 W-doped NMC811).
| Sample | a [Å] | c [Å] | z [Å] | Slab thickness S [Å] | Interslab thickness I [Å] | Li–Ni mixing [%] | Cry.size [nm] | Microstrain [%] | Unit cell volume [Å3] | χ2 |
|---|---|---|---|---|---|---|---|---|---|---|
| NMC811 | 2.8718 | 14.2082 | 0.2580 | 2,140 | 2.596 | 1.8 | 253 | 0.19 | 101.48 | 2.5 |
| W-doped NMC811 | 2.8745 | 14.2149 | 0.2583 | 2.134 | 2.604 | 5.3 | 95 | 0.27 | 101.71 | 2.6 |
Measured XRD data for W-doped and undoped reference sample are shown in Fig. 2. For both samples the detected reflexes can be attributed to the typical α-NaFeO2 (space group R
 m, No. 166) structure of NMC materials. No hints for the presence of rock salt contaminations, tungsten oxide or lithium tungstate species could be observed. The peak splitting of 018/110 and also 006/012 implies high crystallinity and a well-ordered layered structure.
9,10,17
For the W-doped sample the peak splitting was less pronounced, giving further support for the decrease in atomic order upon W-doping. Furthermore, the increase in reflex width upon doping indicates that W-doping leads to a decrease in the crystallite size and/or an increase in the micro strain. The intensity ratio for 003 and 104 for undoped NMC811 compared to current literature (1.6–1.9) is outstandingly high (I(003)/I(104) = 2.01), indicating a well-ordered, layered structure. As expected, the W-doped sample showed significantly lower values (1.66), which corresponds to a decrease in atomic order of the material.
9,10,17
The increased disorder can originate from W-induced changes in the transition metal or lithium site occupation. To maintain charge balance, the substitution of TM3+ by W6+ during Li+ incorporation during calcination can lead to lower amounts of incorporated Li+ to the Li-site, which should result in lower initial charge capacities of doped materials. Additionally, when using the same amount of Li-precursor for doped and undoped materials, the doped material should consist of more Li-containing impurities at the surface,s as not all Li gets incorporated into the crystal structure. Assuming this as the only mechanism for maintaining overall charge balance corresponding to 0.5 mol% W-doping 1.5 mol% lower incorporated Li is expected. Thus, the initial charge capacity of W-doped material should be > 4 mAh g−1 lower (assumption: 100% = 274 mAh g−1). Furthermore, an increase in the amount of Li-containing surface impurities usually leads to accelerated parasitic side-reactions with the electrolyte resulting in higher capacity fade.
11,12,28
The second possible mechanism of maintaining charge balance describes the reduction of Ni4+ or Ni3+ to Ni2+ species.
19,20
As Ni2+ is more likely to occupy the Li-site within in the crystal structure a higher amount of Ni2+ should lead to significantly higher cation mixing/disorder.
26
The previously discussed lowered intensity ratio of 003/104 and the less pronounced peak splitting for doped material already supports the second proposed mechanism.
m, No. 166) structure of NMC materials. No hints for the presence of rock salt contaminations, tungsten oxide or lithium tungstate species could be observed. The peak splitting of 018/110 and also 006/012 implies high crystallinity and a well-ordered layered structure.
9,10,17
For the W-doped sample the peak splitting was less pronounced, giving further support for the decrease in atomic order upon W-doping. Furthermore, the increase in reflex width upon doping indicates that W-doping leads to a decrease in the crystallite size and/or an increase in the micro strain. The intensity ratio for 003 and 104 for undoped NMC811 compared to current literature (1.6–1.9) is outstandingly high (I(003)/I(104) = 2.01), indicating a well-ordered, layered structure. As expected, the W-doped sample showed significantly lower values (1.66), which corresponds to a decrease in atomic order of the material.
9,10,17
The increased disorder can originate from W-induced changes in the transition metal or lithium site occupation. To maintain charge balance, the substitution of TM3+ by W6+ during Li+ incorporation during calcination can lead to lower amounts of incorporated Li+ to the Li-site, which should result in lower initial charge capacities of doped materials. Additionally, when using the same amount of Li-precursor for doped and undoped materials, the doped material should consist of more Li-containing impurities at the surface,s as not all Li gets incorporated into the crystal structure. Assuming this as the only mechanism for maintaining overall charge balance corresponding to 0.5 mol% W-doping 1.5 mol% lower incorporated Li is expected. Thus, the initial charge capacity of W-doped material should be > 4 mAh g−1 lower (assumption: 100% = 274 mAh g−1). Furthermore, an increase in the amount of Li-containing surface impurities usually leads to accelerated parasitic side-reactions with the electrolyte resulting in higher capacity fade.
11,12,28
The second possible mechanism of maintaining charge balance describes the reduction of Ni4+ or Ni3+ to Ni2+ species.
19,20
As Ni2+ is more likely to occupy the Li-site within in the crystal structure a higher amount of Ni2+ should lead to significantly higher cation mixing/disorder.
26
The previously discussed lowered intensity ratio of 003/104 and the less pronounced peak splitting for doped material already supports the second proposed mechanism.
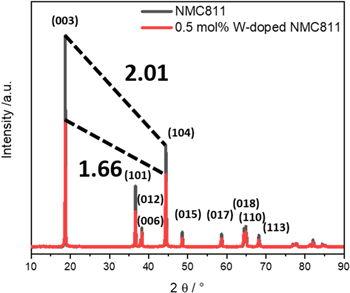
Figure 2. X-ray powder diffraction patterns of Li[(Ni0.8Co0.1Mn0.1)1−xWx]O2 with x = 0 and x = 0.005. Intensity ratios of 003/104 reflexes are highlighted.
Download figure:
Standard image High-resolution imageAll Rietveld-refinements show high quality and excellent reliability expressed by low χ2 - values (χ2 ≪ 4). As expected, higher a- and c-parameters, thus a larger unit cell volume, was obtained for the W-doped material. This result is in accordance to current literature on NMC W-doping, as the ionic radius of W6+ is significantly higher as compared to that of Ni3+. 19,20,23–25 Additionally, an increased value for the cation mixing of Li+/Ni2+ can be observed. Previous studies on the effect of high valent dopants which occupy the TM sites also discuss the stabilizing effect of increased, but ordered Li-Ni mixing value on electrochemical cycling stability. 19,20,26 Thus, we expect a homogenous distribution of the high valent dopant within the bulk of the material is a necessity in order to generate regularly occurring pillars in the structure to achieve superior cycling stability. From Rietveld refinement results we can conclude an increase in z-parameter and c-parameter resulting in lower values of slab thickness and higher values of interslab thickness. An increase in interslab thickness leads to more space for lithium de-/ and intercalation, what should be resulting in feasible bulk Li-diffusion. Decreased slab thickness values correspond to shortened, thus strengthened average TM–O bonds, which is in accordance with its twice as high BDEO value compared to the NMC elements. However, comparing reference and W-doped sample the influence on this parameter is minor compared to other unit cell changes. A high influence of W-doping on crystallite size and microstrain can be observed. Compared to the undoped reference, the average crystallite size for the doped material is found to be >60% smaller. Note, that both materials were synthesized in the same calcination run. Moreover, the volume-weighted microstrain for W-doped sample is significantly higher compared to the undoped material. The microstrain represents the displacement of atoms from their ideal position, produced by lattice imperfections, such as dislocations, vacancies, interstitials, substitutionals and/or similar defects. 29 As discussed above, W has a larger ionic radius than the average of the TM ions, which can lead to distortion of the crystal lattice resulting in increased microstrain. Furthermore, its high valence might cause vacancies, bond length variations and local stoichiometry variances, which also would contribute to an increased microstrain. 19,20,23
Electron backscattering diffraction data was further analyzed using a novel statistical data analysis method in order to elucidate preferential crystallographic orientation effects. 30 In the following a brief introduction on this analysis method is given. Measured EBSD Euler angles were transformed to a vector field visualization of the c-axes. For the same raw data, a reference vector field for which all vectors are radial with respect to the center of the spherical secondary particles was generated. Comparing the distribution of the angular difference, Δα, between both vector fields at each of their data points, the misalignment of measured data from perfectly radial case in form of a probability density can be obtained. For perfectly randomly distributed orientations the intrinsic sine of 90°−Δα (see Fig. 5) was calculated, serving as a reference line which allows to evaluate the statistical significance of the obtained misorientation angles. Having transferred the distribution to respective misorientations of a-b-planes a normalized visualization of probability over misorientation angle is possible (see Fig. S3). The sum of probability for radial misorientation angles with 0° < Δα < 12° (π/15) are presented in Fig. 3. In order to exclude outliners, this data analysis were conducted for 3 particles of each sample. Additionally, it was ensured that the particles were cut near to their center by conducting this data analysis for different center coordinates with variation of ±1 μm. From Fig. 3 it can be seen, that for pristine NMC811 the obtained values are in the range of perfect random distribution (∼0.13) while with high reproducibility for W-doped NMC811 samples significantly higher probability values are obtained. This underlines the impact of W-incorporation on the crystal structure of the material, resulting in increased tendency of radially oriented primary particle a-b planes. A similar effect was obtained by Ta-doping and the effect was attributed to the higher ionic radius of Ta, leading to increase of (104) and decrease of (003) surface energy resulting in (003) preferential orientations of Ta-doped material and thus increased radial texture of the cathode active material. 19
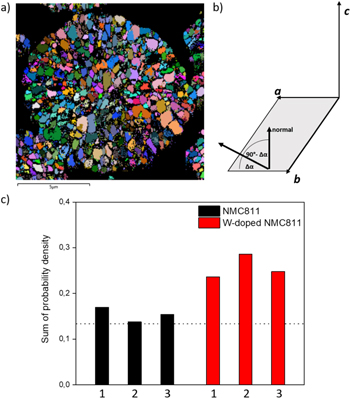
Figure 3. Measured Euler angles from powder cross section EBSD analysis (a), Δα radial misalignment angle explanation (b) and sum of probability density distribution values for misorientation angles with 0° < Δα < 12° obtained from statistical analysis of EBSD data for NMC811 and W-doped NMC811 for 3 particles each (c). The constant dotted line at 0.13 is corresponding to probability density values for perfectly random distributed orientations.
Download figure:
Standard image High-resolution imageFigure 4 show the XPS results for both doped and undoped material. Data were collected with a typical XPS penetration depth of roughly 5–10 nm. Comparable signals for both materials regarding Ni, Mn and Co were observed. Additionally, signals for C and minor signals for Na, S and Si could be observed for both the undoped and the W-doped material. The presence of the C signal can be explained by the handling of high-Ni NMC for XPS analysis preparation at ambient air. Through reaction of surface excess LiOH with CO2 the formation of C-containing impurities such as Li2CO3 is expected. 28 Minor Na, S and Si impurities can be attributed to synthesis residuals (NaOH, Metal-SO4, SiO2 from glass tank reactor) which were not removable through washing with deionized water. Based on the results presented in Fig. 2e, the potential presence of WO2 or metallic W species can be excluded. The results suggest the likely presence of a mixture of WO3 and WO4 2− species in the surface region, which could originate from either incorporated W6+ in the crystal structure of the NMC811 or from the formation of a surface coating layer of lithium tungstate (Li2WO4).
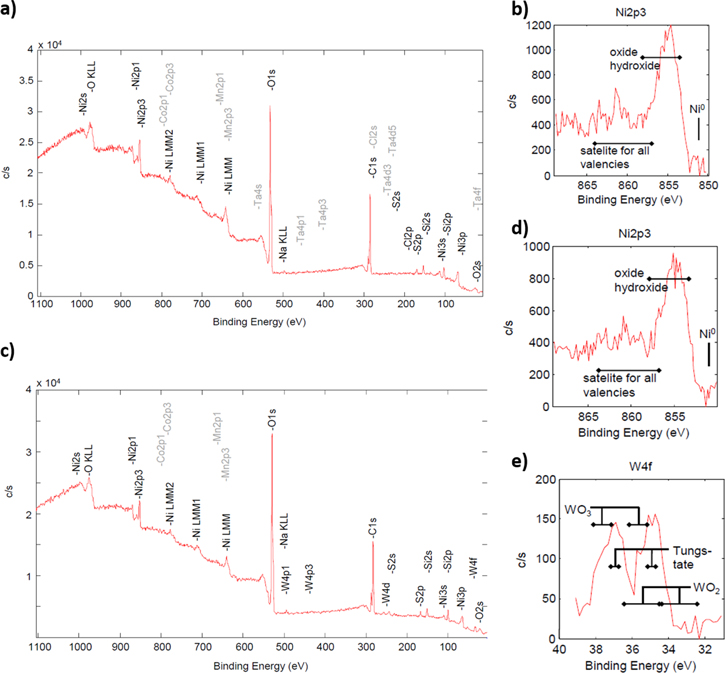
Figure 4. X-ray photoelectron spectrometry (XPS) results for reference NMC811 (a) and (c) W-doped NMC811. Magnification in the region of Ni binding energies for undoped (b) and W-doped (d) material are presented. For W-doped sample the W related binding energy region is shown (e).
Download figure:
Standard image High-resolution imageFigure 5 show the deep profiling TOF-SIMS results on reference and W-doped material. The reproducibility of the measurements was ensured by data evaluation of triplicate measurements for each sample targeting different particles. The presented data represent the mean value of each element and the error bars were calculated by standard deviation. To underline the significance of detected WO3−-signal, for the undoped material the noise level of the measurement was recorded. From experience on earlier studies it can be assumed, that using this set-up a sputter time of 230 s corresponds to roughly 50 nm penetration depth. For sputtering time <10 s several possible measurement disturbances such as surface impurities or edge effects have to be considered. It can be seen clearly that W is distributed homogenously all over the grain of the spherical particles. The W-signal follows the trend of the other element signals and does not show any minimum or maximum signal intensity, indicating that W is distributed evenly, similar to the other detected elements in the bulk of the grain. Thus, considering TEM-EDX and TOF-SIMS results, a W-coating of the grains can be excluded. Comparing the Co–Ni signal intensity ratio for both samples, the W-doped sample contains a lower amount of Co, especially close to the surface of the grains. However, there is a significant deviation between the Ni/Co ratio also for higher penetration depths between the undoped and the doped samples, indicating the presence of less Co in the grains for W-doped NMC811. Thus, a substitution of Co by W could be suggested based on this data. Note that both samples originate from the same precursor, thus no deviation in transition metal amount is expected. However, there is no supporting Co-containing side phase detectable by XRD.

Figure 5. Time-of-flight secondary ion mass spectroscopy (TOF-SIMS) results for reference NMC811 (a) and W-doped NMC811 (b). Data with a sputter time of 230 s for LiO2−, NiO2−, MnO3−, CoO2−, WO3− and for reference the noise level are presented. Each data point is presented with corresponding standard deviation value obtained from triplicate measurements targeting different particles.
Download figure:
Standard image High-resolution imageTaken together, the wet chemical impregnation followed by calcination evidently led to homogenous incorporation of W into the bulk crystal structure of NMC811 grains. Furthermore, statistical data analysis of EBSD results reveal W-induced preferential radial orientation of the a–b planes of primary particles.
Electrochemical investigation
In this section, the influence of W doping on the electrochemical properties will be discussed. In Fig. 6 electrochemical results for coin-cell testing (4.5 V vs Li-metal anode) is presented. An overview of discussed electrochemical data is shown in Table II. The Coulombic efficiency (CE) for the first formation cycle of W-doped material (Fig. 6c) is 5% lower compared to the reference material. The CE decrease for the first cycle for W-doped NMC811 materials is in accordance with the literature on doped materials. 18–20,23,24 The rate capability of W-doped material seems to be improved, however interpretation of the obtained data is difficult as both materials show a slight increase in capacity during the first cycles. The W-doped material continues to show this behavior for the duration of the rate capability test, while the capacity delivered by the reference material decreases from the 4th cycle on, indicating that degradation phenomena dominate the capacity increase effect for undoped reference material. The increase in capacity can be attributed either to further electrolyte wetting of the electrode structure due to the ongoing contraction and expansion of the CAM. As de-lithiation leads to high volume changes within the material during the first cycles, additional surface area can be generated by microcracking or widening of the pore structure. However, the improved cycling stability of W-doped material is already observable within if one compares the C/10 capacities in the beginning and at the end of the ate-capability test (Fig. 6a). Following the rate-capability test, the cycling stability results are presented in Fig. 6b. Due to the degradation of the reference material during the rate capability test, we could observe a higher initial capacity at 1C for W-doped material. The capacity retention for the W-doped material after 62 cycles at 1C/1C is significantly higher compared to the reference material (92.4% vs 85.3%). Thus, the W-doped material shows improved cycling stability although it is delivering higher capacity, which is synonymous with higher degrees of delithiation, a main factor for typical degradation phenomena. As depicted in Fig. 6d, the reference material shows a higher change in the average charge and average discharge voltage as compared to the W-doped material. Overall, the reference material delivered an accumulated output energy of 51.4 Wh g−1 at 55.5 Wh g−1 energy input, which results in an overall energy loss of 7.4%. For the W-doped material the overall energy loss was 5.3%. A decrease of Coulombic efficiency is usually associated with intensified surface side reactions with the electrolyte, suggesting suppressed side reaction intensity for W-doped material. 11–14 For the pristine reference, Figs. 6e–6h show the 1st derivative of the charge and discharge curves (dQ dV−1 plots) for both materials for the first and for the 18th cycle (Figs. 6e–6f, 0.1C/0.1C), and for the 19th and 80th cycle (Figs. 6g–6h, 1C/1C), respectively. One origin of capacity fade of NMC materials lays in the anisotropic unit cell volume change, leading to microcracking of secondary particles. 20 The critical region for degradation by microcracks is reported to be at cell voltages higher than 4.15 V (vs Li/Li+), connected to the H2–H3 phase transition. Comparing the expression of H2–H3 transition, both materials do not show significant decay for the rate-capability test. However, in agreement with previous studies, the reference material show no H2–H3 peak expression after the cycling stability test, while the W-doped material maintained the sharp H2–H3 transition peak. Particles which experience intense microcracking generate fresh new surface areas which contribute to the parasitic side reactions with the electrolyte, due to the before mentioned phase transition of the CAM. This also accelerates the capacity fade.

Figure 6. Coin half-cell test results for 3.0–4.5 V for 0.5 mol% W-doped and undoped reference sample. Presented are (a) the rate capability test, (b) the following cycling stability test, (c) the formation potential profile, (d) the average charge and discharge voltage and (e)–(f) the dQ dV−1 plots obtained by the first derivatives of charge and discharge curves for formation cycle and after rate capability test for C/10 comparison and additionally (g)–(h) for the 20th and 80th cycle for 1C comparison.
Download figure:
Standard image High-resolution imageTable II. Overview of electrochemical results for W-doped and reference material.
| Sample | 1st CE [%] | Capacity retention fomation baseline [%] | Capacity retention 1st 1C baseline [%] | Average Voltage decay [V] | Overall energy loss [%] | Initial charge transfer resistance [Ω] | Charge transfer resistance after rate-test [Ω] | Charge transfer resistance after 80 cycles [Ω] |
|---|---|---|---|---|---|---|---|---|
| NMC811 | 87.8 | 77.5 | 85.3 | 0.29 | 7.4 | 7.1 | 45.7 | 101.2 |
| W-doped NMC811 | 82.8 | 91.0 | 92.4 | 0.20 | 5.3 | 4.8 | 13.7 | 27.0 |
Figures 7a–7b show the PEIS results as Nyquist plots for pristine and W-doped NMC811. The raw data was fitted using an electrical equivalent circuit model. As we observe three semicircles in raw data, additionally to ohmic resistance three constant phase elements were considered for fitting. We attribute surface and contact resistance of the working electrode to the semicircle at highest frequencies, followed by surface and contact resistance of counter electrode (Li-metal) at lower frequencies. 31 The semicircle at the lowest frequencies is attributed to charge transfer process at the working electrode. Similar expressed charge transfer processes for counter electrode were not observed in raw data. In accordance with the literature, a higher charge transfer resistance increase was detected for the reference material (Figs. 7a–7b). 20,23 The origin of this lies partly in an increasing passivation layer from side reactions with the electrolyte laying on top of the NMC particles inhibiting the Li-diffusion of the material. Additionally, the degradation within the rate-capability test can be seen. While the W-doped NMC shows an increase of charge-transfer resistance of 4.8 Ω to 13.8 Ω (+288%), the resistance increase of the undoped sample is more pronounced from 7.1 Ω to 45.7 Ω (+644%) within the rate-capability test. After 80 cycles the pristine sample shows a charge-transfer resistance of 101.2 Ω (+1425%), while the W-doped sample show relatively small increase up to 27 Ω (+562%).
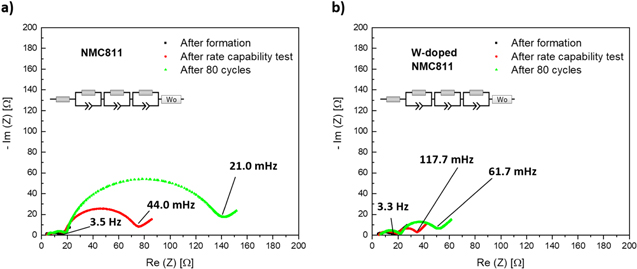
Figure 7. Potentiostatic electrochemical impedance spectroscopy (PEIS) results presented as Nyquist plots for (a) undoped NMC811 and (b) W-doped NMC811 cycled at 3.0–4.5 V. Analogues test procedure as shown in Fig. 5. PEIS measurements after formation cycle, after rate capability test and after 80 cycles.
Download figure:
Standard image High-resolution imageRandomly oriented primary particles are reported to experience intense and complex mechanical strain. 19 The alignment of a-b planes in W-doped material leads to decreased detrimental effect of unit cell volume change preventing from microcracking and thus capacity fade. Overall, this suggests that the abrupt unit-cell volume change caused irreversible degradation with higher intensity to the reference material compared to the W-doped material. In order to investigate this phenomenon further, in-operando XRD studies on single layer pouch cells (graphite anode) were carried out (Figs. 8a–8c). Figures 8a–8b) show the voltage dependant a− and c-parameter variance up to 4.4 V (vs graphite). For both materials; the a− and c-parameter trends are comparable. However, for the reference material a higher c-parameter maximum and after abrupt contraction (H2-H3 transition) at ∼4.1 V a lower minimum value compared to the W-doped material was observed, leading to higher anistropic unit cell volume shrinkage for reference material during operation of the cell (Fig. 8c). This is in accordance with recent studies. 20,25 For the reference material, the unit cell volume decreased rapidly by 6.3% due to the H2-H3 phase transition, while for W-doped NMC811 the contraction was limited to 5.6%. Additionally, the negative slope for the reference material in this region is more pronounced, indicating the volume change occurs more abruptly. It is well established that increased lattice volume changes are accompanied by higher mechanical stress resulting in intensified microcracking of the secondary particles. 20 Utilizing the Rietveld-method we found an increase in occupation of the Li-site by Ni2+ in the W-doped material. A larger amount of ordered cation mixing can lead to improved structural stability, as the immobile Ni2+ act as stabilizing pillar ions between the slabs preventing bulk strain at high delithiation grades as well as protection from lattice collapses. 8,19,20,24,27 Thus, in comparison with the reference material a decreased unit cell volume change value for W-doped material indicates reduced expression of H2–H3 phase transition. This results in less mechanic stress and thus less degradation of the material. Furthermore, the cycling stability of W-doped material is improved significantly for the corresponding voltage range. The previously discussed W-induced radial oriented a–b planes of primary particles can assist to buffer sudden unit cell volume changes and lower mechanical strain. 20 Although the W-doped material reached higher delithiation degrees during electrochemical testing (Fig. 6) the W-induced suppression of phase transition in combination with preferential radial orientation of the primary particles (radial texture) led to less capacity fade. This indicates less pronounced mechanical stress even for deeper delithiated W-doped material. Previous studies report, for increasing Ni-stochiometries the average valence of Ni-ions in the TM-site increases. 32 It can be assumed, that doping the transition metal site with high valent elements lower the amount of high valent Ni species (Ni4+, Ni3+). Lower amounts of Ni4+ are directly correlated with lower side reaction intensity with the electrolyte on the particle surface. 6 We believe, that the phase transition suppression can additionally be partly attributed to the increased BDEO value by W-doping compared to the average BDEO value in reference NMC811 structure. When the dopant show high BDEO values (e.g. W, Ta, Nb or Hf), doping can lead to strengthened TM–O bonds, which eventually can further suppress phase transition and subsequently oxygen evolution. 18
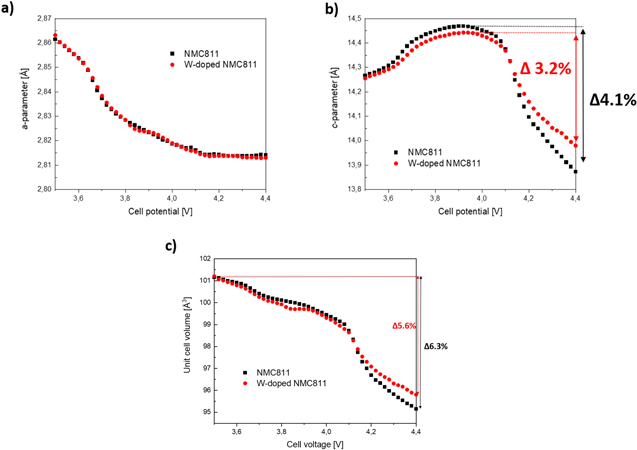
Figure 8. In-operando X-ray diffraction results - Unit cell parameter changes as a function of cell voltage for undoped reference NMC811 and W-doped sample measured in single layer pouch cells in transmission geometry. (A) a-parameter, (b) c-parameter and (c) unit cell volume are presented.
Download figure:
Standard image High-resolution imageTo get more insight on surface side reactions of the cathode active material with the electrolyte, DSC measurement were conducted. The respective results are presented in Fig. 9. The electrodes were delithiated by one charge cycle in coin-cell vs Li-metal up to 4.5 V without additional previous formation cycles. Note that both materials show similar charge capacities (comp. Figure 6c), excluding the degree of delithiation as dominating effect on the DSC results. 33 The crystallite size of W-doped NMC811 was ∼63% smaller as compared to pristine NMC811 offering higher surface area for side reactions with the electrolyte. Within the investigated temperature range, we observed the reduction of exothermic enthalpy of W-doped NMC811 by 49% to −115 J g−1 as compared to the reference material (223 J g−1). Thus, W-doped NMC811 exhibit less side reactions with the electrolyte as compared to the reference material. Furthermore, the onset shifted from 199 °C (reference) to 205 °C for W-doped NMC811. As discussed earlier, the charge compensation related suppression of Ni4+ species at the surface of the W-doped material can also lead to a decreased side reaction intensity with the electrolyte, what matches our previously discussed findings.

Figure 9. Differential scanning calorimetry results for charged electrodes for undoped reference NMC811 and W-doped NMC811.
Download figure:
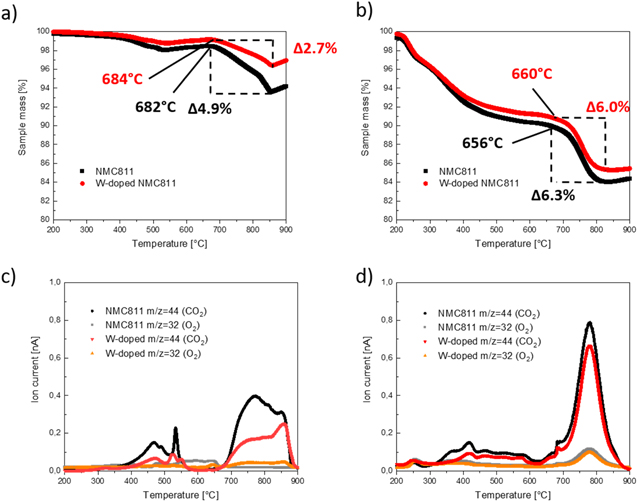
Standard image High-resolution imageTo gain more insights on the discussion of TM–O bond strength influences on structural stability, thermogravimetric analysis with mass spectrometry data on fresh and de-lithiated electrodes were carried out (Figs. 10a–10b). By TGA-MS measurements of electrodes oxygen containing species released from the host structure of the materials could be detected and quantified.
Figure 10. Thermogravimetric analysis results for (a) fresh and (b) delithiated electrodes of pristine NMC811 and W-doped NMC811 and corresponding mass spectrometry results (c) and (d) for oxygen (m/z = 32) and carbon dioxide (m/z = 44).
Download figure:
Standard image High-resolution image
For both materials, the TGA curves, and also oxygen (m/z = 32) and carbon dioxide (m/z = 44) signals, followed the same trend, displaying similar mass loss steps. For fresh electrodes (Figs. 10a and 10c), first oxygen- and carbon dioxide-related mass losses were observed in the temperature range of 350 °C to 550 °C. In the temperature range of 680 °C–855 °C, the mass loss of pristine NMC811 was 4.9 wt% and significantly higher as compared to that of the W-doped material (2.7 wt%). MS-data confirmed that this mass loss step can be attributed to oxygen and carbon dioxide evolution. Carbon dioxide is formed from released oxygen from the cathode active materials' host structure, which interacts with the conductive carbon in the sample. Two origins of carbon dioxide have to be considered, firstly from cathode active material host structure, and secondly from carbonate containing surface impurities. The melting point of Li2CO3 is at 723 °C, which matches the observed mass loss data for fresh electrodes. As shown in Fig. 4 XPS results confirm that there are the same C-containing surface impurities present on both cathode active materials. As both materials were handled and processed under the same conditions, we assume the presence of similar surface impurity contents in both samples. Additionally, W-doping should lead to increased Li-containing surface impurities due to previously discussed charge compensation when doping NMC with elements with high oxidation state. As the mass of impurities is relatively low in comparison with the mass of the cathode active material, no high impact on the results is expected. Under this assumption higher mass loss of pristine NMC811 indicates more pronounced phase transition and thus more intense oxygen loss from the host structure of the material. This supports the idea of strengthened TM–O bonds what can effectively suppress phase transition of the material resulting additionally in lower gas amount during operation of the cell. Compared to uncharged electrodes, for de-lithiated material (Figs. 10b and 10d) the main oxygen release related mass loss occur at lower temperatures (220 °C–600 °C and 660 °C–820 °C) with increased intensity, leading to mass loss values of 6.3% for reference and 6.0% for W-doped material, respectively. The shift towards lower temperatures gives further support to our assumption that surface residuals are not the dominating source of oxygen and carbon dioxide release. Testing de-lithiated electrodes with the same procedure leads to a less pronounced stabilizing effect of W-doping, indicating that for high de-lithiation levels (corresponding to 4.5 vs Li+, charge capacity of 228 mAh g−1, ∼80% de-lithiation), the suppression of the phase transition by W-doping has a negligible effect. After charging the material, the host structure is destabilized due to low remaining Li-amount on Li-site. Additionally, the Ni4+-content increases. This effect influences the results and could be the origin for similar oxygen and carbon dioxide release and similar mass loss after charging the electrodes as destabilization of the structure is more dominant then stabilization by W-doping. However, in the initial and in the de-lithiated state, the oxygen and carbon dioxide signal intensities obtained were lower for the W-doped material over the investigated temperature range, indicating less oxygen and carbon dioxide release, and subsequently less pronounced phase transitions, especially during the initial state. This proves that W-doping can improve structural stability and strengthen TM–O bonds, resulting in suppressed gas evolution.
Conclusions
This study reports a wet-impregnation synthesis method for homogenously distributed W6+ doping of spherical and dense NMC811 hydroxide precursors. After heat treatment we detected significant effects on the NMC811 crystal structure such as increased c-parameter or reduced crystallite size at higher strain values from Rietveld analysis, indicating a successful incorporation of W into the crystal structure. Further TEM-EDX, XPS and TOF-SIMS analyses revealed the species of W6+ and its homogenous distribution within the bulk, proving the absence of an exclusive surface coating or a W-concentration gradient from the surface to the center of the bulk but indicating homogenous doping of the crystal lattice. From TOF-SIMS one could suggest, that W substitutes mainly Co in the host structure. To finally prove this suggestion further, in-depth studies such as neutron-diffraction techniques would be required. Statistical data analysis of EBSD results revealed the impact of W-doping on the primary particle architecture resulting in higher tendency of radially oriented a-b planes of the primary particles, enhancing structural stability of the secondary particles. Electrochemical testing revealed improved cycling stability (capacity retention >7%) leading to higher absolute values of discharge capacity accompanied by less pronounced average voltage decay resulting in decreased overall energy loss. As expected, delayed H2-H3 phase transition was detected by dQ dV−1 plots and corresponding less intense unit cell volume changes were shown by in-operando XRD suggesting less intense structural degradation of the cathode active material by W-induced suppressed phase transition. Thus, a lower amount of fresh surface area was exposed to detrimental parasitic side reactions with the electrolyte forming a surface passivation layer on the cathode active material. Matching this, charge transfer resistance increase for W-doped material was found to be ∼4x lower compared to the undoped reference material. Supporting the overall discussion on TM–O bond strength, oxygen and carbon dioxide evolution related mass loss was detected by TGA-MS measurements to be significantly lowered by W doping, indicating stabilized structure due to increased TM–O bond strength. Furthermore, strengthened TM–O bonds can be partly responsible for the suppression and/or delay of surface phase transition and thus a relatively low amount of Ni4+ at the near surface of the active material resulting in low expressed exothermic side reaction with the electrolyte. Our detected increase in electrochemical cycling stability and in energy conversion rate for W-doped material adds further support to this. Additionally, the electrolyte side reaction intensity is lowered for W-doped NMC811 leading to a reduced exothermic enthalpy compared to the undoped reference material (>49%).
Acknowledgments
Practical work on syntheses, cell building, electrochemical testing and DSC measurements related to this work were conducted using the facilities at Zentrum für Sonnenenergie- und Wasserstoff-Forschung in Ulm, Germany. In-operando XRD and TGA-MS measurements were conducted at Volkswagen AG - Center of Excellence (Salzgitter, Germany). The authors want to thank Fraunhofer-Institut für Keramische Technologien (Dresden, Germany) for carrying out data on TEM-EDX, EBSD, XPS and TOF-SIMS. Furthermore the authors want to thank Julian Wegener for statistical analyses of EBSD raw data. This research did not receive any specific grant from funding agencies in the public, commercial, or not-for-profit sectors.
Credit Author Statement
Alexander Schmidt, Thomas Schladt, Peter Axmann, Margret Wohlfahrt-Mehrens, Mika Lindén: Supervision, Reviewing and Editing.
Supplementary data (0.4 MB, PDF)