
Abstract
Polyethylene glycol (PEG) plays an important role as an inhibitor of the electrodeposition. In this study, we investigated the potential dependence of PEG (molecular weight: 3000) adsorption and desorption processes on the gold single crystal substrate. High speed atomic force microscope (HS-AFM) was applied for observing the dynamic behaviors of the nucleation and the growth of PEG adsorption. The in situ observation was conducted at the several potentials where the cyclic voltammogram measurement showed the broad peak of the reduction current. As the applied potential became more cathodic, the adsorption morphology changed from film-like, through the sphere, to the large irregular cluster. When the potential was switched to anodic potential, HS-AFM could show the dissolution process of PEG. Finally we demonstrated the effect of the tip force by modifying the feed-back circuit of AFM.
Export citation and abstract BibTeX RIS

This is an open access article distributed under the terms of the Creative Commons Attribution 4.0 License (CC BY, http://creativecommons.org/licenses/by/4.0/), which permits unrestricted reuse of the work in any medium, provided the original work is properly cited.
The manufactures use the damascene process where defect-free and smooth deposition in the grooves is achieved. 1 However, some voids are created by the heterogeneous concentration in the trench. Therefore, some additives are employed to adjust the deposition rate. PEG is well known as a typical inhibitor. The inhibition mechanism is explained by the curvature enhanced adsorbate coverage (CEAC). 2
The adsorption model has been investigated by various approaches. 3–14 Kelly et al. assumed the PEG adsorption as a flat monolayer of rod-like molecules or as collapsed spheres. The electrochemical quartz crystal microbalance (EQCM) results suggested a monolayer of spherically packed PEG molecules on Cu substrate when chloride ions were present. 14 Walker et al. used spectroscopic ellipsometry for several substrates (Cu, Ag and Au) and reported that the PEG adsorption was clearly evident at the positive of the potential of zero charge (PZC), while the adsorption was negligible without chloride ions. 11 Thus, the chloride ions work as anchors by forming the coadsorption with PEG. In addition to chloride ions, the surface X-Ray diffraction by Golks et al. suggested the PEG adsorption on top of positively charged hydronium layers on Cu(001) single crystal, 7 when the disordered chloride layer was formed at cathodic potential close to the hydrogen evolution reaction.
Some studies using a gold substrate have been conducted to examine only PEG adsorption. Petri et al. calculated the electric double layer charge and reported that, at the noble potential, PEG was desorbed by replacing chloride ions adsorption by sulfate ones. 15 Mendez et al. discussed the adsorption model by measuring the interfacial tension. 16
Although there are a lot of works on the PEG adsorption, the mechanism is too complicate to be well understood. One of the reasons is the difficulty of direct PEG observation. The weak adsorption and non-planer shape would be barriers for the probing measurement. To the best of our knowledge, only a few papers have successfully demonstrated the PEG image by the scanning probe microscopy. 17–19 The AFM images by Jin et al. showed the flat-cone shaped clusters with a bottom diameter of several tens of nanometer, and a height of several nanometer. 18 Li et al. reported STM images of the initial stage of PEG adsorption. It was winding linear segments like the helical conformations on Au(111). 17 Fu et al. suggested that the (4 × 4) structure on Pt(111) was attributed to PEG with molecular weight of 200. 19 Moreover, they suggested that the large PEG molecules, such as PEG 4000, was adsorbed in a nonplanar configuration.
HS-AFM has been originally developed for observing the cells (proteins). 20 Therefore, it is designed to minimize the probe effect on the sample. Due to the soft contact, we have successfully observed the Cu nucleation 21,22 and nanobubble (NB) formation during water electrolysis. 23 The dynamic properties such as the Cu epitaxial growth, H2 NB coalescing and O2 NB dynamic motion are shown there.
In this study, the PEG adsorption and desorption on a gold substrate were performed potentiostatically. The dynamic behavior was observed by HS-AFM and the potential dependency on the PEG formular was investigated. During the observation, we further manipulated the probe force to examine the tip effect.
Experimental
The experimental method for HS-AFM has been described in other literature, 21 here only the main points are mentioned. The experiment was conducted using a three-electrodes system. The cell was made of polyetheretherketone with a 200 μl electrolyte reservoir. The working electrode was Au(100) single crystal (φ 3 mm, MaTeck GmbH). Before the experiment, the crystal was heated with a butane burner until it turned red color, then it was cooled in the air. This treatment was repeated for 5 min. The crystal was placed on the AFM scanner. The counter and reference electrodes were platinum wires (φ 3 mm, Nilaco Corp.). They were used after removing the organic impurity in a piranha solution and ultrasonic cleaning in a ultra pure water (18.2 MΩ, Merck).
The electrolyte was the acidic solution (50 mM H2SO4 + 1.2 mM HCl). PEG (FUJIFILM Wako Pure Chemical Corp.) was purchased and the average molecular weight was 3000. The concentration was adjusted to 300 ppm in the electrolyte. The 200 μl electrolyte was introduced into the electrolyte reservoir with the micropipette. The electrochemical measurements were carried out in the HS-AFM cell. The cyclic voltammetry (CV) and constant potential electrolysis was performed by the electrochemical measurement system (HZ-7000, Hokuto Denko Corp.). The experiment was conducted under room temperature.
The HS-AFM was developed by Research Institute of Biomolecule Metrology. The observation area was 500–1000 nm square, and the scanning speed was 0.5–1 Hz (frame s−1). The silicon ultra-short cantilever (USC-F1.2-k0.15, NanoWorld) was used. The resonance frequency was 1.2 MHz and the force constant was 0.15 N m−1.
Results and Discussion
CV measurement
The CV measurements were performed at the scanning rate of 0.02 V s−1. They were repeated until the stable waveforms were obtained. The results without PEG (blue line) and with PEG (red line) are shown in Fig. 1. The paired peaks were observed at potentials around 0.5 V in anode scan and 0.3 V in cathode one. They appeared in both electrolytes. This peak is probably attributed to the electrochemical oxidation/reduction of the gold substrate. 24 At the potential close to 1.0 V, the oxidation current increased rapidly and oxygen evolution occurred. On the other hand, the reduction current increased around −0.75 V, and hydrogen evolution occurred at less than −1.0 V. In the solution with PEG, the onset potential shifted more noble direction slightly. The broad cathodic peak was detected at −0.6 V∼−1.0 V in the cathode scan, which would be attributed to the PEG addition.

Figure 1. Cyclic voltammograms of the Au(100) electrode in 50 mM H2SO4 + 1.2 mM HCl solution (a) without and (b) with PEG3000 additives. The potential scan rate was 0.02 V s−1.
Download figure:
Standard image High-resolution imagePotential Effect
The constant potential electrolysis was conducted at −0.4 V, −0.45 V, −0.65 V and −0.75 V, respectively. The typical images are shown in Fig. 2 and the movies are presented in the supplemental section.

Figure 2. In-situ AFM images of PEG adsorption on Au(100) in 50 mM H2SO4 + 1.2 mM HCl solution. The images were obtained at (a) −0.4 V, (b) −0.45 V, (c) −0.65 V, and (d) −0.75 V.
Download figure:
Standard image High-resolution imagePEG was adsorbed at each step side as soon as applying the potential of −0.4 V. The PEG grew laterally and formed the smooth film (Fig. 2a). The second layer was occasionally observed on the old first layer (as indicated by circle). The growth was layer-by-layer. The movie (Video S1) demonstrated clearly that the line-like structure was formed initially from the step edges, and they covered the substrate with the lateral growth rate of about 3.9 nm s−1. The growth rate was much slower than the growth of copper deposits (100 nm s−1). 21,22 According to the cross-sectional profile, the layer thickness was approximately 2.5 nm. Since the film surface was flat, the picture was less noisy (Fig. 2a). In contrast, the rough adsorbates were deposited at more cathodic potential. The images (Figs. 2b–2d) appeared noisier probably because the probe was likely to bump the surface.
At the potential of −0.45 V, PEG was preferentially adsorbed along the step (Fig. 2b). The size of the adsorbate was about 80 nm in diameter and 10 nm in height, unlike the layer form at −0.4 V (Fig. 2a). The PEG nuclei were not observed on the terrace during the electrolysis (Video S2). When the more cathodic potential of −0.65 V was applied, many collapsed spherical adsorbates were observed over the whole terrace (Fig. 2c). The size was about 20 nm in the diameter and 6 nm in the height. They were nucleated on whole terrace and grown individually without coalescing any neighbors, as seen in the movie (Video S3). The particles gradually slowed the growth rate with passing the electrolysis time.
At −0.75 V close to the onset potential of the hydrogen evolution, PEG aggregated and formed the large irregular cluster (Fig. 2d). The large clusters seemed to emerge from the substrate. The diameter did not depend on the electrolysis time, while the heigh increased up to about 10 nm. The clusters were inhomogeneously scattered on the surface. Before starting the electrolysis, there were two adsorbates (probably due to impurities) at the center of the screen, as indicated by arrows. Interestingly one was pinned and swallowed by the PEG cluster, while the other was rolling on the cluster (Video S4). Some black areas between the clusters were identified in the image. The height profile at the area indicated that the substrate was uncovered without any adsorptions. This may be explained by the desorption of Cl− which acts as an anchor between PEG and substrate. 11
The dissolution behavior of the adsorbate at −0.75 V could be examined by switching the potential to 0.2 V. The dissolution did not occur at the interface between the adsorbate and the substrate, but rather from the entire surface of the adsorbate (Video S5). Thus, the adsorbate did not strip off, 10 but shrank uniformly. The PEG cluster was entangled with each other by intermolecular forces such as the hydrophilic interactions. Thus, the noble potential would influence the hydration state between the individual PEG molecules.
Tip Effect
Tip of HS-AFM is excited with a free amplitude in the resonance frequency. The oscillated amplitude is influenced by interatomic interaction from the sample surface. Feedback circuit built in HS-AFM controls Z-piezo voltage (reference voltage; RV) and modifies the tip amplitude. The RV is usually set at around the free amplitude value because the tip touches the surface with low force (Fig. 3a). In the present study, we adjusted RV to lower value than free amplitude. Therefore, the tip contacts the surface strongly (Fig. 3b) and can scratch the surface through the scanning.

Figure 3. Schematic illustration of the excited HS-AFM cantilever (a) with nearly free amplitude and (b) smaller one.
Download figure:
Standard image High-resolution imageWe conducted the potentiostatic electrolysis at −0.7 V for 3 min. After that, we set the open circuit potential and started HS-AFM observation. The initial image shows many fine spheres on the entire surface (Fig. 4a). The PEG size was about 10 ∼ 80 nm in diameter and 6 nm in height. The size distribution was large. The gaps between the adsorbates were unfilled, which suggested the individual growth without any agglomeration.
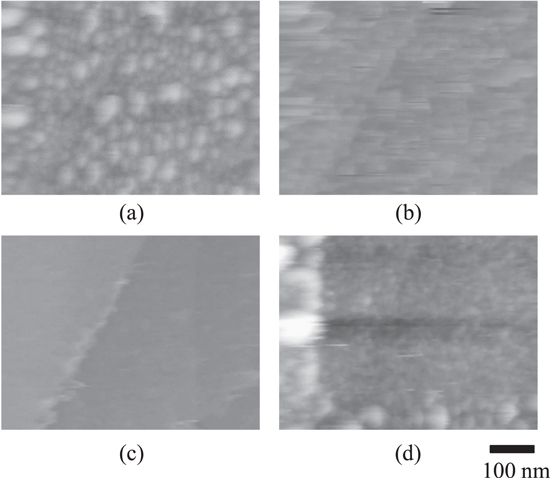
Figure 4. Selected in situ AFM images of PEG adsorption on Au(100) in 50 mM H2SO4 + 1.2 mM HCl solution during the modification of the tip contact force. The images were obtained at (a) −0.7 V with normal tip amplitude, (b) and (c) open circuit potential with increasing the tip force, and (d) −0.7 V with normal tip amplitude.
Download figure:
Standard image High-resolution imageThe tip contact force on the sample was modified during the observation. As soon as increasing the force, the spike-like noises appeared at some points where the probe bounced against the surface (Fig. 4b). The image contrast became unclear, but the individual shape was still recognizable as shown in Fig. 4a.
After noisy images for a short moment (Video S6), the adsorbates disappeared. Interestingly, the columnar adsorbate was observed along the top of the step edge and fluctuated for a short moment. The size of the was about 3 nm in diameter and 400 nm in length (Fig. 4c). It oscillated and dissolved from both line ends. The removal rate was about 1 nm s−1. At 15 s after increasing the tip force, the adsorbates could be removed.
The contact force, P, was estimated by the distortion of the tip amplitude. Supposing that the vibration amplitude is smaller by ΔV than the free vibration one, the force is calculated from the Hooke's law, P = ΔV × A × K, where K is spring constant (0.15 N m−1) and A is sensor coefficient (12 nm V−1). In this experiment, the maximum probe force was about 0.54 nN.
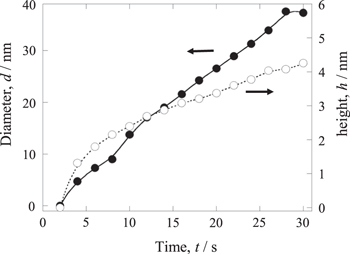
Then the contact force was reduced by returning the initial RV value. The remaining adsorbates was seen in the left and lower part of the screen in the video, where the probe had not scanned at the previous procedure. When the potential of −0.7 V was applied again, many small grains were nucleated on the smooth terrace (Fig. 4d). The nucleation site was not related to the step. The average diameter size increased from 10 nm to 40 nm, while the height approached about 4 nm during the restarted electrolysis (Fig. 5). The growth was faster in the lateral than in the vertical direction, and the shape became flatted.
Figure 5. Transient behavior of the diameter (•) and height (○) of PEG adsorption on the area cleaned by the tip contact. The potential of −0.7 V was applied.
Download figure:
Standard image High-resolution image
Conclusions
The PEG adsorption and desorption on Au(111) were conducted in sulfuric acid electrolyte containing chloride ion. The dynamic processes were in situ observed by HS-AFM. When the potential was scanned in the cathodic direction, the CV wave showed a broad reduction current peak from −0.6 V (vs Pt reference electrode) close to the onset potential of the hydrogen evolution reaction. HS-AFM observation was applied at the several potentials in the broad region.
The morphology of the PEG adsorption was significantly changed by the potential. It changed from film to collapsed sphere, following the agglomerates cluster when the potential become more cathode. Corresponding to the adsorption shape, PEG evolution sites varied in steps, total and partial terrace. The agglomerate cluster formed at −0.75 became smaller uniformly and dissolved completely, when the potential was jumped to 0.2 V.
The threshold of the feedback circuit was adjusted to increase the probe force against the substrate. The adsorbates on the surface could be removed at the force of 0.54 nN. When −0.7 V was applied, the PEG re-nucleation occurred on the cleaned terrace and its growth could be observed.
Acknowledgments
The authors are grateful for financial support from the Ministry of Education, Culture, Sports, Science and Technology (Project No. 22H01836).