

Abstract
A key for the market penetration of large-scale and high energy All-Solid-State Batteries (ASSBs) are sheet-type cell components. Herein, we report a slurry-based process to obtain free-standing solid electrolyte (SE)/binder composite sheets as ASSB separators. We investigate three different sulfidic solid electrolyte systems (Li6PS5Cl, Li7P3S11 and Li10SnP2S12) in combination with a hydrogenated nitrile butadiene rubber (HNBR). By means of electrochemical impedance spectroscopy (EIS), the influence of separator composition and processing on the ionic sheet conductivity is evaluated. Independent of the solid electrolyte material, a reduction by a factor of three compared to the pristine powder conductivity at 70 MPa operation pressure and by a factor of eight compared to the maximum powder conductivity is observed. This can be attributed to the addition of the ionically isolating binder, which however is necessary for the production of freestanding sheets. We show the beneficial effect of pre-compressing the sheets to little porosity values on the apparent sheet conductivity. Lastly, we investigate and decouple the influence of fabrication and operating cell pressure on the produced separator sheets.
Export citation and abstract BibTeX RIS

This is an open access article distributed under the terms of the Creative Commons Attribution 4.0 License (CC BY, http://creativecommons.org/licenses/by/4.0/), which permits unrestricted reuse of the work in any medium, provided the original work is properly cited.
All-solid-state batteries (ASSBs) are considered as up-and-coming candidates for the next generation of energy storage systems, e.g., for electric vehicles and mobile devices. Replacing the inflammable organic electrolyte in conventional Li-ion batteries (LIBs) by a non-flammable solid electrolyte (SE) promises to increase battery safety, allow for higher gravimetric and volumetric energy densities as well as higher fast-charging capability. 1,2
In general, three different types of ASSB cells can be distinguished, namely thin-film, pellet-type, or sheet-type cells. 3–5 Thin-film batteries are mainly used for consumer electronics that require little overall energy or as model systems to study the storage mechanisms and the kinetics of ASSB materials. 5 The applicability of thin-film batteries to high-energy batteries for battery electric vehicles (BEVs) is limited due to their low energy storage capacity and their laborious production processes. 6 ASSB cells featuring pellet-type separators with thicknesses of several hundreds of microns are intensively studied in terms of fundamental research, benchmarking new electrolyte materials, analyzing degradation phenomena upon cycling, or evaluating interfacial properties. Despite of being widely used in ASSB research, pellet-type cells and separators are generally limited to small-scale laboratory cells, as large-format pellets cannot be produced in a continuous process. Furthermore, in order to be competitive or superior to state-of-the-art LIBs, the thickness of the solid electrolyte separator in ASSBs should be substantially less than 100 μm. 7 Thin and large-format solid electrolyte based separators can in principle be produced by slurry-based processes, that would also allow for straightforward production scale-up. In recent years, more and more focus has been placed on the preparation of sheet-type separators, investigating appropriate solvents and binders for wet-processed SE/binder composites. 4,7–14
Among the various classes of inorganic solid electrolytes, sulfidic electrolytes are promising candidates for the integration into sheet-type large-format ASSBs. Compared to other SE materials, sulfidic electrolytes offer higher room temperature Li-ion conductivity and a relatively low interfacial resistance, due to their softness and ductility. 6,15–19 Their favorable mechanical properties allow for the preparation of free-standing SE/binder separator sheets and a straightforward densification by calendering, which can be integrated into a continuous roll-to-roll process. Low residual porosities are desired to increase energy densities and to maximize lithium ion conductivity. 20 Furthermore, at least for oxide based solid-electrolytes, low residual porosities are reported to allow for higher current densities prior to separator shorting by lithium dendrites. 21,22
In this work, we present a comparative solid electrolyte study for wet-processed SE/binder separator sheets using the sulfidic electrolytes Li6PS5Cl (also referred to as LPSCl), Li7P3S11 (also referred to as LPS711), or Li10SnP2S12 (also referred to as LSPS) in combination with a hydrogenated nitrile butadiene rubber (HNBR) binder. We first perform a through morphological analysis of the resulting separator sheets and then evaluate the influence of the binder content on the ionic conductivity of the separator sheets. Lastly, we show the importance and the impact of the fabrication as well as operation pressure on the ionic conductivity of the SE/HNBR separator sheets.
Experimental
Materials
The handling of all materials and all processing steps were conducted inside an Ar filled glovebox (O2 < 0.1 ppm, H2O < 1 ppm, MBraun, Germany), unless described differently. The solid electrolytes Li6PS5Cl (LPSCl) and Li7P3S11 (LPS711) were purchased from All Solids (China), while Li10SnP2S12 (LSPS) was purchased from NEI Corporation (USA); all SEs were used without further purification. Hydrogenated nitrile butadiene rubber (HNBR, 5.5 × 10⁵ g · mol−1, 17 wt% acetonitrile, < 1% residual double bonds) was provided by Arlanxeo (Netherlands). The HNBR binder was dried at 70 °C under dynamic vacuum for 72 h in a drying oven (Büchi B-585, Büchi, Switzerland). For all experiments, a 5 wt% HNBR stock solution in toluene was used, which was kept under continuous stirring. Toluene (anhydrous) was purchased from Merck Millipore (Germany) and dried over a molecular sieve (pore size 3 Å, Merck Millipore, Germany) for at least 24 h. The water content of the toluene was determined by Karl-Fischer-Titration (Titro Line KF trace, Schott Instruments GmbH, Germany) to be < 1 ppm.
Processing of solid electrolyte/binder-sheets
The SE/HNBR-sheets were prepared by a slurry-based process using a dissolver (Dispermat LC30, VMA-Getzmann, Germany). For this, all components, i.e., the SE powder, the 5 wt% stock solution of HNBR in toluene, and a defined additional amount of toluene were put together in an HDPE beaker (12 ml Thinky beaker, C3 Prozess- und Analysetechnik GmbH, Germany) in the respective weight ratios, depending on the desired binder content according to Table I. All batches were prepared with a total amount of 2 g of solids, which is defined as the sum of the mass of SE and HNBR. The solid content in the slurry was adjusted to 35%–50% depending on the binder content in order to obtain a suitable slurry viscosity.
Table I. Overview and composition of the prepared SE/HNBR sheets for the different SEs (SE = Li6PS5Cl; Li7P3S11; Li10SnP2S12) with varying HBNR binder content, whereby the HBNR weight content (χHNBR, in [wt%]) for the different SEs was adjusted to obtain equal volume percentages of HBNR (φHNBR, in [vol%]). A binder content of 0 wt% corresponds to the pure SE powder, which was used as a pellet and therefore was not wet-processed. The LSPS coating with a volumetric binder content of 1.7% is marked with an *, as this coating could not be prepared.
| Li6PS5Cl (LPSCl) | Li7P3S11 (LPS711) | Li10SnP2S12 (LSPS) | |||
|---|---|---|---|---|---|
| χHNBR [wt%] | φHNBR [vol%] | χHNBR [wt%] | φHNBR [vol%] | χHNBR [wt%] | φHNBR [vol%] |
| 0.0 | 0.0 | 0.0 | 0.0 | 0.0 | 0.0 |
| 1.0 | 1.7 | 0.8 | 1.7 | 0.7* | 1.7* |
| 2.0 | 3.4 | 1.7 | 3.4 | 1.5 | 3.4 |
| 3.5 | 5.8 | 2.9 | 5.8 | 2.6 | 5.8 |
| 5.0 | 8.2 | 4.2 | 8.2 | 3.7 | 8.2 |
| 7.0 | 11.4 | 5.9 | 11.4 | 5.2 | 11.4 |
| 10.0 | 16.0 | 8.4 | 16.0 | 7.5 | 16.0 |
In the lid of the HDPE beaker, a centered 16 mm hole was punched in order to pass through the rotating shaft of the dissolver. The mixture was then stirred using a 20 mm dissolver disk (stainless steel, VMA-Getzmann) according to the following sequential mixing procedure (adapted to that reported by Riphaus et al. 7 ): 500 rpm for 1 min, 1000 rpm for 1 min, 2000 rpm for 2 min, 5000 rpm for 5 min, and 10,000 rpm for 11 min. The long-duration final step at 10000 rpm serves to break up agglomerates and thoroughly disperse the particles, resulting in a homogeneous slurry. The slurry was coated onto a siliconized polyester foil (PPI Adhesive Products GmbH, Germany) by means of the doctor blade technique, using a 400 μm gap-bar (ERICHSEN, Germany). The deposited films were dried at room temperature for at least 12 h. Prior to further experiments, the sheets or punched samples were dried at 70 °C under dynamic vacuum for at least 16 h. The final free-standing separator sheets had a dry-film thickness of roughly 120 μm, as measured by a thickness gauge (see below).
Initially, LPSCl/HNBR coatings with different gravimetric HNBR binder contents (xHNBR) were prepared (see left-most column in Table I). In order to provide a more rigorous comparison of the compression-dependent porosity and conductivity of separators made with different solid electrolytes, separator sheets with identical binder volume fractions (φHNBR) rather than binder mass fractions were prepared. Therefore, the mass fractions used for the LPSCl/HNBR separator sheets were first converted into binder volume fractions (φHNBR) via Eq. 1:

with ρ representing the bulk densities of the different materials, which were taken from the product specification sheets (HNBR: 0.96 g cm−3; LPSCl: 1.64 g cm−3; LPS11: 1.98 g cm−3; LSPS: 2.25 g cm−3). Subsequently, coatings with the same volumetric binder contents using LPS711 and LSPS were prepared (see Table I; note that the LSPS/HNBR coating with a binder content of 1.7 vol% could not be prepared, as no suitable slurry viscosity for a good coating could be obtained).
Porosity determination
Free-standing samples of the separators were punched with an 8 mm punch (Rennsteig, Germany) and their weight (Entris II Sartorius, Germany) and thickness (micrometer screw gauge, Mitutoyo, Japan, with an error of ± 2 μm) were measured, either in its uncompressed or compressed state. From the measured areal weight of the separator coating (Lsep) and from the measured thickness (tsep), the void volume fraction of the separator sheet (ε) was determined, using the above given bulk densities of the HNBR binder and the respective solid electrolytes:

The thus determined porosity of the uncompressed separator sheets varies between 50%–60%.
For separator densification at pressures between 100–980 MPa, an 8 mm pressing tool (Lab Club, Germany) and a manual hydraulic press (Atlas 15 T, Specac, UK) were used, pressing several (typically 3) stacked-up separator sheets for 5 min, unless described differently. For densification at pressures between 20–70 MPa, the spring cell setup, which is later described in detail, was used. The compressed thickness of the separator sheets for use in Eq. 2 was determined by a micrometer crew gauge (Mitutoyo, Japan), with an approximate error of ±2 μm. The measured compressed thicknesses ranged between roughly 210–290 μm.
Scanning electron microscopy (SEM) and (EDX)
The scanning electron microscopy (SEM) images were acquired using a JSM-IT200 InTouchScope™ (JEOL) field emission SEM at 15 kV with a multi segmental secondary electron detector. To avoid reactions of the sulfidic electrolyte with ambient air, the samples were prepared in an argon-filled glovebox, transferred under inert atmosphere into a dry-room using a Büchi oven tube (B-585, Büchi Labortechnik AG, Switzerland), and from there were transferred into the SEM that was located in the dry-room (the sample exposure time to the dry-room atmosphere (dew point < −25°) was < 1 min). To determine the binder distribution, EDX-mappings were performed at an incident electron beam of 12 kV.
Cross-section polishing
Cross-sections were prepared by argon ion beam polishing, using a cross-section polisher of the type IB-19530CP (JEOL, Japan). An 8 mm disc was punched from the dried SE/HNBR-sheet, fixed with copper tape (PPI Adhesive Products, Ireland) in the sample holder, and then inertly transferred into the device using an inert transfer shuttle (LB-11620TVCA, JEOL Japan) under argon atmosphere. It was polished at 25 °C first for 1 h at 6 kV and then 1 h with 4 kV acceleration voltage.
Effect of toluene exposure on the SE
To investigate the influence of the exposure of the solid electrolyte to the toluene solvent on its (surface) composition and ionic conductivity, toluene was added to the pristine Li6PS5Cl (LPSCl) powder, preparing dispersions with a solid content of 40%. For short term treatments, the LSPCl powder was dispersed in an HDPE beaker using a dissolver, analogous to the procedure used for preparing SE/HNBR separator sheets. For long-term treatments, the obtained dispersions were stirred for 48 h in the glovebox using a glas vial and magnetic stirring bar. Afterwards, the solvent was evaporated under dynamic vacuum at room temperature for 3 h using a small vacuum pump, which was connected to a sealed SCHOTT®-glas in the glovebox. For the complete removal of the solvent, the materials were dried under dynamic vacuum at 70 °C using a Büchi oven (B-585, Büchi Labortechnik AG, Switzerland) for at least 12 h to obtain the toluene-treated LSPCl powders.
Raman spectroscopy
For Raman spectroscopy analysis, the pristine and the toluene exposed LPSCl powder as well as a final LPSCl/HNBR separator sheet were placed onto a microscopy glass slide and sealed with adhesive-coated Kapton® tape in an argon-filled glovebox to prevent reactions with ambient air and humidity. The measurements were performed at room temperature by focusing the incoming laser beam through the glass slide, using a Renishaw inVia Reflex Raman System (Germany) equipped with a 532 nm excitation laser (Renishaw RL532C, Class 3B) set to a laser power of 2 mW. An integration time of 10 s and an averaging of five subsequently recorded spectra was used. Raman spectra in the range of 47–1548 cm−1 were recorded with a spectral resolution of 3–5 cm−1. The obtained data were processed using the software Renishaw WiRE™.
X-ray powder diffraction (XRD)
Diffractograms were collected at room temperature on a STOE STADI P diffractometer (STOE, Germany) in transmission mode in the 2θ range of 10°–90°, using Mo-Kα1 radiation (0.7093 Å, 50 kV, 40 mA), a Ge(111)-monochromator, and a Dectris Mythen 1 K detector (step size 0.015, integration time/step 150 s). The pristine and the toluene exposed LPSCl powder were measured in airtight sealed 0.5 mm borosilicate capillaries, while a final LSPSCl/HNBR separator sheet was measured in a rotating flat-bed sample holder sealed with Kapton® foil. Raw data were processed with WinXPOW, version 3.0.2.1 software.
X-ray photoelectron spectroscopy (XPS)
The surface analysis of the as-received LPSCl powder, long- and short-term toluene-treated LPSCl powder, and the final LPSCl/HNBR separator sheet was carried out by X-ray photoelectron spectroscopy (Axis, Supra, Kratos, UK). The powders and the LPSCl/HNBR separator sheet were pressed to pellets and mounted on a stainless steel sample holder. All prepared samples were transferred into the XPS antechamber using an inert transfer shuttle under Ar atmosphere. The samples were kept in the antechamber until a pressure of ≈10−8 Torr was reached, and afterwards transferred to the sample analysis chamber, where the pressure was always kept at ≈10−9 Torr during the entire measurement. Sample irradiation was carried out with monochromatic Al Kα radiation (1486.6 eV), using an emission current of 15 mA. Survey spectra were recorded for all samples with a stepsize of 0.5 eV and a pass energy (PE) of 160 eV. For high-resolution spectra, a stepsize of 0.05 eV and a pass energy of 15 eV were chosen. All recorded spectra were calibrated to the adventitious carbon peak with a binding energy (BE) of 284.8 eV. For data analysis, the CasaXPS software (version 2.3.23, Casa Software Ltd.) was used. After subtraction of a Shirley background, the spectra were fitted using a mixture of a Lorentzian (30%) and Gaussian (70%) shape function, considering the binding energy and full-width-at-half-maximum (FWHM) constraints listed in Table II.
Table II. XPS peak fitting parameters used for the identification and quantification of the different surface species of the pristine and the toluene-exposed LPSCl powders as well as of the final LPSCL/HNBR separator sheet. The ratio between S2p3/2 and S 2p1/2 was fixed at 2:1.
| element/region | assigned species | binding energy [eV] (constrained range) | FWHM [eV] (constrained range) |
|---|---|---|---|
| carbon C 1 s | "adventitious carbon" | 284.8 (fixed) | 1.0–1.3 |
| sulfur S 2p | "PS4" | S 2p3/2: 161.3 (±0.1) | 1.0–1.3 |
| S 2p1/2: S2p3/2 + 1.2 | 1.0–1.3 | ||
| "Sulfide S2−" | S 2p3/2: 160.0 (±0.1) | 1.0–1.3 | |
| S 2p1/2: S2p3/2 + 1.2 | 1.0–1.3 |
Newly developed ASSB test cell design and cell assembly
In order to investigate solid-state electrolytes and all-solid-state batteries, a special cell setup is required that is hermetically sealed and that allows the defined and, ideally, variable application of different compressions on the cell stack. Unfortunately, to the best of our knowledge, there is no commonly and widely used cell format commercially available at the moment. Only some specialized cell hardware is available (e.g. by rhd instruments and sphere energy), but owing to its cost, it has not yet been established as a standardized cell format, such e.g. coin cells or Swagelok® T-cells have been for conventional lithium-ion battery research. For this reason, various research groups have come up with individual solutions for their ASSB research. 2,20
In our group, we have developed a new in-house designed spring-cell setup that is hermetically sealed and that allows for the application of a well-defined variable compression of the cell stack in the range of 20–100 MPa. This cell design is depicted in Fig. 1, consisting of two main parts: the cell body (Fig. 1b), which contains the cell stack, and the cell casing (Fig. 1a), which serves to apply the desired compression on the cell stack via a compression spring. At first, the sample is placed inside a PEEK (polyetheretherketone) tube with an inner diameter of 8.0 mm (yellow colored in Fig. 1b) that is located in the stainless steel cell body, and contacted by hardened stainless steel dies with a diameter of 8.0 mm gray colored) and a hardened stainless steel piston that transfers the compression spring force onto the cell stack. Then, the cell body is inserted into the cell casing and sealed to the stainless steel bellows (10 mm inner diameter; Metallic Flex GmbH, Germany) with a 50 μm PTFE (polytetrafluoroethylene) flat-seal (white colored; Angst+Pfister AG, Switzerland), which at the same time electrically insulates the stainless steel bellows from the cell body. The PTFE flat-seal is compressed by a special-made stub at the lower end of the bellows, which is fixed to the cell body by six screws. At the upper end, the bellows is mounted to the cell casing via a knife-edge seal with a copper gasket, ensuring a completely gas-tight connection.
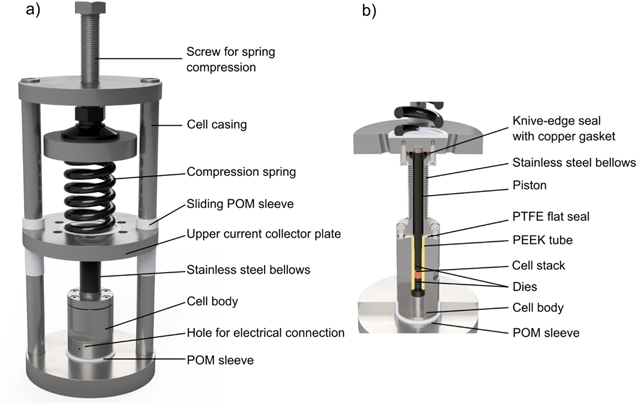
Figure 1. Hermetically sealed spring-cell setup for ASSB performance and impedance measurements under defined and variable compression of the cell stack between 20–100 MPa. (a) Cell casing (outer frame) to apply the desired cell stack compression by adjusting the height of a compression spring. The stainless steel bellows are sealed at their upper end by a knife-edge flange to the upper current collector plate and at their lower end to the stainless steel cell body, using an electrically insulating PTFE flat-seal. Electrical connection to the cell stack is made by the small holes placed in the lower part of the cell body (see figure) and in the upper current collector plate (not shown). The cell body is electrically isolated from the cell casing by a POM sleeve (shown in white); it is also electrically insulated from the casing by two sliding POM sleeves. The cell stack is contacted via hardened stainless steel dies and a piston placed inside the PEEK tube. (b) The cross-sectional illustration of the cell body and the stainless steel bellows shows the location of the cell stack (orange colored), the 8.0 mm diameter hardened stainless steel dies gray colored), the 8.0 mm inner diameter PEEK tube (yellow colored), the PTFE flat-seal (white colored) against the bellows, and the stainless steel piston that transfers the force from the compression spring onto the cell stack (note that the view is rotated by 90° in comparison to Fig. 1a). The cell has an overall dimension of a height of ≈31 cm and an outer diameter of ≈12 cm.
Download figure:
Standard image High-resolution imageAs illustrated in Fig. 1a, the operating cell pressure is applied by the defined compression of the compression spring (47 mm outer diameter, 23 mm uncompressed height, and compression rating of 254 N mm−1; LHL 200 C 02, Lee Spring GmbH, Germany) with a screw that allows to adjust the length and thus the force of the spring, using appropriately sized spacers. Thereby, the applicable cell stack compression can be controlled between 20–100 MPa. A potentiostat can be connected to the cell by inserting the cable plugs into small holes drilled into the lower part of the cell body and the upper current collector plate. At several points, the cell casing is electrically insulated from the cell body by POM (polyoxymethelene) insulations, which are displayed in Fig. 1a by a white color. The stray capacitance of this cell was estimated to be ≈8.1 · 10−11 F (based on the dimension of the various metal/insulator/metal interfaces) and is in reasonably good agreement with the experimentally determined capacitance of ≈1.6 · 10−11 F. The latter value is at least three orders of magnitude lower than the values measured for the samples investigated here, so that the stray capacitance of the setup does not affect the results of our impedance analysis of the separator sheets. The internal resistance of the cell was determined to <1Ω.
In addition to the cell displayed in Fig. 1, a slightly modified setup thereof was used for impedance measurements with an operation pressure poper > 70 MPa. For this, only the cell body together with the cell interior (PEEK tube and dies) was used without the cell casing and equipped with a special piston, shown in Fig. A·1 of the Appendix. Inside an Ar-filled glove box, this cell configuration was put into a hydraulic press (Atlas 15 T, Specac, UK), and electrically insulated from the press by putting a thin polyimide foil between the cell body and the press and between the piston and the press. The applied pressure on cell sell stack is calculated from the compressed area (0.503 cm2) and the manually adjusted press tonnage in units of tons. Thereby, the pressure could be set within a range of 100–590 MPa (0.5–3 tons) with an accuracy of ±20 MPa, which results from the accuracy of the pressure gauge of the device. Higher pressures could not be applied to the cell shown in Fig. 1, as deformation of some cell parts at pressures > 590 MPa was observed (note that pressures up to 1000 MPa could be used for the setup shown in Fig. A·1). During the impedance measurements, the pressure is held constant within the described accuracy. In order to validate this cell setup, the conductivity of LPSCl/HNBR-sheets were determined at an operation pressure of poper = 100 MPa with both cell setups (i.e., at the upper limit of the spring-cell and the lower limit of the cell in the hydraulic press), yielding the same values within roughly ±6%. This proves that the modified cell setup is a valid option for impedance measurements under high operation pressures, whereby it is however restricted to measurements at room temperature (i.e., the temperature inside the glovebox).
To conduct impedance measurements, separator sheet samples with a diameter of 8 mm were punched out, and three sheets were stacked for one measurement inside the cell body. After assembly of the cell, the compression on the cell stack was set to the desired value (between 20 and 70 MPa) by compressing a spring. Afterwards the cell was taken out of the glovebox and placed in a temperature chamber (KB53, BINDER, Germany) that was set to 25 °C. Impedance measurements at pressures higher than 70 MPa were conducted in the glovebox at a temperature of 25 °C ± 1 °C. For this, the above described different measurement setup with the hydraulic press was used.Note that for the pre-compression of sheet compressions up to 1000 MPa in course of the porosity determination was possible by using a different pressing tool, described in the section of porosity determination, which however did not allow for impedance measurements.
Potentiostatic electrochemical impedance spectroscopy (PEIS)
Measurements outside the glovebox were performed using a VSP-300 potentiostat (BioLogic, France), whereas a SP-300 device (BioLogic, France) was used for measurements inside the glovebox. Prior to impedance measurements, the cell was left to rest for 1 h in order to allow for thermal and mechanical equilibration. Impedance spectra were recorded in a frequency range from 7 MHz to 100 mHz and a potential amplitude of ±10 mV. Data were treated using the software EC-Lab (V 11.36). For acquiring impedance measurements, the following procedure was followed: First, the fabrication pressure was applied in the cell body using the setup displayed in Fig. A·1 in combination with a hydraulic press. During this step at the fabrication pressure, the sample can adapt for small irregularities of the dies. Then, after the initial compression, the entire cell body was transferred into the cell casing of the cell setup displayed in Fig. 1, and the operating pressure was set by compression of the spring. Here it must be noted that during the transfer of the cell body from the press into the cell casing, the dies which are in direct contact with the sample remained in the exact same position and that only the piston is changed from the setup in Fig. A·1 to that in Fig. 1. In this way, resistances due to poor contacting of the sample and the dies are minimized.
Results and Discussion
The following sections will present the morphological characteristics of the SE materials and of the resulting SE/HNBR separators, the interaction of the toluene solvent with sulfidic SEs (exemplarily for LPSCl), the achievable porosities of SE/HNBR separators, and the effect of the composition and the compression of SE/HNBR separators on their ionic conductivity. The three SEs represent the three commonly used types of sulfidic SEs: LPSCl with argyrodite structure, LPS711 as a glass-ceramic and LSPS as an LGPS-derivative from the class of thio-LISICONs. The values for their electrochemical properties such as lithium ionic conductivity and the electrochemical stability window are reasonably similar. 23,24
Morphology and binder distribution
To assess the morphology of the SE/HNBR separators prepared by the slurry-processing route, the solid electrolytes and the corresponding SE/HNBR separator sheets were characterized by means of SEM and EDX. Figure 2 shows the top-view SEM images of the different SE powders. First examining the LPSCl powder and separator, Fig. 2a shows that the pristine LPSCl particles are somewhat rounded, with an approximate average particle size on the order of ≈5 μm. After the slurry processing with toluene to prepare the LPSCl/HNBR separator sheet, the SE particle size in the separator sheet seems unchanged and has a similar morphology as the pristine SE powder (see Fig. 2d). The visually open structure of the separator sheet reflects its high porosity of ≈50% (determined by Eq. 2). Figure 2g displays the mapping of the carbon EDX signal that exclusively originates from the HNBR binder (8.2 vol%). Thus, the distribution of the HNBR in the composite sheet is reflected by the carbon distribution map, which gives a qualitative indication that the HNBR binder distribution within the LPSCl/HNBR sheet is reasonably homogeneous, suggesting that the slurry mixing procedure is effective.
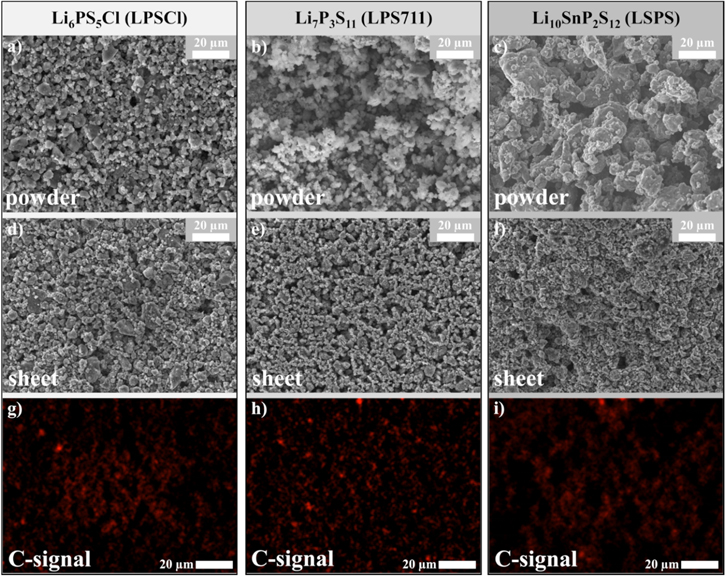
Figure 2. Top-view SEM images of the pristine SE powders (a) Li6PS5Cl (LPSCl), (b) Li7P3S11 (LPS711), (c) Li10SnP2S12 (LSPS) and, (d)–(f), of the thereof prepared separator sheets with 8.2 vol% HNBR. (g)–(i) Corresponding EDX-maps of the C-signal as marker for the binder distribution within the prepared separator sheets.
Download figure:
Standard image High-resolution imageFor the composite system LPS711/HNBR (Figs. 2b, 2e, and 2h), similar observations can be made. The size of pristine LPS711 particles is also on the order of ≈5 μm, without any bigger agglomerates, and the LPS711 particle morphology is not affected by the mixing procedure. This is different for the pristine LSPS powder (Fig. 2c), which next to small particles of also ≈5 μm shows a large fraction of bigger agglomerates with 20 μm and more in size. However, the slurry processing appears to break up these large LSPS agglomerates, resulting in a similar LSPS/HNBR separator sheet morphology (Fig. 2f) that was observed for the LPSCl/HNBR and the LPS711/HNBR separator sheets. Reasons for size reduction of the LSPS particles could be due to the HNBR binder acting as a surfactant or the high stirring step in the mixing procedure. However, as the reference experiment without HNBR present, meaning with only LSPS and solvent, also leads to a break-up of the agglomerates, we believe this is entirely due to mixing at high revolutions.
Figure 3 displays the SEM cross-section images of the uncompressed LPSCl/HNBR separator sheets with 1.7, 8.2, and, 16.0 vol% HNBR in combination with the corresponding carbon EDX-mapping. For the lowest binder content, a homogenous distribution without any binder accumulation can be observed from the EDX-mapping (Fig. 3b). With increasing volume fractions of HNBR, more and more binder accumulations can be found in the voids between the LPSCl particles, indicated by intense red signals in the EDX-mappings (Figs. 3d and 3f). Note, that in the corresponding SEM pictures, the binder cannot be distinguished from the LPSCl particles. For all three separator samples, a red stripe at the top of the EDX-maps can be observed, which is located at the surface near-region of the separator that was opposite of the PP support film, i.e., the surface from which the evaporation of the toluene solvent took place. This seems to indicate a significant binder migration to the free surface, caused by the evaporation of the toluene solvent during the drying process, analogous to the binder migration observed for battery electrodes. 25 However, the possible effects of binder migration on the conductivity of the separator sheets and how it can be influenced by the drying process have not been investigated in this study.

Figure 3. Cross-section SEM images for LPSCl/HNBR separator sheets with different amounts of HNBR binder: (a) 1.7 vol%; (c) 8.2 vol%; and, (e) 16.0 vol%. The right panels show the corresponding EDX carbon-mapping of the SEM cross-sections: (b) 1.7 vol%; (d) 8.2 vol%; and, (f) 16.0 vol%.
Download figure:
Standard image High-resolution imageInteraction of the toluene solvent with the solid electrolyte
For slurry-based processes, the solvent needs to be chosen carefully to prevent the degradation of the sulfidic electrolyte. The two main requirements for a suitable solvent are the ability to sufficiently dissolve or disperse all the components and to not react with the components, as that might negatively affect the ionic conductivity. Yamamoto et al. 12 have investigated the compatibility of Li3PS4 with different solvents, which is chemically similar to LPSCl. 9,12 The results show that the biggest decrease in ionic conductivity is observed for solvents with a donor number higher than 14, on account of their reaction with Li3PS4. A protic solvent like ethanol with a high donor number of 19 26 reacts by a nucleophilic attack, leading to the decomposition of sulfidic electrolytes and the evolution of H2S. Therefore, the most suitable candidates are toluene, p-xylene, heptane, anisole, or dichloroethane. The first four, for example, have already been successfully used for the preparation of SE/binder separator sheets, and the results showed no significant decrease in Li-ion conductivity. 7,9,13 However, recently Ruhl et al. showed a decrease in ionic conductivity and a change in morphology of Li5PS6Cl powder treated with toluene for very long contact times of 48 h. 27 These findings appear contradictory to the already establish slurry preparation method from Riphaus et al., 7 where toluene was used as a solvent and where no detrimental effects of the exposure of the LSPS solid electrolyte to toluene was observed. Therefore, XRD, Raman spectroscopy, and XPS were used to assess whether any reaction between toluene with a sulfidic SE (exemplarily done for LPSCl) would occur.
Figure 4a shows the influence of the slurry-based processing (20 min dispersion in toluene) on the LPSCl structure investigated by XRD. The pristine LPSCl powder is displayed in brown, the slurry-processed LPSCl/HNBR separator sheet (8.2 vol% HNBR) in beige, and the slurry-processed and compressed (at 590 MPa) LPSCl/HNBR separator sheet in yellow. The diffraction patterns of the LPSCl/HNBR separator sheets provide no evidence for a degradation of the LPSCl material, even though the slurries had been mixed with toluene for 20 min. Furthermore, no changes are observed for the compressed separator sheet, proving that the steps to preare the compressed separator sheets do not introduce any artefacts. The overall features of the diffractograms are consistent with the experimentally observed patterns of the pristine LPSCl powder, showing the argyrodite structure with F 3m symmetry (CIF No. 418490).
28–30
In neither case, typical decomposition products like Li2S (gray shaded area) or LiCl (blue shaded area) that are found in the case of alcohol solvents
27
could be detected.
3m symmetry (CIF No. 418490).
28–30
In neither case, typical decomposition products like Li2S (gray shaded area) or LiCl (blue shaded area) that are found in the case of alcohol solvents
27
could be detected.
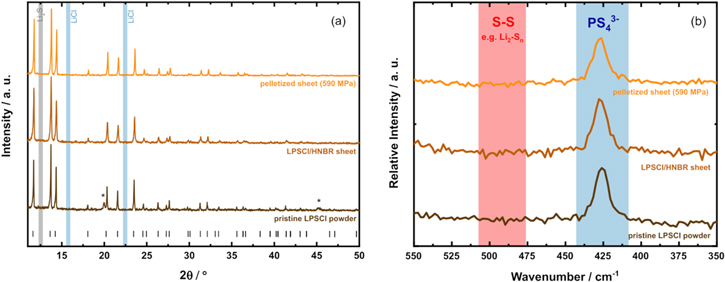
Figure 4. Influence of the slurry-processing with toluene on the chemical structure of LPSCl, comparing the pristine LPSCl powder (brown lines) and the slurry-processes LPSCl/HNBR separator sheets (8.2 vol% HNBR) both uncompressed (beige lines) or compressed at a fabrication pressure of 590 MPa for 5 min (yellow lines). (a) XRD diffraction pattern (recorded with Mo-Kα1 radiation), with the black ticks marking the reflex positions of LPSCl (from CIF no. 418490) and the asterisks marking reflexes from the glass capillary. The gray and blue shaded areas mark the main reflexes for Li2S and LiCl, respectively; the diffractograms are arbitrarily offset in the y-direction. (b) Raman spectra with indicated regions of characteristic PS4 3−-units with a maximum of the signal at 426–427 cm−1 (blue) and of polysulfides (476–506 cm−1) (red). 27 The spectra are arbitrarily offset in the y-direction.
Download figure:
Standard image High-resolution imageThe samples were also examined by Raman spectroscopy (Fig. 4b), following the same color coding as was used for the XRD data. The pronounced Raman signal in each spectrum at a wavenumber of 426–427 cm−1 can be assigned to the PS4 3− tetrahedra of the argyrodites; 27,31 the typical decomposition products such as polysulfides (broad range between 476–506 cm−1 27,31 ) cannot be found in the spectra of the slurry-processed separator sheets. Hence, the Raman data are in good agreement with the results obtained by XRD and provide no evidence for any reaction between of the LPSCl solid electrolyte during our slurry-processing method with toluene.
Since the detrimental effect of toluene on the ion conductivity of LPSCl powder observed by Ruhl et al. 27 was after an exposure of 48 h, much longer than the exposure time during our slurry-processing procedure of only 20 min, and thus significantly less than in the experiments by Ruhl et al., we also conducted further experiments where the LPSCl powder was exposed to toluene for 48 h and analyzed by PEIS and XPS. The conductivity of the three LPSCl powder samples was measured in the spring-cell at an operating cell pressure of 70 MPa (without any pre-compression of the powders). The thereby obtained conductivity for the pristine LPSCl powder of (1.43 ± 0.04 mS cm−1) is essentially identical to that of the LPSCl powder that was dispersed with the dissolver in an HDPE beaker with toluene for 20 min, analogous to the process used for preparing the slurry-processed LPSCl/HNBR separator sheets (1.35 ± 0.02 mS cm−1; the error bars represent the standard deviation of three repeat measurements), consistent with the absence of any changes in their Raman and XRD spectra (Fig. 4). On the other hand, the conductivity of the LPSCl powder that was obtained after stirring it with toluene in a glass beaker for 48 h dropped slightly by a factor of roughly 1.5 (0.98 ± 0.06 mS cm−1). However the detrimental impact of long-term toluene treatment on LPSCl powders, which was described by Ruhl et al., 27 could not be observed. We cannot clearly identify the reason for the discrepancy of the results. There is no chemical reactivity to expect between the sulfidic SE and toluene, therefore one hypothesis for the described detrimental impact observed by Ruhl et al. 27 is the presence of traces of water in the system either due to insufficient drying of the solvent or a leakage during the solvent treatment.
Furthermore, we used XPS analysis in order to have a higher sensitivity on changes in the near-surface region of the LPSCl material, analyzing the S 2p region. Comparing the high-resolution S 2p spectrum of the pristine LPSCl powder that only shows the S 2p feature of the PS4 3− units of LPSCl 32 (Fig. 5a) with that of the LPSCl powder that was mixed with toluene in an HDPE beaker using the dissolver for 20 min (Fig. 5b; analogous to the process used for preparing the slurry-processed LPSCl/HNBR separator sheets), indeed no changes in the S 2p feature can be observed. Similarly, the same is true when comparing the pristine LPSCl powder and the as-prepared Li6PS5Cl/HNBR separator sheet (Fig. 5d), indicating also no features that could be ascribed to potential decomposition products, such as lithium sulfide (Li2S) and polysulfides (Sx 2−). On the other hand, for the LPSCl powder that was stirred in a glass vial with toluene for 48 h (as was done by Ruhl et al. 27 ), small signals in the S 2p region characteristic of lithium sulfide and polysulfides 32 can be observed (Fig. 5c), which may explain the slightly drop in ionic conductivity.
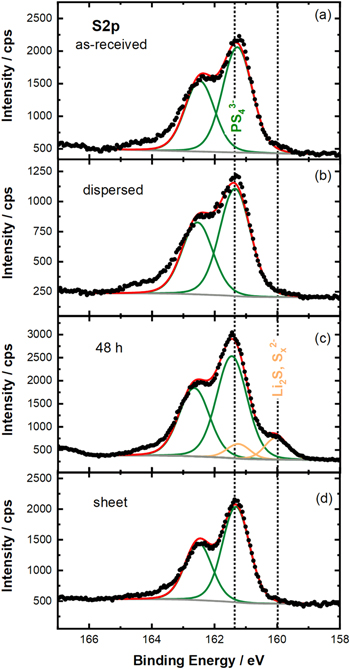
Figure 5. Investigation of the influence of the exposure of LPSCl to toluene, examining the high-resolution XPS signals in the S 2p region: (a) of the pristine LPSCl powder; (b) of the LPSCl powder after mixing it with the dissolver in an HDPE beaker with toluene for 20 min (mimicking the slurry-processing method); (c) of the LPSCl powder after stirring it in a glass beaker with toluene for 48 h; and, (d) of the slurry-processed LPSCl/HNBR separator sheet containing 8.2 vol% HNBR. The powder samples were dried at room temperature, followed by a subsequent drying under dynamic vacuum at 70 °C. The green peaks can be attributed to the PS4 3− units of LPSCl, while the orange peaks in case of the LPSCl powder stirred with toluene in a glass vial for 48 h can be ascribed to lithium sulfide (Li2S) or polysulfides (Sx 2−), indicating a partial decomposition of the LPSCl upon long-term exposure to toluene.
Download figure:
Standard image High-resolution imageIn summary, we can conclude that the short-term exposure of LPSCl to toluene, mimicking the exposure that occurs during our slurry-processing with toluene, does not lead to any detectable changes in structure and composition by XRD, Raman, and XPS, and does not affect the conductivity of the LPSCl powder.
Dependence of the separator sheet porosity on the fabrication pressure
Throughout the literature, a beneficial effect of a low porosity on the ionic conductivity of pellet-type solid electrolyte separators is reported, 16,20 so that a high degree of densification is desirable. For the mechanically ductile sulfidic solid electrolytes, this can be easily achieved by compression at room temperature. Figure 6a presents the influence of the fabrication pressure (pfabr) on the SE/HNBR separator sheet porosity for the three different solid electrolytes. The porosity for the as-prepared uncompressed SE/HNBR separator sheets with an HNBR content of 8.2 vol% ranges from roughly 50% for LPSCl (red) and LSPS (green) to almost 60% for LPS711 (blue). Upon applying a fabrication pressure of up to 980 MPa for 5 min, the separator sheet porosity can be reduced to below 5% for the LPSCl/HNBR and the LPS711/HNBR separator sheets and to ≈8% for the LSPS/HNBR separator sheets. Note that based on the measurement accuracy of the thickness of the compressed separator sheets, the estimated absolute error of the porosity values is on the order of ±1%. In order to compare the porosity values of sheet-type and pellet-type separators, we determined the porosity of the powder pellet-type samples at 70 MPa to ε = 28% (LPSCl), 32% (LPS711) and 33% (LSPS) and at 590 MPa to ε = 11% (LPSCl), 13% (LPS711) and 20% (LSPS). This compares with ε = 24% (LPSCl) and 33% (LPS711 and LPSP) at 70 MPa and ε = 3% (LPSCl), 6% (LPS711) and 12% (LPSP) at 590 MPa for separator sheets of the different SEs with a binder content of 8.2 vol%. While at 70 MPa values are quite similar, the porosity values of the sheet-type separators are significantly smaller compared to powder pellet-type samples. This suggests that the binder can effectively fill the voids and therefore sheet-type separators feature lower porosities at the same fabrication pressure.
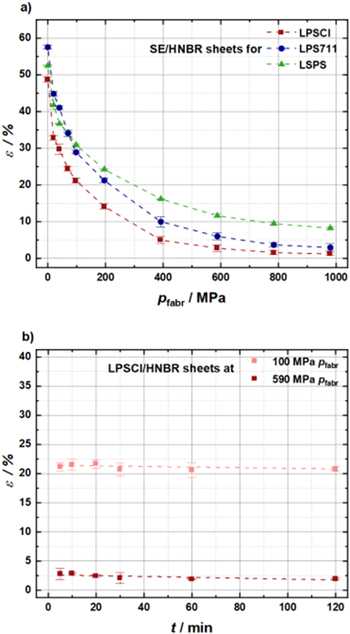
Figure 6. (a) Influence of different fabrication pressures (uniaxially pressed at room temperature for 5 min) on the porosity of SE/HNBR separator sheets made with 8.2 vol% HNBR binder and different solid electrolytes; LPSCl (red), LPS711 (blue), and LSPS (green). (b) Influence of the pressing time on the porosity of LPSCl/HNBR separator sheets (8.2 vol% HNBR) for low and high fabrication pressures of 100 and 590 MPa, respectively. In each case, samples were prepared by stacking three 8 mm diameter separator sheets in the cell setup shown in Fig. A·2. For each data point, three independent measurements were conducted, and error bars represent the standard deviation. Dashed lines are a guide to the eye.
Download figure:
Standard image High-resolution imageThe largest changes in the porosity of the separator sheets occur up to a fabrication pressure of 590 MPa, after which only minor changes occur. Over the entire fabrication pressure range, the porosity of the LPSCl/HNBR separator sheets is lowest and that of the LSPS/HNBR separator sheets is highest, which may be due to the slightly lower plastic deformability of LSPS. 33–38 In the literature, the plastic deformability is described by the so-called Pugh's ratio G/B, which relates the shear modulus G to the bulk modulus B. Sulfidic SEs generally feature a low G/B ratio of < 0.5, reflecting their ductile nature, whereas for most oxides the G/B ratio lies between 0.5–0.6. The G/B ratio of LPSCl (0.28) and LPS711 (0.34) are clearly lower than for LSPS (0.48), consistent with the trends observed in Fig. 6a and thus the most likely explanation why at a given fabrication pressure the LPSCl/HNBR and the LPS711/HNBR separator sheets can be densified to substantially lower porosities than the LSPS/HNBR separator sheets.
Besides the fabrication pressure, we also investigated the influence of the compression time on the separator sheet porosity. This is shown in Fig. 6b for LPSCl/HNBR separator sheets with a binder content of 8.2 vol% for fabrication pressures of either 100 MPa or 590 MPa, indicating that there is no change in porosity when applying these fabrication pressures between 5–120 min. While for the sake of clarity only data for LPSCl/HNBR separator sheets at these two fabrication pressures are shown, it should be noted that the same behavior was found for the separator sheets based on the other two SEs and for all other fabrication pressures.
Figure 7 displays top-view (left panels) and cross-section (right panels) SEM images of LPSCl/HNBR separator sheets with 8.2 vol% HNBR either uncompressed or compressed uniaxially at room temperature for 5 min at 100 MPa or 590 MPa. Both the top-view and the cross-section SEM pictures show a loose distribution of LPSCl particles for the uncompressed separator sheet (Figs. 7a and 7b), with large and numerous voids in between the LPSCl particles. For the separator sheet prepared at a fabrication pressure of 100 MPa (Figs. 7c and 7d), the packing of the LPSCl particles appears to be much denser, which is consistent with the ≈2-fold lower porosity determined in this case (see Fig. 6a). The cross-section image of that sample reveals that the drop in porosity not only results from smaller and fewer voids, but from the plastic deformation of the LPSCl particles. Still, quite large voids can be seen, indicating a not yet complete densification of the LPSCl/HNBR composite. Upon compressing at 590 MPa (Figs. 7e and 7f), single LPSCl particles cannot anymore be identified clearly, and LPSCl particles appear to have aggregated into bigger domains without visible boundaries in between. Voids can only be observed in very few instances and are randomly distributed, giving evidence for an almost complete densification of the LPSCl/HNBR composite. This is consistent with the very low porosity of ≈3% that was determined in Fig. 6a for this material when compressed at 590 MPa.

Figure 7. (a) Influence of the fabrication pressure (applied uniaxially at room temperature for 5 min) on an 8 mm sample on the morphology of LPSCl/HNBR separator sheets with 8.2 vol% HNBR, as observed in top-view (left panels) and cross-section (right panels) SEM images. (a) & (b) uncompressed; (c) & (d) compressed at 100 MPa; (e) & (f) compressed at 590 MPa.
Download figure:
Standard image High-resolution imageLithium ion conductivity of the SE/HNBR separators
Besides morphology and porosity, the lithium ion conductivity is the most important property of the produced separator sheets. In order to investigate the lithium ion conductivity, electrochemical impedance spectroscopy was performed. All measurements in this section were conducted at an operating cell pressure of poper = 70 MPa and a fabrication pressure of pfabr = 0 MPa. Herein, the operating cell pressure refers to the pressure, which is applied on the sample during the measurement by the compression of the spring (see Fig. 1). Hence, poper is independent from the fabrication pressure pfabr, which refers to the prior, cell-external compression of the separator sheet by the hydraulic press (as was done similarly by Doux et al. 20 ).
Figure 8 displays the Nyquist plots for LPSCl/HNBR separator sheets with different binder contents, recorded at poper = 70 MPa and normalized to the separator sheet thickness that was determined after the measurement; for comparison, the data for pure LPSCl powder (black symbols) are also shown. Spectra for the other SEs are shown in Fig. A·2. The Nyquist plots exhibit a semi-circle at high frequencies and a low-frequency tail that can attributed to the blocking electrodes. The semi-circle at high frequencies can be described by a parallel circuit element of a resistor and a constant phase element (R/Q), with R representing both intragrain and grain boundary contributions to the lithium ion transport, which could not be resolved at the investigated temperature. 39–41 Comparing the impedance spectra for different binder contents, it can be seen that the semi-circle increases for higher binder contents. We attribute this effect on the ionically insulating nature of the binder, which is located in between the LPSCl particles and impedes the ionic transport across the grain boundaries.

Figure 8. Nyquist plots of the impedance spectra of LPSCl/HNBR separator sheets, obtained at 25°C and at an operating cell pressure (poper) of 70 MPa; the spectra are normalized to the separator sheet thickness that was determined ex-situ after the measurements. The separator sheets were prepared without compression (i.e., pfabr = 0 MPa) and with different amounts of HNBR binder: 0 vol% (black), 1.7 vol% (brown), 5.8 vol% (orange), 8.2 vol% (light green), and 16.0 vol% (dark green); note that 0 vol% corresponds to the pure LPSCl powder without any solvent exposure. For the measurements, three 8 mm diameter separator sheets were stacked up in the cell; for the binder-free sample, 60 mg of LPSCl powder were used. The apex frequency of the R/Q-element for the separator sheets lies between 2.9–1.2 MHz (both decreasing with increasing HNBR content) and the shown data were acquired between 3 MHz and 1 kHz. The lines in the plot serve as a guide to the eye. For the sake of clarity, spectra of separator sheets with an HNBR content of 3.4 and 11.4 vol% are not displayed. An exemplary fit with an R1/Q1 + Q2 equivalent circuit of the impedance data from a LPSCl/HNBR sheet with a binder content of 16.0 vol% is displayed in gray.
Download figure:
Standard image High-resolution imageThe lithium ion conductivity was determined from the total separator resistance R that is obtained from the fit of the R/Q element, as exemplarily shown in Fig. 8 for the 16.0 vol% sample (gray line). Based on the fitted separator resistance, the lithium ion conductivity (σsheet) was determined from the thickness of the separator, which was taken after the measurement and outside the cell (tsep), i.e., with no applied pressure, according to:

where A is the cross-sectional area of the 8.0 mm diameter separator (0.50 cm2). Note that the DC resistance (i.e., the electron conduction resistance) is at least four orders of magnitude larger than the AC resistance and is thus negligible. Figure 9a shows the obtained conductivities (σsheet) for separator sheets made from different SEs without compression (i.e., pfabr = 0 MPa) as a function of the volumetric binder content (φHNBR) at an operating cell pressure of poper = 70 MPa. A binder content of 0 vol% corresponds to the pure SE powders and serves as a reference in order to investigate the change in conductivity by the addition of the HNBR binder. For all SEs, the determined powder conductivity is roughly 1.5 mS cm−1 at poper = 70 MPa and the measured porosity ranges from ε = 28%–33%. The addition of only 1.7 vol% of HNBR binder results in a significant, ≈2-fold decrease in conductivity for the LPSCl/HNBR and the LPS711/HNBR separator sheets (unfortunately, no mechanically stable separator sheets could be obtained with 1.7 vol% of HNBR for the LSPS/HNBR composites). Further increasing the binder content has a progressively smaller impact on the conductivity, whereby the here examined SE/HNBR composites follow the same trend and show essentially identical conductivities within the measurement error, with values of ≈0.5 mS cm−1 for 8.2 vol% HNBR and of ≈0.3 mS cm−1 for 16.0 vol%. These values refer to poper = 70 MPa, which is a typical pressure used when testing small-scale ASSB laboratory cells. 2,20

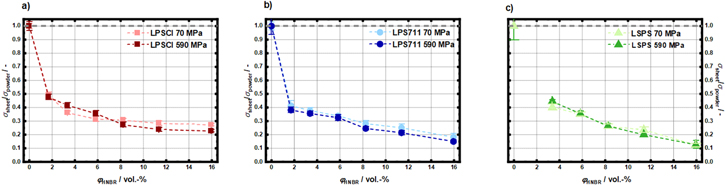
Figure 9. Separator sheet conductivity (σsheet) at 25 °C of different SE/HNBR separators (red: LPSCl; blue: LPS711; green: LSPS) that were prepared without compression (i.e., pfabr = 0 MPa) as a function of volumetric binder content (φHNBR) at two different operating cell pressures: (a) poper = 70 MPa: (b) poper = 590 MPa. Note that the point at 0 vol% corresponds to the pure SE powder without any solvent exposure and that σsheet is determined from Eq. 2. Note that the sample thickness is determined after the measurement and outside the cell, i.e. with no pressure applied. The lower panels show the σsheet, values normalized to the pure SE powder conductivity (σpowder, depicted at 0 vol% HNBR) at the respective operating cell pressures: (c) poper = 70 MPa; (d) poper = 590 MPa. The dotted, grey line at σsheet/ σsheet = 1 corresponds to the powder conductivity at the respective operating pressure. For each data point, three samples were taken and error bars were obtained by the standard deviation of the three independently measured samples. Dashed lines are a guide to the eye.
Download figure:
Standard image High-resolution imageIn addition, measurements at poper = 590 MPa were conducted in order to investigate the maximum achievable conductivity. For this purpose a slightly modified cell setup was used, which is shown in Fig. A·1. Contrary to the fairly similar conductivities of the different SE/HNBR separator sheets obtained at poper = 70 MPa, the conductivities of the samples with different solid electrolytes differ somewhat when determined at the higher operating cell pressure of poper = 590 MPa, as illustrated in Fig. 9b. The pure SE powder conductivities range from 2.8 ± 0.18 mS cm−1 for LPS711 (blue, ε = 13%) to 3.2 ± 0.23 mS cm−1 for LSPS (green, ε = 20%) and 3.4 ± 0.13 mS cm−1 for LPSCl (red, ε = 11%), and are in reasonably good agreement with the literature (≈4 mS cm−1 for LSPS reported by Bron et al. 42 and ≈1.3 mS cm−1 for LPSCl reported by Boulineau et al. 43 ). For a more quantitative comparison, the fabrication pressure and the operating cell pressure need to be considered, as outlined by Doux et al. 20 and by Ohno et al. 41 For example, for pfabr = 370 MPa and poper = 70 MPa, Doux et al. 20 report ≈3 mS cm−1 for LPSCl when using their optimized carbon powder coated current collector, which is in good agreement with the data in Fig. 9b, where the maximum pressure seen by the sample was 590 MPa. As observed for the above data at poper = 70 MPa, the overall trend of the conductivity decrease with increasing binder content is also very similar for all three SE/HNBR composites at poper = 590 MPa, with the difference that the LPSCl- and LSPS-based separator sheets outperform those based on LPS711. At a binder content of 8.2 vol% (i.e., at a binder content of 3.7–5.0 wt%, see Table II), the ionic conductivities are rather similar, with 0.93 ± 0.04 mS cm−1, 0.84 ± 0.05, and 0.70 ± 0.03 mS cm−1 for the LPSCl/HNBR, the LSPS/HNBR, and the LPS711/HNBR separator sheets, respectively.
In order to more rigorously compare the decrease of the ionic conductivity with increasing volumetric HNBR binder fraction for the different SE/HNBR separator sheets, the measured σsheet values were normalized by the respective SE powder conductivity values (σpowder), thereby decoupling the absolute conductivity differences of the different SEs from that of the corresponding SE/HNBR composites. Thus, the lower panels in Fig. 9 show the values of σsheet/σpowder vs φHNBR for poper = 70 MPa (Fig. 9c) and 590 MPa (Fig. 9d). Up to a volumetric HNBR binder fraction of 11.4 vol%, the decrease in conductivity is largely independent of the sulfidic SE type (we ascribe the differences at 1.7 vol% to small errors in weight measurements, which become important at this steep part of the curve). This is somewhat surprising, as at both operating cell pressures the porosity of the SE/HNBR separator sheets measured for 8.2 vol% HNBR (see Fig. 6a) differ quite significantly (ε ranging from ≈23%–34% at poper = 70 MPa and from ≈3%–12% at poper = 590 MPa). This suggests that small differences in porosity do not significantly affect the conductivity of the SE/HNBR separator sheets. Only at the highest volumetric binder fraction of 16.0 vol%, significant differences can be observed, with a ≈2-fold higher normalized conductivity for the LPSCl/HNBR separator sheet compared to the LPS711/HNBR and LSPS/HNBR separator sheets. When plotting the σsheet/σpowder vs φHNBR data acquired at low (70 MPa) and high (590 MPa) operating cell pressure for the separators based on a given SE, as shown in Fig. A·3, it can be seen that the operating cell pressure has no significant impact on the binder-induced conductivity decrease.
Although the mechanical properties of the here discussed SE/HNBR separator sheets were not investigated in detail, some conclusions can be drawn from handling the separator sheets: an HNBR binder content of < 5 vol% results in rather brittle separator sheets that are challenging to work with, whereas an HNBR binder content of > 11 vol% yields very flexible sheets with almost rubbery properties. At the same time, as discussed above, the higher the HNBR binder content, the lower is the ionic conductivity of the separator sheets. Thus, for the here described SE/HNBR separator sheets, the qualitatively best trade-off between ionic conductivity and mechanical properties is found for separator sheets with an HNBR binder content of 8.2 vol%, where ≈25%–30% of the conductivity of the equally compressed SE powder can be obtained (see Figs. 9c and 9d). Therefore, the following experiments were only conducted with this binder content.
Effect of the fabrication pressure on SE/HNBR separator conductivities
Both the literature and the afore described experiments show higher ionic conductivities at higher operating cell pressures, due to a lower sample porosity. 20 In the case of the here examined separator sheets, it should be noted that for the separators based on different SEs, differences in porosity of roughly 10 percentage points were found to not yield significant differences in their σsheet/σpowder values (see above). At the same time, low porosities might be beneficial for suppressing the formation of Li dendrites and thus enable cell operation at higher current densities. 21,22 However, for actual applications it is not feasible to apply several hundred MPa on a battery, as this would add an excessively large weight to the battery and thus reduce its overall energy density. Therefore, the effect of pre-pressing (or pre-calendering) of separator sheets on their conductivity (i.e., using a high fabrication pressure) will be examined next. In doing so, we compare the conductivity of uncompressed (pfabr = 0 MPa) separator sheets at poper = 20, 40, 70, and 590 MPa with that of separator sheets that had been pre-pressed at pfabr = 590 MPa and afterwards measured at operating pressures of 20, 40, and 70 MPa. In each case, the separator thickness was determined after the experiments, i.e., without any pressure applied.
Figures 10a–10c shows the results for the three different SE/HNBR separators with 8.2 vol% HNBR, with exemplary separator thickness-normalized Nyquist plots shown in Figs. 10d– 10f. In case of uncompressed LPSCl/HNBR-sheets (pfabr = 0 MPa, ocher markers in Fig. 10a), the conductivity values range from 0.17 ± 0.04 mS cm−1 (33% porosity) at 20 MPa cell operating pressure to 0.43 ± 0.02 mS cm−1 (24% sample porosity) at poper = 70 MPa, reaching a maximum value of 0.94 ± 0.05 mS cm−1 (3% sample porosity) at poper = 590 MPa. When the separator sheets are pre-pressed at pfabr = 590 MPa before the conductivity is determined, higher values are observed for all operation pressures, e.g., 0.57 ± 0.05 mS cm−1 (3% sample porosity) at poper = 70 MPa (olive green marker). It is striking that the conductivity of this sample pre-pressed at pfabr = 590 MPa and measured at poper = 70 MPa is almost 2-fold lower than the uncompressed sample that was measured at poper = 590 MPa, even though both samples have the same porosity of ≈3%. Doux et al. 20 observed a similar increase of the conductivity with increasing operating cell pressure for LPSCl powder samples pre-compressed at pfabr = 370 MPa (≈2-fold when increasing poper from 20 to 70 MPa), which they attributed to poor contacting of their SE powder samples by metal current collectors at low cell operating pressures. This is based on their observation that the conductivity increase with poper could be reduced substantially by placing layers of conductive carbon between their metal current collectors and their SE powder sample (≈1.4-fold when increasing poper from 20 to 70 MPa). Considering that the increase in conductivity with the operating cell pressure is similar in the experiments shown in Fig. 10a, it is also likely due to the effect of contact resistances between the metal current collectors of the cell and the separator sheets, as reported by Doux et al. 20 Nevertheless, it is clear that higher fabrication pressures result not only in much reduced porosities of the LPSCl/HNBR separator sheets, but also in ≈1.5-fold higher conductivites at any given operating cell pressure.
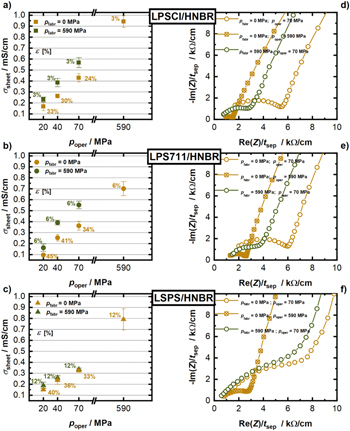
Figure 10. (a)–(c) Conductivity of different SE/HNBR separator sheets with 8.2 vol% HNBR (red: LPSCl; blue: LPS711; green: LSPS) that were prepared either without pre-compression (pfabr = 0 MPa, ocher) or with a high fabrication pressure of pfabr = 590 MPa (olive green), determined at operating cell pressures of poper = 20 MPa, 40 MPa and 70 MPa, as well at 590 MPa. Values are given as the average of three measurements and error bars represent the standard deviation thereof. Porosity values of the samples are given in percent and written next to corresponding data points. (d)–(f) Corresponding Nyquist plots, normalized to sample thickness for measurements at poper = 70 MPa (circles in ocher and olive green) and 590 MPa (circle cross in ocher).
Download figure:
Standard image High-resolution imageFigure 10d compares the impedance data of the LPSCl/HNBR separator prepared without compression and measured at poper = 70 MPa (ocher; porosity of 24%) with the uncompressed sample measured at poper = 590 MPa (ocher, porosity of 3%), the decrease of the semi-circle can be correlated with an enhanced grain boundary conduction due to a better contacting of the particles upon densification, i.e., at lower porosity. On the other hand, when the LPSCl/HNBR separator is pre-compressed at 590 MPa (again resulting in a low porosity of 3%) and measured at poper = 70 MPa (olive green), the semi-circle increases and the apparent conductivity decreases. This can be interpreted either as the effect of a higher contact resistance at lower operating cell pressure (see above) or as an internal relaxation of the binder and SE particles due to a spring back leading to a microscopic contact loss of the SE particles without a macroscopic change in the sample thickness.
Similar dependencies of the conductivity on fabrication and operating cell pressure can be observed for the LPS711/HNBR separators (8.2 vol%). The only significant difference between the LPSCl/HNBR and the LPS711/HNBR separators is that the latter have slightly higher porosity values, as already observed in Fig. 6. Exemplary thickness-normalized Nyquist plots of uncompressed and pre-pressed LPS711/HNBR separators are shown in Fig. 10e.
Surprisingly, for the LSPS/HNBR separators (8.2 vol%), no change of the conductivity after pre-compression when measured at a given operating pressure can be observed (see Fig. 10c). For example, the sheets measured at an operating cell pressure of 70 MPa give a conductivity of 0.32 ± 0.01 mS cm−1 when prepared with pfabr = 0 MPa and 0.34 ± 0.01 mS cm−1 when prepared with pfabr = 590 MPa. One apparent difference between the pre-compressed separators based on LSPS vs those based on LPSCl or LPS711, is the substantially higher porosity of the latter (3% and 6% for the former, 12% for the latter). In order to investigate whether this difference in porosity could explain why the LSPS/HNBR separator sheets yield the same conductivity at poper = 70 MPa for uncompressed and pre-compressed samples, we will next examine the effect of porosity on conductivity. Unfortunately, it was not possible for the LSPS/HNBR separator sheets to achieve a final porosity value of 3% that can be reached for LPSCl/HNBR separator sheets. Hence, we conducted the following evaluation on the effect of porosity using LPSCl/HNBR separator sheets with 8.2 vol% HNBR, which were subjected to different fabrication pressures ranging between 0 and 590 MPa, after which their conductivity was determined at an operating cell pressure of 70 MPa (see Fig. 11). For a fabrication pressure of 215 MPa, resulting in a porosity of 11%, the LPSCl/HNBR separator conductivity of 0.46 ± 0.004 mS cm−1 is only marginally larger than that of the uncompressed sample with a porosity of 24% (0.43 ± 0.02 mS cm−1), a difference which is within the error range of the measurements. Only upon pre-compression at pfabr = 295 MPa, resulting in a porosity of 9%, the conductivity increases by ≈20% compared to the uncompressed sample (i.e., to 0.52 ± 0.01 mS cm−1). Finally, at pfabr = 590 MPa and 3% porosity, a conductivity gain of ≈31% compared to the uncompressed sample is observed (with a value of 0.57 ± 0.04 mS cm−1 at pfabr = 590 MPa). For the LPSCl/HNBR separator sheets, this shows that substantial conductivity gains for pre-compressed separators can only be observed once the porosity decreases below 11%. Thus, if one were to assume a similar conductivity vs porosity dependence for the LSPS/HNBR separator sheets, one could explain why there was no improvement of their conductivity between uncompressed samples and samples pre-compressed to 590 MPa (see Fig. 10c), where the porosity was still 12%. In summary, the data in Fig. 11 suggest that a pre-compression of the SE/HNBR separator sheets only significantly improves their conductivity when very low porosities (on the order of lower than 10%) can be obtained, which for materials like LSPS would require fabrication pressures of more than 800 MPa (see Fig. 6).
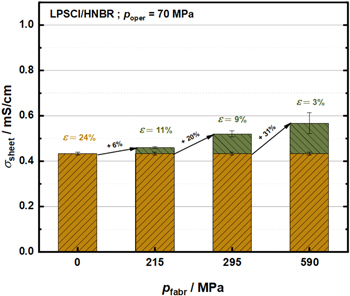
Figure 11. Influence of the fabrication pressure and the porosity on the ionic conductivity of LPSCl/HNBR (8.2 vol%) separator sheets, recorded at an operation cell pressure of 70 MPa. Yellow bars represent the separator sheet conductivity of uncompressed samples and green bars indicate the gain in conductivity after pre-compression at the given fabrication pressure. Corresponding porosity values after the pre-compression step are given in green numbers and in yellow numbers for the uncompressed samples. The numbers on the black arrows mark the percentage increase in conductivity compared to the uncompressed samples.
Download figure:
Standard image High-resolution imageConclusions
In this work, we report the preparation of thin separator sheets composed of solid electrolyte (SE) and HNBR binder for potential use in all-solid-state batteries (ASSBs) by a slurry-based process, investigating three different solid electrolytes, viz., Li6PS5Cl (LPSCl), Li7P3S11 (LPS711), and Li10SnP2S12 (LSPS). Using these separators sheets, we investigate the influence of time and fabrication pressure on the porosity of the sheets. Additionally, we investigate their ionic conductivity as a function of the volumetric binder content, the fabrication pressure of the separator sheets, and the operation cell pressure during the conductivity measurements using an in-house developed cell design.
The prepared separator sheets have a dry-film thickness of ≈100 μm and a porosity around 50% in their uncompressed, as-prepared state. Substantial densification of the separator sheets is easily achieved by compression at room temperature, reaching porosities at pressures of 590 MPa that are as low as 3%–12% (corresponding to thicknesses as low as ≈48–76 μm), depending on the solid electrolyte. Thereby, the applied compression has a significant influence on the final separator sheet porosity, whereas the compression time has none.
Even small amounts of binder lead to a significant decrease in ionic conductivity, which further decreases for further increasing binder contents. The separator sheets feature 25%–30% of the conductivity of the pure SE powder when compared at the same fabrication pressure. The observed decrease in conductivity is mainly a function of the volumetric binder content rather than of the used solid electrolyte. In this study, a binder content of 8.2 vol% proved to be the best compromise between achieving adequate mechanical properties for a good handling of the sheets and obtaining a reasonably high ionic conductivity with respect to the pure SE powder. For this binder content, room temperature conductivities of roughly 0.5 mS cm−1 could be obtained. Owing to the fact that the SE/HNBR separators are comparably thin, the separator sheets have approximately the same areal resistance as the typically much thicker pellet-type separators, but enable for a simpler preparation of large-format cells.
Lastly, we evaluate on the influence of fabrication and operation cell pressure on the ionic conductivity of the separator sheets. We show that a densification of the separator sheets at high fabrication pressures to low porosities can be used to increase their conductivity at lower operating cell pressures. Additionally, we show, that the porosity cannot directly be correlated to the conductivity, as the operating cell pressure has a significant influence on the sheet conductivity, even for low residual porosities.
Acknowledgments
We gratefully thank Erik Faber, Marc Schönberger and Patrick Gieb from the mechanical workshop at the TUM Chemistry Department for their support in building our solid-state cell hardware. Furthermore, we thank Philip Rapp and Hasan Camci for their assistance with the cell illustrations as well as Hans-Christoph Töpper and Raimund Koerver for valuable discussions. This work is part of the project "Industrialisierbarkeit Festkörperelektrolyte" funded by the Bavarian Ministry of Economic Affairs, Regional Development and Energy.
Appendix
Appendix. Cell setup for high cell stack compression
The following figure shows the details of the cell setup used in combination with a hydraulic press located in the glovebox in order to reach cell stack compressions of 100–590 MPa, with an accuracy of ±20 MPa. The theoretically determined capacitance of this cell is ≈1.3 · 10−11 F, which is in good agreement with the experimentally determined value of ≈1.0 · 10−11 F. The stray capacitances of the setup are at least three order of magnitude lower than the capacitances of the cell and thus do not influence the results of the PEIS measurements. The internal resistance of the cell was determined to <0.2Ω.
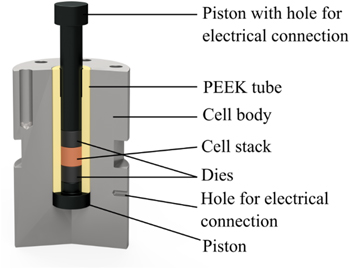
Figure A·1. Cross-sectional illustration of the cell design used for measurements at poper > 100 MPa. In order to apply the pressure, the cell was put into a hydraulic press. The bottom of the cell body and the top of the piston were electrically insulated from the press by a polyimide foil. The cell body is made from stainless steel; pistons and dies from hardened stainless steel.
Download figure:
Standard image High-resolution image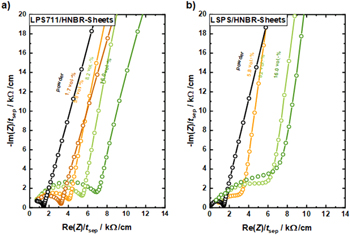
Figure A·2. Thickness-normalized Nyquist plots of the impedance spectra obtained at 25 °C and at an operating cell pressure of poper = 70 MPa for LPS711/HNBR (left) and LSPS/HNBR separator (right) that were prepared without compression (i.e., pfabr = 0 MPa) and with different binder contents: 0 vol% (black), 1.7 vol% (brown), 5.8 vol% (orange), 8.2 vol% (light green), and 16.0 vol% (dark green); note that 0 vol% corresponds to the pure SE powder without any solvent exposure. Samples were prepared by stacking three 8 mm separator sheets or using an amount of 60 mg SE powder for the binder-free samples. For the sake of clarity, spectra of separator sheets with an HNBR content of 3.4 and 11.4 vol% are not displayed. In case of the LSPS/HNBR system, the 1.7 vol% HNBR separator sheet could not be prepared. The apex frequency of the R/Q-element for the LPS711-based composites ranges between 2.9–0.9 MHz and for the LSPS-based composites ranges between 2.9–1.2 MHz (both decreasing with increasing HNBR content). The shown data points span the frequency range of 3 MHz–1 kHz, and the lines serve as guide to the eye.
Download figure:
Standard image High-resolution imageAppendix. Impedance spectra of the LPS711/HNBR and LSPS/HNBR separator sheets
The following figure shows the impedance measurements for uncompressed (pfabr = 0 MPa) separator sheets obtained at a cell operating pressure of poper = 70 MPa. In accordance to the observations described for LPSCl/HNBR sheets (cf. Fig. 8 in the main text), the spectra exhibit a semi-circle at high frequencies, representing grain and grain boundary contributions to the lithium ion transport, and a low-frequency tail due to the blocking electrode configuration. With increasing binder content, the magnitude of the semi-circle increases, leading to a decreasing ionic conductivity.
Appendix. Dependence of the separator conductivity on the operating cell pressure
Figures 9, 10c and 10d in the main part show the normalized separator sheet conductivities (σsheet/σpowder) vs φHNBR, comparing the three different SE systems at an operating cell pressure of 70 and 590 MPa each. Here we additionally compare σsheet/σpowder vs φHNBR for the same SE systems at low (70 MPa, data points in lighter colors) and high (590 MPa, data points in darker colors) operating cell pressure in order to investigate its impact on the separator sheet conductivity. Figure A·3 shows that, within the range of the experimental error, the normalized separator conductivity is essentially independent of the operating cell pressure and only a function of the volumetric binder content.
Figure A·3. Separator sheet conductivity (σsheet), normalized to the pure SE powder conductivity (σpowder) at poper = 70 MPa (lighter color) and at poper = 590 MPa (darker color) as function of the volumetric HNBR binder content (φHNBR) for the different SE/HNBR separator sheets prepared with pfabr = 0 MPa: (a) SE = LPSCl (red); (b) SE = LPS711 (blue); (c) SE = LSPS (green). For each data point, three samples were taken and error bars were obtained by the standard deviation of the three independently measured samples. Dashed lines are a guide to the eye. Note that the LSPS/HNBR-sheet with φHNBR = 1.7 vol% could not be prepared.
Download figure:
Standard image High-resolution image