
Abstract
Efficient manufacturing of cathode active materials (CAMs) for Li-ion batteries is one key target on the roadmap towards cost reduction and improved sustainability. This work deals with a two-stage calcination process for the synthesis of LiNiO2 (LNO) consisting of a (partial) lithiation step at moderate temperatures and short dwell times and a subsequent high temperature crystallization to decouple the chemical reactions and crystal growth. The use of an agitated-bed lithiation using the rotational movement of a rotary kiln setup shows beneficial effects compared to its fixed-bed counterpart in a crucible as the lithiation reaction is faster under otherwise comparable conditions. The temperature profile for the agitated-bed process was further optimized to avoid the presence of needle-like LiOH residuals in the intermediate product indicative of an incomplete reaction. The partially-lithiated samples were subjected to a second calcination step at a maximum calcination temperature of 700 °C and afterwards revealed comparable physico-chemical properties and electrochemical behavior compared to a reference sample made by a standard one-stage calcination. In a simplified model calculation, the proposed calcination concept leads to an increase in throughput by a factor of ∼ 3 and thus could embody an important lever for the efficiency of future CAM production.
Export citation and abstract BibTeX RIS

This is an open access article distributed under the terms of the Creative Commons Attribution 4.0 License (CC BY, http://creativecommons.org/licenses/by/4.0/), which permits unrestricted reuse of the work in any medium, provided the original work is properly cited.
The increasing demand for Li-ion batteries (LIBs), especially for the battery electric vehicle (BEV) market, calls for solutions with higher energy densities, improved safety and reduced costs. In recent years, layered transition metal oxides with the composition Li(Ni1-x-y Cox Mny )O2 (NCM) or Li(Ni1−x−y Cox Aly )O2 (NCA) were established as the predominant choice as cathode active material (CAM) for BEVs, as they fullfill most requirements, especially when the Ni content is increased concomitant with a reduction of the Co content. 1,2 However, BEVs still have not reached full cost competitiveness with cars powered by combustion engines. This can be attributed to a large extent to the CAM, which accounts for a substantial share of the overall cell costs. 3,4 As raw material prices have shown a significant increase and the transition towards renewable energy generation has not yet been accomplished, 5–7 increasing production throughput and the search for cheap and sustainable processes are both essential for economically feasible CAM manufacturing.
In a conventional production process for NCM and NCA materials, a mixture of a transition metal hydroxide precursor and a Li source is filled into ceramic vessels, referred to as "saggers," which are then passed through a roller hearth kiln (RHK). 8–11 The mixture passes the hot zones of the furnace, which either leads to a continuous heating or includes holding steps at fixed intermediate temperatures. Finally, the mixture is heated to a maximum calcination temperature Tmax for a certain dwell time for proper crystallization and crystallite growth.
LiOH·H2O is preferred as Li source compared to other alternatives, e.g. Li2CO3, due to its lower melting point at Tmelt ∼ 460 °C and less formation of lithium-containing residual salts after calcination, which is an issue especially for CAMs with an increased Ni content. 12–14 However, heating of LiOH·H2O and the transition metal hydroxide precursor leads to the evolution of H2O vapor and therefore limits calcination throughput because ∼ 30 wt% of the initial mixture is lost. Furthermore, the volatile H2O can cause demixing of the precursor and the Li source, potentially leading to inhomogeneities in the chemical composition of the final product. 15 As with many heterogeneous reactions, limitations by heat and mass transfer are likely to occur, leading to different temperatures and gas concentrations in different parts of the powder bed, varying lithiation progress in the course of the calcination and finally varying physical properties in the CAM powder. High sagger loadings and short reaction times, which are preferred to reduce manufacturing costs, are expected to increase these detrimental effects.
To overcome these problems, an alternative production concept with a two-stage process was proposed, which includes a "pre-calcination" step of the Li source and the precursor in a rotary calciner (a metal or ceramic tube) at an intermediate temperature of up to 750 °C and a second "high temperature calcination" step performed with a rotary calciner or a box furnace. 16 The inventors claim that the final product of this process starting from Ni0.333Co0.333Mn0.333Ox (OH)y and Li2CO3 has an identical crystal structure compared to materials prepared with the standard one-stage route and that it may display an improved product homogeneity, but without providing further analytical results or data on the electrochemical performance. Other authors claim a split firing method, where in a first step at a moderate temperature (650 °C–850 °C) a Li-deficient intermediate product (0.65–0.94 Li equivalents per mol of transition metal) is formed, mixed with additional Li source to obtain the target Li equivalents and sintered in a second step. 15 For the first step, a metallic rotary kiln was applied to improve the product homogeneity as well as the temperature distribution during the reaction.
Moreover, in a recent in situ study on the synthesis of LNO it was found that significant lithium uptake into rock-salt type NiO occurred even at moderate temperatures (350 °C and a dwell time of 12 h), which was suggested to be beneficial for the crystallization of the material. 17
Several research groups have started to use a holding step close to 500 °C for several hours, sometimes accompanied by an intermediate grinding step, before heating up to the maximum temperature for the calcination of their LNO samples. 18–20
So far, mostly patents have dealt with the potential benefits of separating the chemical reactions during a "partial-lithiation" step at moderate temperatures and the formation of the final crystal structure concomitant with crystallite growth during a sintering step at high temperatures, which also means that the used temperatures and dwell times are described rather unspecifically and that the amount and the completeness of the provided data are quite limited.
Thus, in this study we intend to generate a deeper understanding of the lithiation mechanism itself and whether a two-stage calcination process including a partial-lithiation step can be used to synthesize CAM with comparable properties when benchmarked against a conventional one-stage calcination protocol.
The study is run exemplarily with LiNiO2 as the 100% Ni end member of the NCM and NCA cathode solid solutions. At first, we revisit the occurring chemical reactions via thermogravimetric and differential thermal analysis, starting from the precursors Ni(OH)2 and LiOH·H2O. Afterwards, partial-lithiation experiments are performed under agitated-bed conditions using a rotary kiln and compared to the fixed-bed reaction in a box furnace, by use of two different Li stoichiometries, a temperature of 500 °C and a dwell time of one hour. Furthermore, the influence of the partial-lithiation temperature and dwell time on the lithiation progress are pointed out for the agitated-bed furnace concept. Then, CAMs are prepared in a second "main calcination" step and the physico-chemical properties as well as electrochemical behavior are compared to a reference material calcined via a standard one-stage process. Finally, benefits and remaining challenges of the two-stage calcination concept are discussed.
Experimental
Calcination of LiNiO2 using a partial-lithiation step
LNO samples were calcined through a solid-state synthesis route starting from the base materials Ni(OH)2 and LiOH·H2O. A commercial monodisperse Ni(OH)2 precursor (Hunan Zoomwe Zhengyuan Advanced Material Trade Co., Ltd.) with a narrow secondary particle size distribution (d50 = 10 μm with a span of 0.8 μm) was utilized. LiOH·H2O was used as Li source (Albemarle Corporation), which was ground prior to the synthesis with an air classifying mill to obtain particles with a size of ∼10–20 μm. 50 g of Ni(OH)2 were mixed with either 80% or 100% of the amount of Li source that is required to obtain 1.01 Li equivalents per mol of Ni using a laboratory blender (Kinematica AG). For the fixed-bed partial-lithiation, 60 g of the mixture were filled into an alumina crucible and put into a box furnace (Linn High Therm GmbH). For the agitated-bed partial-lithiation, the same sample amount was put into a metal bulb, which was then attached to a rotary evaporator (Büchi Labortechnik AG) and heated inside an electrical dome-shaped furnace (Horst GmbH).
A schematic of the used calcination profiles is depicted in Fig. 1a. A "one-step reference" sample was prepared by heating the mixture of Ni(OH)2 and LiOH·H2O (1.01 Li equivalents per mol of Ni) using a crucible and a box furnace with a ramp of R1 = 3 °C min−1 to T1 = 400 °C and a dwell time t1 = 4 h, followed by heating with the same ramp to T2 = 700 °C and a dwell time of t2 = 6 h. The experiment was run in pure oxygen atmosphere (flow rate of 100 liters per hour, corresponding to about ten furnace-volume exchanges per hour).

Figure 1. Overview of the experimental conditions and the setup of this study. (a) Top: Typical calcination profile used in industry with one temperature hold at T1 for a time t1 and a second temperature hold at T2 > T1 for a time t2 and with a heating ramp R1. Bottom: Calcination profile including a partial-lithiation step using a heating ramp R2 > R1 and a temperature hold at T3 ≈ T1 for a time t3 < t1. After cooling, the partially-lithiated powders were heated with a heating ramp R1 to a temperature T2 > T3 and a hold for a time t2 is applied. (b) The two furnace designs, which were used for the partial-lithiation step: a rotary kiln with a metal bulb (left) and a crucible within a box furnace (right).
Download figure:
Standard image High-resolution imageFor sample preparation including the partial-lithiation step, the mixture of Ni(OH)2 and LiOH·H2O was heated with R2 = 10 °C min−1 to a temperature T3 = 400 °C, 500 °C or 600 °C and a dwell time t3 = 1 h or 2 h. Figure 1b shows schematics of the furnace designs used for the partial-lithiation step. All experiments were run in pure oxygen atmosphere with a flow rate of 100 liters per hour for the box furnace (∼ ten furnace-volume exchanges per hour) and 60 liters per hour for the rotary kiln (∼ thirty furnace-volume exchanges per hour). The rotary kiln was operated with a rotational speed of 20 revolutions per minute.
The partially-lithiated samples were removed from either the metal bulb or the crucible and analyzed by inductively coupled plasma optical emission spectrometry (ICP-OES) to determine the amounts of Li and Ni. Afterwards, the samples were mixed with the required amount of LiOH·H2O to obtain 1.01 Li equivalents per mol of Ni in the final product and subjected to a main calcination step using a crucible and the box furnace. For this purpose, the mixtures were heated with R1 = 3 °C min−1 to T2 = 700 °C and a dwell time t2 = 6 h. After the holding step at T2, all samples were cooled down to 120 °C and brought to a dry room (21 °C, dew point < −40 °C) inside a gas-tight box to prevent reactions with ambient moisture and CO2. If not specified otherwise, all further powder processing was performed under dry room conditions. Prior to characterization of the materials and electrode preparation, the powders were sieved using sieves with a mesh size of 32 μm (Retsch GmbH).
Thermogravimetric—differential thermal analyis (TG-DTA)
Ni(OH)2, LiOH·H2O and the mixture of both with 1.01 Li equivalents per mol of Ni were investigated using a TG-DTA device (STA 449 F1 Jupiter, Netzsch-Gerätebau GmbH). Measurements were performed under oxygen enriched atmosphere with an O2 flow rate of 95 ml min−1 and 5 ml min−1 of synthetic air (furnace volume ∼ 100 ml). For each experiment, ∼ 60 mg of the sample were filled into a ceramic crucible (Al2O3, 0.9 ml volume) and heated with 10 °C min−1 to 500 °C, where the temperature was held for one hour. One additional measurement was made with the mixture of Ni(OH)2 and LiOH·H2O heated with the same ramp to 600 °C and a dwell time of one hour.
Inductively coupled plasma optical emission spectrometry (ICP-OES)
Li and Ni contents of the samples after each calcination step were determined by ICP-OES. For this purpose, a small amount of sample (∼ 0.3 g) was dispersed in 5 M aqueous HCl solution. The mixture was stirred and slightly heated until the solid powder was completely dissolved. Afterwards, the mixture was cooled down and diluted with deionized H2O, until a concentration of 0.5 M HCl was reached. Finally, the concentrations of the elements Li and Ni were measured with the ICP-OES device (5100, Agilent Technologies, Inc.).
Acid titration
To evaluate the amount of lithium-containing residual salts in form of LiOH and Li2CO3 after the partial-lithiation step as well as after the main calcination, the samples were investigated using acid titration. For this purpose, 2 g of intermediate sample or CAM were mixed with 10 g of deionized H2O and stirred for 20 min in a glovebox under N2 atmosphere. Then, the sample/H2O dispersion was filtered using a syringe filter and the filtrate was titrated using an automatic titrator (Titrando 808, Deutsche Metrohm GmbH & Co. KG) and 0.1 M HCl as a standard solution (analytical grade, Bernd Kraft GmbH). The change of the pH value was monitored using a glass electrode (Metrohm). LiOH and Li2CO3 were distinguished by the two distinct equivalent points in the titration curve. The first equivalent point thereby corresponds to the protonation of the hydroxide and carbonate ions, whereas the second equivalent point equals the protonation of the hydrogen carbonate ions, thus making the differentiation of the two salt concentrations possible. The weight fractions of "soluble Li" species were calculated by multiplying the weight fractions of LiOH and Li2CO3 with the respective Li stoichiometries and the molar mass of Li, dividing by the respective molar masses and finally adding both contributions.
Iodometric titration
The average Ni oxidation states of the samples after the partial-lithiation step and after the main calcination were determined by iodometric titration. For this purpose, a small amount of sample (∼ 0.3 g) was dispersed in a 20 wt% HCl solution and the mixture was heated to evaporate into a receiver containing a 10 wt% KI solution. Subsequently, the Ni3+ ions were reduced to Ni2+ concomitant with the oxidation of I− to I2. The resulting iodine was titrated using a 0.1 M Na2S2O3 solution. From the consumption of the thiosulfate solution, the amount of substance of Ni3+ was calculated and compared to the total amount of substance of Ni measured by ICP-OES to determine the average oxidation state of Ni.
Scanning electron microscopy (SEM) imaging
For top view images, a small amount of cathode powder was fixed on a SEM pin holder (Agar Scientific, Ltd.) covered with conducting carbon cement (Plano GmbH). A 6 nm thick platinum layer was added by sputter deposition (SCD 500 Sputter Coater, Bal-Tec AG). Measurements were performed using a SEM with a thermal field emission cathode and an Everhart-Thornley secondary electron detector at an operating voltage of 5 kV (Ultra 55, Carl Zeiss AG). Samples for cross section measurements were prepared by initially mixing 2 g of epoxy resin and 0.5 g of epoxy hardener (Buehler, ITW Test & Measurement GmbH) and adding a few drops of the mixture to a small amount of cathode powder in a gelatine capsule, followed by 2 min of mixing with a spatula. Afterwards, the slurries were cast onto an Al-foil using a manual coater with a gap size of 0.5 mm and dried in an oven (Heraeus Holding GmbH) at 40 °C over night. Smaller sections were prepared with a scalpel, mounted on a customized mask and aligned with an optical microscope. Then, the samples were transferred to an ion milling system (ArBlade 5000, Hitachi, Ltd.) and cross sections were prepared by milling with an Ar ion beam at an operating voltage of 6 kV for two hours. Images were taken as described above for the top view measurements.
Image segmentation
An automated SEM image segmentation method was used to quantify the primary particle size distribution of the CAMs. Details on the algorithm and the criteria, that were used for primary particle segmentation, were published in a recent report. 21 The size of a primary particle was quantified by taking the area of the particle after segmentation and calculating the diameter of a circle with the same area ("equivalent diameter"). Ten top view SEM images in 20 k magnification were measured for each CAM after the main calcination to have a sufficient amount of particles for proper statistical evaluation. More than 1000 primary particles per sample were analyzed.
Powder X-ray diffraction
Synchrotron powder X-ray diffraction (PXRD) measurements were performed at the ALBA synchrotron. The measurements at ALBA were carried out at the BL04-MSPD beamline at a wavelength of λ = 0.62001 Å (calibrated using a Si NIST standard) using a Si 111 monochromator and the MYTHEN II position sensitive detector in 2θ angular range of 2°−82°. The LNO samples were filled in borosilicate capillaries of 0.7 mm diameter, sealed by flame, and mounted on a spinning sample holder. Data were collected in Debye–Scherrer geometry for 27 different positions of the detector, and a long data acquisition time of 30 s was chosen for each position in order to obtain high intensity patterns. For the partially-lithiated samples, the angular positions of impurity phases were compared to the calculated diffraction patterns of LiOH and Li2CO3 and the relative peak intensities will be discussed qualitatively.
Rietveld refinement was done using the Fullprof software package. For each sample a new background for the measured diffraction pattern was determined with the WinPLOTR software and corrected by visual inspection. The refinements were based on a hexagonal α-NaFeO2 structure with the R−3m space group. The instrumental broadening was determined by measuring a NAC (Na2Ca3Al2F14) standard in the same sample configuration. The model used for the fitting is based on Thompson-Cox-Hastings pseudo-Voigt convoluted with axial divergence asymmetry functions. Refinement of the parameters of the structural model was done for consecutive iteration cycles until convergence was reached and the quality of the fit was checked by inspection of Rwp (weighted profile factor with all non-excluded points) and RBragg (Bragg R-factor) as well as χ 2 (reduced chi-square). Two different structural models were used for the refinement.
For the first model in the final iteration step 12 parameters were refined: scale factor, zero shift, a and c unit cell parameters, U, X, Y as parameters of the Gaussian (U) and Lorentzian (X, Y) contribution to the pseudo-Voigt function, fractional atomic coordinate of oxygen zox , occupancy of Ni on Li site (assuming site remains fully occupied), Biso (isotropic displacement parameter) of O, Ni and of Li. According to the recent report of Yin et al., Li and O were treated using the ionic form factors while the atomic form factor was applied for Ni, which was shown to be reasonable in our recent report on a large set of LiNiO2 samples. 22
The second model takes anisotropic size effects into account by using additional parameters. In this case, the Lorentzian part of the peak broadening is modeled with linear combinations of spherical harmonics (Y00, Y20, Y40, Y43-, Y60, Y63+ and Y66+) as discussed in the report of Casas-Cabanas et al. on the microstructure of Ni(OH)2. 23
X-ray photoelectron spectroscopy (XPS)
XPS analyses were performed for the Ni(OH)2 precursor, for the partially-lithiated sample with 1.01 Li equivalents per mol of Ni, that was subjected to 500 °C and a dwell time of one hour in the rotary kiln, and the respective partially-lithiated sample with an increased temperature of 600 °C. All samples were prepared in an Ar-filled glovebox. The powders were compacted in Teflon cups, which were then attached to the sample holder with non-conductive adhesive tape. The samples were transferred under an Ar atmosphere from the glovebox into the XPS instrument (PHI5000 Versa Probe II, Physical Electronics Inc.) using a transfer vessel for PTS holders by PREVAC. For the analysis, monochromatic Al Kα radiation was used (1486.6 eV). The power of the X-ray source was 50 W and the beam voltage was 17 kV. The diameter of the beam was 200 μm. The pass energy of the analyzer was set to 46.95 eV for all detail spectra. A dual-beam charge neutralization was applied during the measurements. For data evaluation, all spectra were calibrated in relation to the signal of adventitious carbon at 284.8 eV.
Transmission electron microscopy (TEM)
TEM samples were prepared using a focused ion beam—scanning electron microscopy (FIB-SEM) system (JIB-4601F, JEOL GmbH). The samples were first coated with a thin layer of Pt (∼ 100 nm) using a sputter coater prior to loading them to the FIB-SEM to avoid any damage from the electron and the Ga-ion beam. The selected particles were then further protected by first depositing the carbon layer and then tungsten layers using a Ga-ion beam. The sample was first thinned with a 30 kV Ga-ion beam to around 500 nm thickness and then further thinned with a 5 kV Ga-ion beam.
Images and scanning-precession electron diffraction data (SPED) were taken with a TEM (JEM 3010, JEOL GmbH) equipped with the ASTAR system (NanoMEGAS SPRL). The microscope was operated at 300 kV. The SPED 4D datasets were taken under low-dose conditions, i.e., by selecting the smallest condenser lens aperture and the lowest current possible at this microscope. The dataset was taken with a step size of 15 nm, with the beam having a probe size of around 11 nm. A precession angle of 0.25 degrees was used and the PED patterns were analyzed using ASTAR's indexing software. 24,25 For this purpose, first, a library of simulated diffraction patterns from the candidate phases LiOH, Li2O, and Li2CO3 were produced in different orientations. The best matches from the simulated data were found using template matching, which are illustrated in Fig. S6 (available online at stacks.iop.org/JES/169/050526/mmedia) (supplementary information).
Electrochemical characterization
Electrodes for electrochemical characterization were prepared by mixing the CAM powders with conductive carbon (C65, Imerys Graphite & Carbon) and PVDF binder (Solef 5130, Solvay GmbH) in a 94:3:3 mass ratio. For this, a 7.5 wt% binder solution in N-methyl-2-pyrrolidone (NMP, BASF SE) was mixed with additional NMP and the conductive carbon, and mixed for at least 24 min at 2000 rpm in a planetary mixer (ARE 250, Thinky Corporation). The CAM powders were added to the obtained slurry and were mixed for additional 10 min. The solid fraction of the final slurries was 61 wt%. The slurries were cast onto an Al-foil (thickness 20 μm, Nippon Light Metal Co., Ltd.) using a box-type coater (wet-film thickness 100 μm, width 6 cm, Erichsen GmbH & Co. KG) and an automated coating table (5 mm s−1, Coatmaster 510, Erichsen GmbH & Co. KG). The coated tapes were placed in a vacuum oven (VDL 23, Binder GmbH) and dried at 120 °C under dynamic vacuum for 12 h. The dried cathode tapes were compressed using a calender (CA5, Sumet Systems GmbH) at a set line-force of 30 N mm−1 and a roller speed of 0.5 m min−1. Circular electrodes with a diameter of 14 mm were punched out using a high-precision handheld punch (Nogamigiken Co., Ltd.). After weighing, the electrodes were transferred to an Ar filled glovebox for cell assembly. An average loading of (8.0 ± 0.5) mg cm−2 and an electrode density of (3.0 ± 0.2) g cm−3 were obtained. Coin half-cells were built using a 2032 coin cell geometry. The cell stack consisted of the cathode, a glass fiber separator (ø 17 mm, 300 μm thickness, GF/D, VWR International, LLC.) soaked with 95 μl electrolyte (LP57, BASF SE) and a pre-punched Li anode (ø 15.8 mm, thickness 0.58 mm, purity 99.9%, Shandong Gelon LIB Co., Ltd.). After assembly the cells were closed in an automated crimper (Hohsen Corp.). The cells were then transferred to a climate chamber (Binder GmbH) and connected to a battery cycler (Series4000, MACCOR, Inc.). All tests were performed at 25 °C and the C rates were defined according to 1C = 200 mAg−1.
Results and Discussion
Pathway of the lithiation reaction
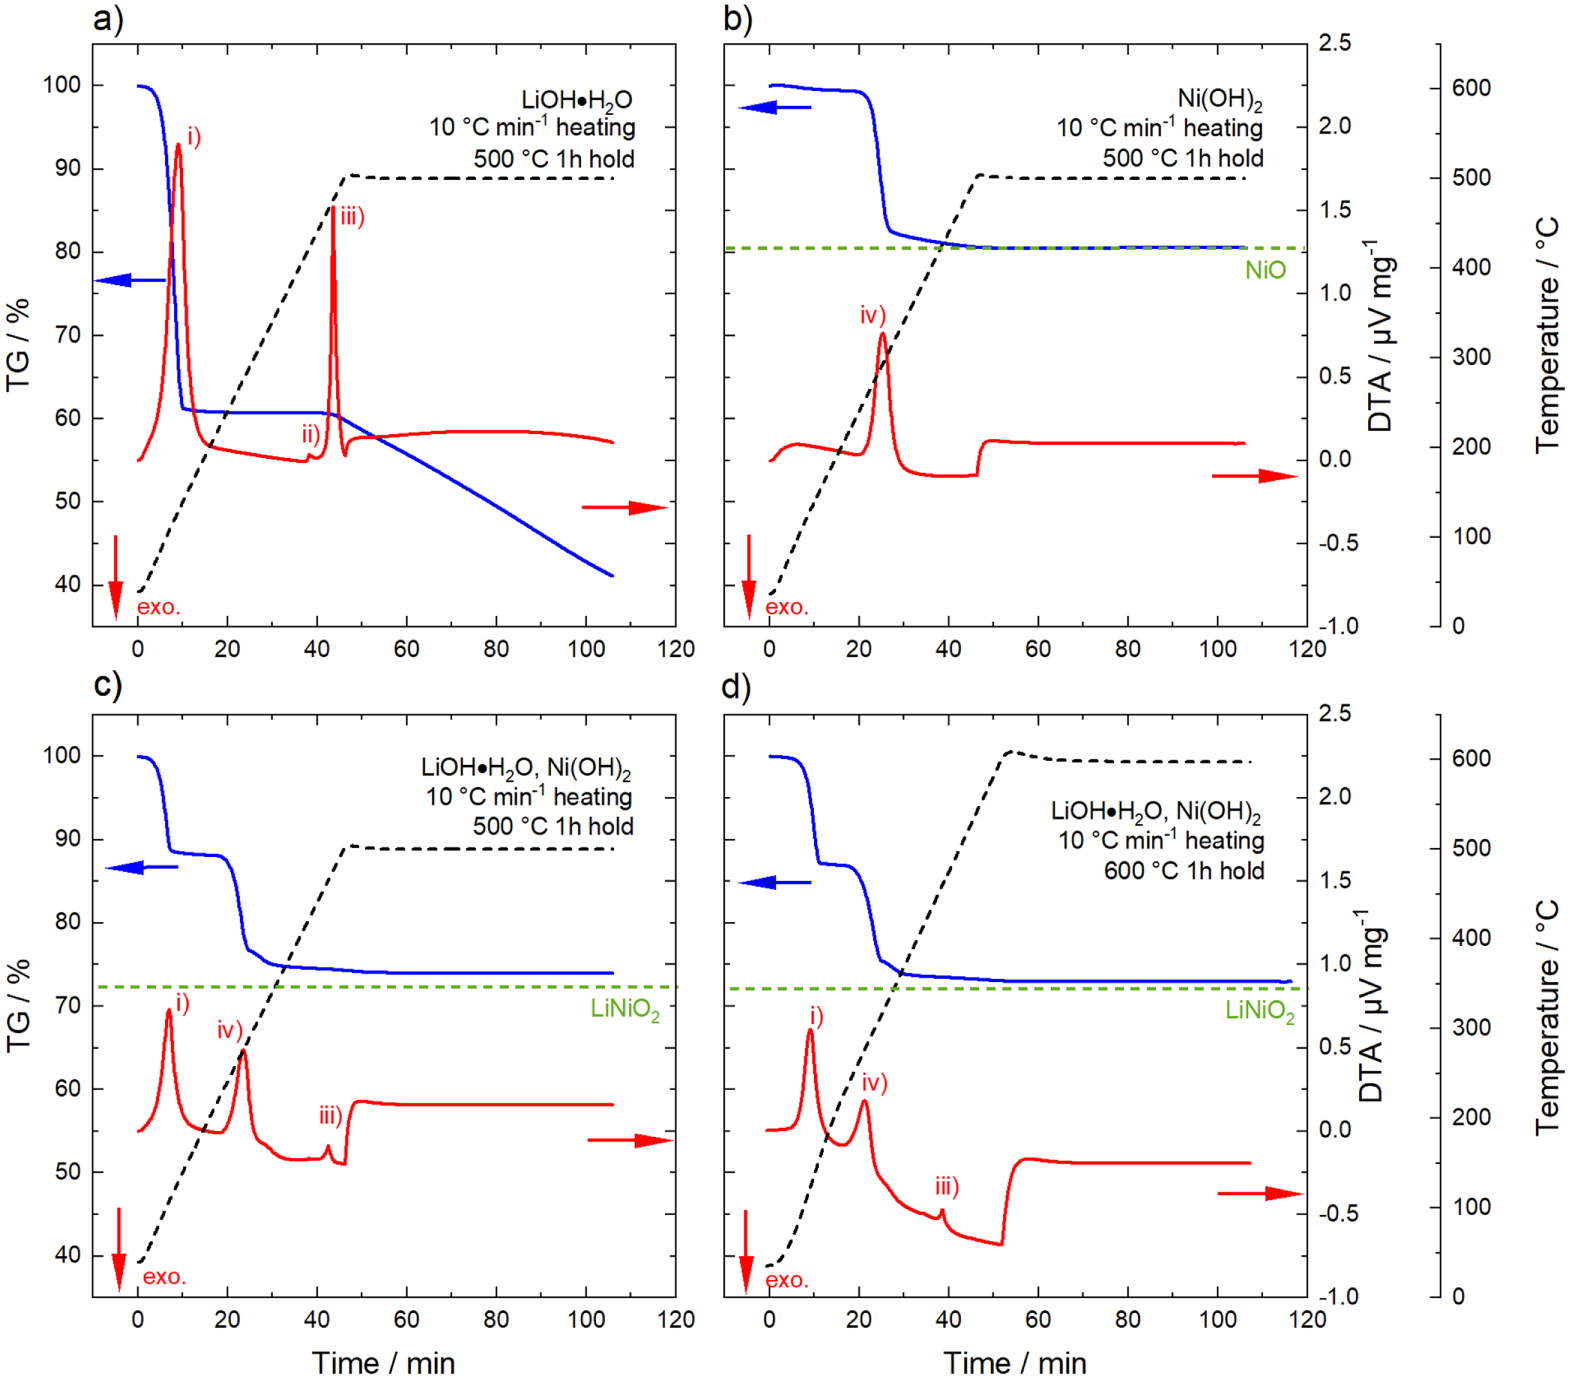
Many reports have dealt with the synthesis of LiNiO2 made via a solid-state route starting from a Li source (LiOH·H2O, Li2CO3, Li2O2, LiNO3) and various Ni salts (Ni(OH)2, NiO, Ni(NO3)2·6 H2O). 20,26–30 Several studies used thermogravimetric analysis to resolve the different processes occuring during the calcination reaction and to monitor onset temperature and speed of the reactions. 17,31–33 Prior to the partial-lithiation experiments with its modified temperature profile compared to the one-stage calcination, thermogravimetry and differential thermal analysis (TG-DTA) was performed. Figure 2a shows the results for LiOH·H2O heated at a rate of 10 °C min−1 to 500 °C and a dwell time of one hour. Already around 100 °C, a first significant mass loss is observed concomitant with an endothermic peak in the DTA curve, which is related to the loss of water of crystallization and the formation of anhydrous LiOH. On further heating, a small endothermic peak occurs around 420 °C, associated with the melting of the eutectic mixture of LiOH and Li2CO3 (small fraction of Li2CO3 impurities is likely to be present in the Li source). 34 No further mass loss is observed until the temperature reaches ∼ 450 °C, where a third endothermic peak in the DTA signal arises, which is related to the melting and decomposition of LiOH. During the following one hour dwell time at 500 °C, a continuous mass loss is observed, which is due to the continuous decomposition of LiOH into Li2O accompanied by the release of H2O. 35 Note that the temperature, where the transformation to Li2O starts, strongly depends on the partial pressure of water pH2O in the surrounding atmosphere. It has been reported that for low pH2O the transition to Li2O occurs before the melting point of LiOH, whereas at increased pH2O the transition to Li2O starts from liquid LiOH. 36 The TG-DTA measurements were performed with a fast heating rate of 10 °C min−1 and thus the start of the transition to Li2O coincides with the endothermic DTA peak related to the melting of LiOH.

Figure 2. TG-DTA measurements illustrating the chemical reactions that occur during lithiation. (a) LiOH·H2O heated with 10 °C min−1 to 500 °C with a dwell time of one hour, (b) Ni(OH)2 heated with 10 °C min−1 to 500 °C with a dwell time of one hour, (c) mixture of LiOH·H2O and Ni(OH)2 (1.01 Li equivalents per mol of Ni) heated with 10 °C min−1 to 500 °C with a dwell time of one hour and (d) mixture of LiOH·H2O and Ni(OH)2 (1.01 Li equivalents per mol of Ni) heated with 10 °C min−1 to 600 °C with a dwell time of one hour. Thermogravimetric analysis (TG, blue line) on the left y-axis, differential thermal analysis (DTA, red line) and temperature (black dashed line) on the right y-axis. The chemical reactions are marked in the DTA data: (i) formation of anhydrous LiOH, (ii) melting of eutectic mixture of LiOH and Li2CO3, (iii) melting and decomposition of LiOH to Li2O and (iv) conversion of Ni(OH)2 to NiO. For the formation of NiO and LiNiO2, the theoretical mass loss after complete conversion is indicated by the green dashed lines. The measurements were performed under O2 atmosphere. The direction of an exothermic process is indicated by a red arrow.
Download figure:
Standard image High-resolution imageFigure 2b shows the results for the Ni(OH)2 precursor using the same temperature profile. After a small mass change < 1% up to 200 °C, which is most likely related to the loss of enclosed residual H2O in the layers of the Ni(OH)2 crystal structure, a rapid mass loss is observed between 230 °C and 310 °C. This mass loss slows down on further heating and no additional changes in the TG curve can be seen during the 500 °C hold. The change in mass is related to the conversion of Ni(OH)2 to NiO with a theoretical mass loss of 19.4%. 37,38 This coincides well with the observed mass loss of 19.5% before the holding step at 500 °C and indicates a completed conversion reaction. Thus, pure NiO is present at this point.
Figure 2c depicts the respective measurement of a mixture of Ni(OH)2 and LiOH·H2O with 1.01 Li equivalents per mol of Ni. The same features in the TG-DTA data (formation of anhydrous LiOH, conversion of Ni(OH)2 to NiO, melting of LiOH) are observed as for the separated educts, although the resulting plot is not only a superposition of the previous reactions. The formation of LNO, starting from the used base materials, is given by the reaction in Eq. 1.

For a complete reaction to LiNiO2, a total mass loss of 27.5% is expected. The total mass loss observed after the one hour dwell at 500 °C was determined to be 25.9%, which means that the lithiation reaction is not completed under these conditions. Repeating the experiment with a dwell time of one hour at 600 °C (Fig. 2d) yields a total mass loss of 27.0% due to a faster reaction at higher temperature, but still the lithiation is not completed.
It must be underlined that the experimental conditions of the TG-DTA measurements do not fully resemble the ones used in the laboratory calcination. Thermal analysis experiments were performed with 60 mg samples in contrast to the laboratory calcination with 60 g sample amount. Moreover, TG-DTA measurements were performed in a furnace with a volume of 100 ml and a gas flow rate of 100 ml min−1, which corresponds to a higher volume exchange rate compared to a calcination in a conventional box furnace (∼ 10 furnace-volume exchanges per hour). It has been reported that the O2 flow rate has a significant impact on the structural chemistry of LNO, although different reagents and different temperature profiles were used compared to this study. 39 Depite these deviations, the thermal analysis measurements demonstrate the chemical reactions which are expected during a partial-lithiation step on the laboratory-scale and the results will be used in the following discussion.
Comparison between fixed-bed and agitated-bed partial-lithiation
Partially-lithiated samples were prepared by either mixing Ni(OH)2 with either 80% or with 100% of the amount of LiOH·H2O to obtain 1.01 Li equivalents per mol of Ni. Furthermore, this step was performed under fixed-bed conditions in a box furnace and compared to an agitated-bed process in the metal bulb of a rotary kiln. For the initial experiments, a partial-lithiation temperature of 500 °C, which is well above the melting point of LiOH (Tmelt ∼ 460 °C), and a dwell time of one hour were chosen.
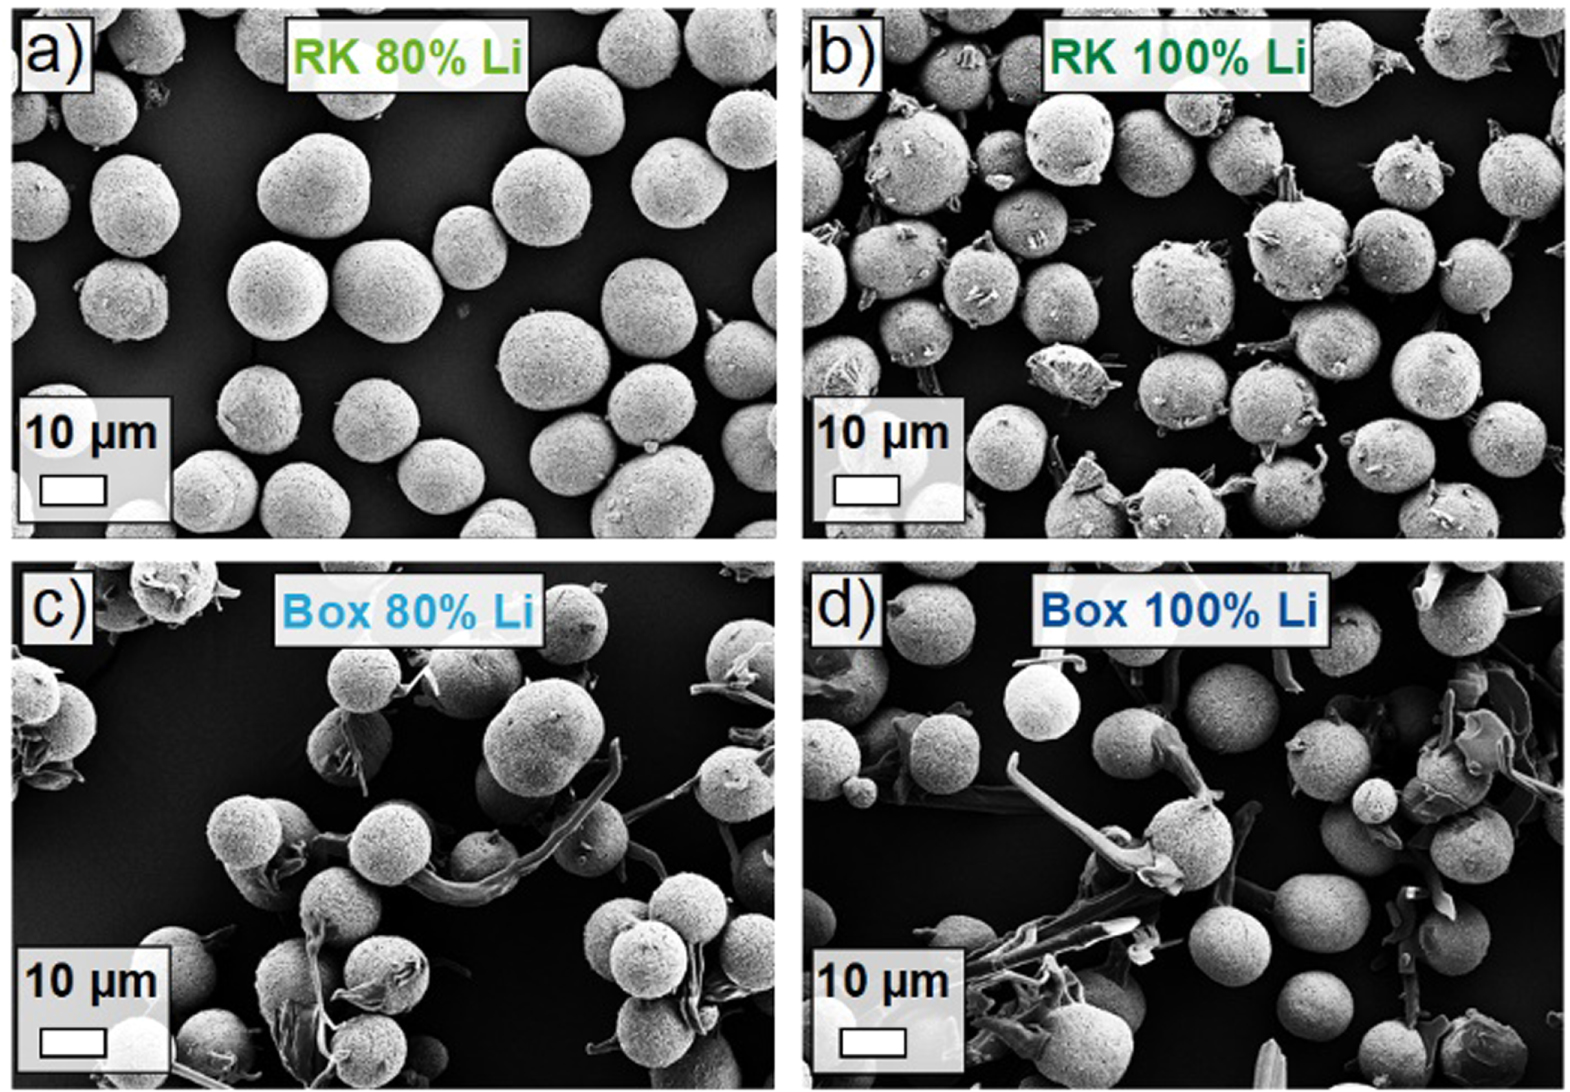
Figure 3 shows top view SEM images in 1 k magnification of the samples synthesized according to the described procedure. The precursor appears as roughly spherical secondary particle agglomerates, which consist of smaller primary particles with sizes of a few hundred nm. The samples prepared under fixed-bed conditions (Figs. 3c and 3d) show large needle-like lithium-containing residuals, which are attached to the surface of the precursor secondary particles and can grow to several tens of μm in size (it will be rationalized below that the needles are pure LiOH). Obviously, in this case the lithiation reaction is not fully completed and it can be assumed that during cooling of the partially-lithiated materials to room temperature, the formerly molten LiOH recrystallizes in the observed manner.
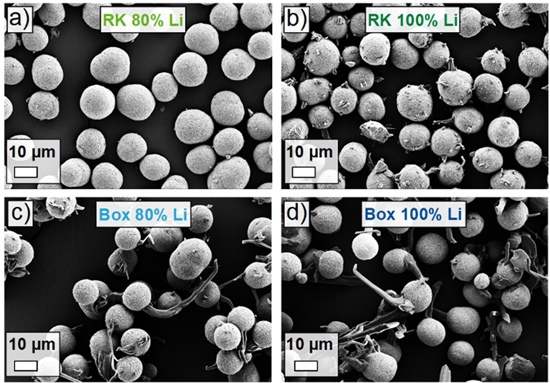
Figure 3. Top view SEM images in 1 k magnification of the samples after a partial-lithiation step at 500 °C and a dwell time of one hour using either the rotary kiln setup (RK) or the box furnace (Box). (a) RK partially-lithiated sample using 80% of the Li amount required to obtain 1.01 Li equivalents per mol of Ni, (b) RK partially-lithiated sample using 100% of the Li amount, (c) box partially-lithiated sample using 80% of the Li amount and (d) box partially-lithiated sample using 100% of the Li amount. The length of the white bar equals 10 μm.
Download figure:
Standard image High-resolution imageThe sample partially-lithiated with 100% (stoichiometric) Li amount using the rotary kiln setup also shows residuals of the Li source on top of the secondary particles. However, these lithium-containing residuals do not occur as large needles but rather a small spikes. This can be attributed to the rotational movement of the rotary kiln, which can cause the needles to break during the cool-down period. Nevertheless, also in this case the lithiation reaction is not finished. In contrast to the previous observations, for the sample partially-lithiated with 80% (stoichiometric) Li amount using the rotary kiln setup, no large lithium-containing residuals are observed. This suggests that under these conditions (not all lithium added yet, 500 °C with one hour dwell time and rotational movement), the lithiation of the precursor secondary particles has progressed to a large extent. Figure S1 (Supplementary Information) shows the respective top view SEM images in 20 k magnification. The thread-like surface structure of the Ni(OH)2 precursor is maintained to a large extent and no noteworthy crystallite growth is observed yet.
Analytical data of the samples after the partial-lithiation step are summarized in Table I. The results of the ICP-OES measurements reveal that the targeted numbers of Li equivalents are obtained and that no loss of lithium occurs independent of the used furnace concept. The acid titration measurements show that the weight fractions of LiOH and Li2CO3 after this first heat treatment are significantly larger compared to CAMs after the main calcination step (see results in Table III). After the cool-down period and during storage, the residual LiOH will take up tiny amounts of H2O to form LiOH·H2O, at least in the near-surface region. The Li2CO3 is formed by the reaction between LiOH·H2O and CO2 from the surrounding atmosphere and the content is higher for the samples with the larger target number of Li equivalents. 40
Table I. Comparison of analytical data of samples after a partial-lithiation step at 500 °C and a dwell time of one hour for the rotary kiln (RK) and box furnace (Box) design and two different target numbers of Li equivalents per mol of Ni (0.8 and 1.01). Weight fractions of Li and Ni determined by ICP-OES, resulting number of Li equivalents, LiOH and Li2CO3 weight fractions measured by acid titration, resulting "soluble Li" weight fraction and average Ni oxidation state determined by iodometric titration.
| Sample | Li [wt%] | Ni [wt%] | Li equiv. | LiOH [wt%] | Li2CO3 [wt%] | "Soluble Li" [wt%] | Average Ni oxid. state |
|---|---|---|---|---|---|---|---|
| RK 80% Li | 5.9 | 62.6 | 0.80 | 3.07 | 0.94 | 1.07 | 2.74 |
| RK 100% Li | 7.0 | 59.7 | 0.99 | 5.29 | 1.37 | 1.79 | 2.89 |
| Box 80% Li | 5.9 | 62.9 | 0.79 | 5.37 | 0.99 | 1.75 | 2.63 |
| Box 100% Li | 7.0 | 59.6 | 0.99 | 8.91 | 1.43 | 2.85 | 2.63 |
Moreover, the amounts of soluble lithium-containing salts in form of LiOH and Li2CO3 are generally smaller for the samples partially-lithiated with the rotary kiln setup, when comparing the same target number of Li equivalents. By calculating the weight fractions of "soluble Li" (as described in the experimental section) and comparing the results to the total weight fractions of Li measured with ICP-OES, it is clearly observed that a larger fraction of Li is not incorporated under the fixed-bed compared to the agitated-bed conditions.
Note that for the sample with 80% Li added in the partial-lithiation step using the rotary kiln, a significant amount of residual salts is measured by acid titration, although no large fractions of impurities are observed on the surface of the secondary particles in Fig. 3a. This implies that also in this case the lithiation reaction is not fully completed. However, the results of the acid titration method have to be treated with caution, as will be pointed out below.
The average Ni oxidation states of the partially-lithiated samples were measured via iodometric titration. Starting from Ni(OH)2 (and later on NiO), during lithiation the oxidation state of Ni is gradually increased and for every Li+ ion incorporated in the structure, one Ni2+ has to be oxidized to Ni3+ to maintain charge neutrality. This means that for the partially-lithiated samples a Ni oxidation state between +2 and +3 is expected, with a higher oxidation state indicating a more advanced lithiation. The results in Table I demonstrate that the partial-lithiation step using the rotary kiln leads to higher Ni oxidation states compared to the reaction in the box furnace under otherwise similar conditions. Notably, the Ni oxidation state under fixed-bed conditions is the same regardless of the used target number of Li equivalents. This shows that, although a larger amount of Li source is provided, the lithiation reaction did not proceed further in this case.
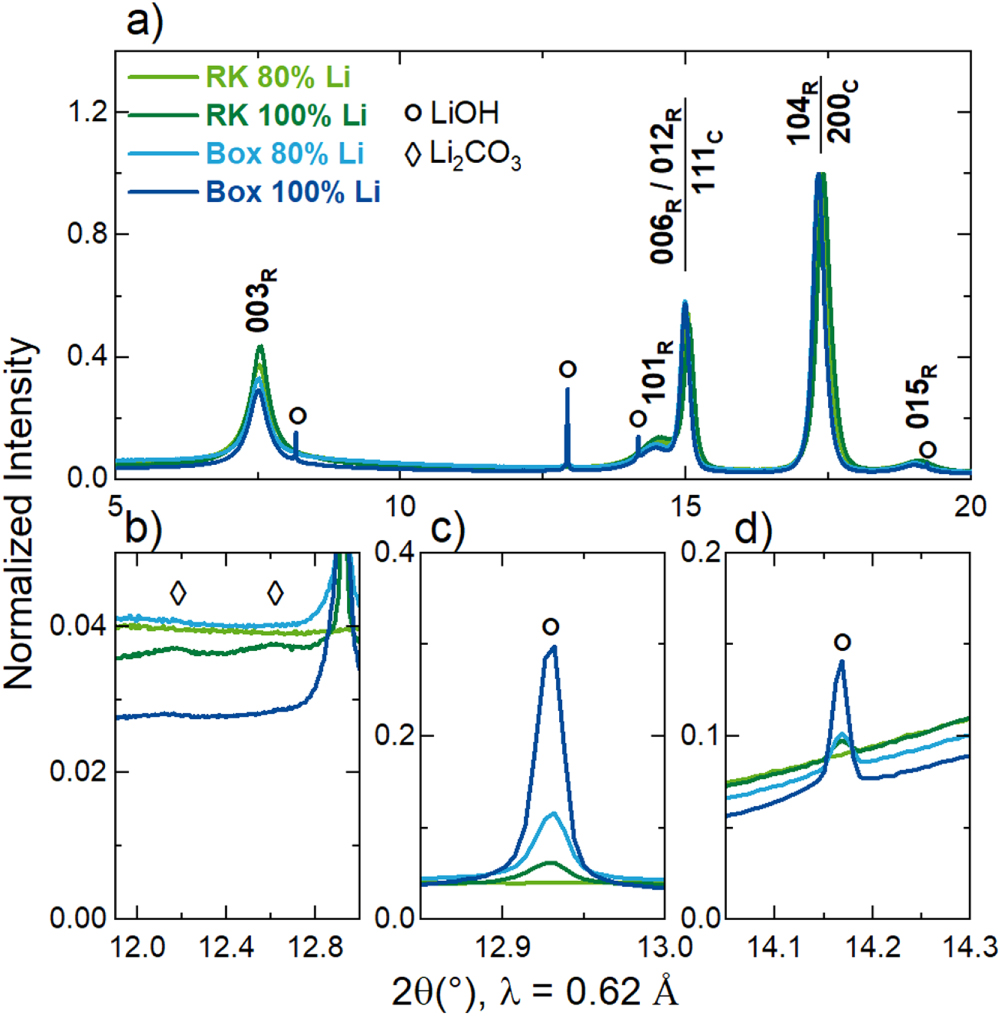
To further characterize the samples after the partial-lithiation step, synchrotron powder X-ray diffraction (PXRD) measurements were performed and the results are depicted in Fig. 4. As can be seen in the overview image (Fig. 4a), none of the partially-lithiated samples exhibits the complete rhombohedral crystal structure of LiNiO2. The dominant Bragg peaks in the PXRD patterns are the 111C and the 200C related to the cubic crystal structure of lithiated NiO, whereas the Bragg peaks of the rhombohedral LiNiO2 structure are only indicated by broad humps. Lithiated NiO can be prepared with compositions up to Li0.3Ni0.7O, where the Li ions homogeneously distribute within the Ni sublattice. 17,41 Further lithiation leads to the segregation of Li ions and Ni ions into alternating layers, which was shown to be associated with the appearance of the 003R reflection; a large integrated intensity ratio of I(003R)/I(104R) well above 1.0 indicates nearly complete layering, 26 which is not observed for the investigated samples.

Figure 4. Synchrotron powder X-ray diffraction (PXRD) patterns of the samples after a partial-lithiation step at 500 °C and a dwell time of one hour using either the rotary kiln setup (RK) or the box furnace (Box). Patterns are shown for the RK partially-lithiated sample using 80% of the Li amount required to obtain 1.01 Li equivalents per mol of Ni (light green), for the RK partially-lithiated sample using 100% of the Li amount (dark green), for the box partially-lithiated sample using 80% of the Li amount (light blue) and for the box partially-lithiated sample using 100% of the Li amount (dark blue). (a) PXRD patterns in the range of 2θ = 5° − 20° with the Bragg peaks of the rhombohedral LiNiO2 structure marked by the subscript "R" and the Bragg peaks of the cubic (lithiated) NiO structure marked by the subscript "C". (b)–(d) Magnifications of selected 2θ regions with the symbols marking peaks assigned to the lithium-containing impurities LiOH (circles) and Li2CO3 (diamonds). The data were collected at the BL04-MSPD beamline of the ALBA synchrotron at a set wavelength of λ = 0.62 Å and were normalized to the maximum intensity.
Download figure:
Standard image High-resolution imageMoreover, clear signs of impurity phases are present in the PXRD patterns, which are analyzed in more detail in Figs. 4b–4d. The dominant impurity phase found for the partially-lithiated samples is LiOH, with the magnitude showing a good correlation with the qualitative information from the SEM images and the trends observed via acid titration. The samples heat-treated in the box furnace exhibit larger contributions of the LiOH phase to the diffraction patterns compared to the agitated-bed counterparts with the sample with the larger target number of Li equivalents showing the largest LiOH peak intensities of all investigated materials. Interestingly, the partially-lithiated sample from the rotary kiln setup with 80% of the Li amount does not show any peak intensity originating from crystalline LiOH, which is well in line with the absence of lithium-containing impurities in the SEM image in Fig. 3a. Regarding Li2CO3 as second expected impurity phase, only small indications are visible for the two samples prepared with 100% Li amount.
Overall, we can state that the partial-lithiation under agitated-bed conditions using the rotary kiln setup shows a clear advantage over the fixed-bed equivalent regarding the progress of the lithiation reaction under otherwise comparable experimental conditions. However, for an industrially feasible process a second addition of Li source and an additional mixing step prior to the main calcination should be avoided. Thus, in the following section the agitated-bed process will be further investigated using 100% of the required Li amount while optimizing other parameters.
Impact of temperature and dwell time on partial-lithiation
After the benefits regarding lithiation progress under agitated-bed conditions were pointed out, the influence of partial-lithiation temperature and dwell time on the lithiation reaction were investigated. For this purpose, mixtures of Ni(OH)2 and LiOH·H2O with 1.01 Li equivalents per mol of Ni were prepared and partially-lithiated using the rotary kiln setup and a variation of temperature profiles. Top view SEM images of the mixture before heat treatment and of the partially-lithiated samples in 1 k magnification are depicted in Fig. 5. Before the heating step, Ni(OH)2 secondary particles and LiOH·H2O chunks loosely lie next to each other. In contrast, after a treatment at 400 °C and a dwell time of one hour, it is observed that the precursor particles and the LiOH are in parts "fused together" and that splinters of LiOH are attached to the surface of the Ni(OH)2 secondary particles. This indicates that the lithiation reaction already sets in between the involved solids while the temperature is still well below the melting point of LiOH. This is in good agreement with an in situ PXRD report on the synthesis of LiNiO2, where a respective mixture was preannealed at 350 °C for 12 h and significant lithiation of NiO was observed (composition determined to be Li0.22Ni0.78O). 17 For the sample partially-lithiated at 500 °C for one hour, formation of needle-like lithium-containing residuals is again observed, with some of them breaking due to the rotational movement. Increasing the dwell time to 2 h at the same temperature reduces the amount of lithium-containing residuals visible in the images significantly, although small spots of impurities still remain on top of the secondary particles. Further increasing the partial-lithiation temperature to 600 °C finally leads to a complete disappearance of visible impurities in the top view SEM images.
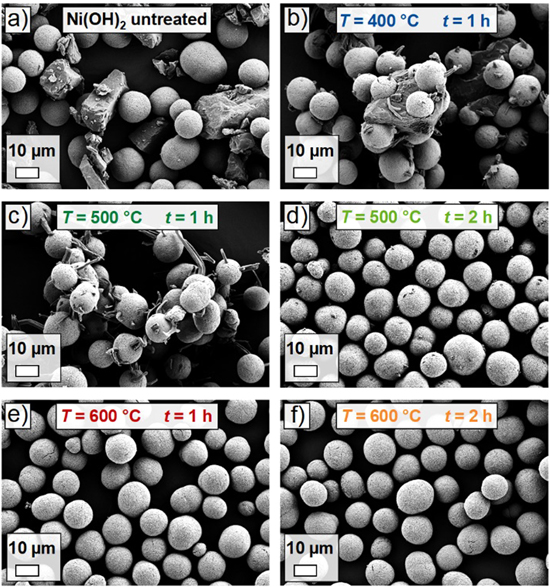
Figure 5. Top view SEM images of the samples in 1 k magnification after a partial-lithiation step using the rotary kiln setup and applying different temperatures and dwell times. (a) Mixture of LiOH·H2O and Ni(OH)2 (1.01 Li equivalents per mol of Ni) before heat treatment. (b) Partially-lithiated sample using 400 °C and a dwell time of one hour, (c) 500 °C and a dwell time of one hour, (d) 500 °C and a dwell time of two hours, (e) 600 °C and a dwell time of one hour and (f) 600 °C and a dwell time of two hours. The length of the white bar equals 10 μm.
Download figure:
Standard image High-resolution imageThe analytical properties of the samples partially-lithiated using different temperatures and dwell times are summarized in Table II. Slightly lower numbers of Li equivalents per mol of Ni were measured compared to the target value of 1.01. The trends of the fractions of soluble lithium-containing residuals that can be titrated are in very good agreement with the discussed top view SEM images in Fig. 5. The reduction of visible impurities in the images coincides with less LiOH and Li2CO3 measured via acid titration. Increasing the partial-lithiation temperature from 400 °C to 500 °C leads to a significant reduction of the "soluble Li" weight fraction. This effect is enhanced by doubling the dwell time at 500 °C. Using 600 °C during this step leads to a further reduction of measured LiOH and Li2CO3 by further progression of the lithiation reaction. A doubling of the dwell time at 600 °C shows a beneficial effect, although it is smaller as for the lower temperature case due to the already more advanced state of the reaction.
Table II. Comparison of analytical data of samples after a partial-lithiation step using the rotary kiln setup and a mixture of LiOH·H2O and Ni(OH)2 (1.01 Li equivalents per mol of Ni). Different temperatures and dwell times were applied for the partial-lithiation step. Weight fractions of Li and Ni determined by ICP-OES, resulting number of Li equivalents per mol of Ni, LiOH and Li2CO3 weight fractions measured by acid titration, resulting "soluble Li" weight fraction and average Ni oxidation state determined by iodometric titration.
| Sample | Li [wt%] | Ni [wt%] | Li equiv. | LiOH [wt%] | Li2CO3 [wt%] | "Soluble Li" [wt%] | Average Ni oxid. state |
|---|---|---|---|---|---|---|---|
| 400 °C 1 h | 6.6 | 57.4 | 0.97 | 13.93 | 0.80 | 4.19 | 2.46 |
| 500 °C 1 h | 6.8 | 58.2 | 0.99 | 6.13 | 1.62 | 2.08 | 2.82 |
| 500 °C 2 h | 6.7 | 58.0 | 0.98 | 4.00 | 1.58 | 1.46 | 2.94 |
| 600 °C 1 h | 6.8 | 58.8 | 0.98 | 1.53 | 1.32 | 0.69 | 2.94 |
| 600 °C 2 h | 6.9 | 58.8 | 0.99 | 1.45 | 1.17 | 0.64 | 2.98 |
These observations are corroborated by the measured average Ni oxidation states. A one hour partial-lithiation step at 400 °C results in an average Ni oxidation state of 2.46, which means that barely half of the intended stoichiometric amount of Li is indeed incorporated. The heat treatment at 500 °C and a dwell time of one hour leads to a Ni oxidation state of 2.82, with a further increase to 2.94 when either doubling the dwell time at 500 °C or increasing the temperature to 600 °C. The highest Ni oxidation state of 2.98 is found for the sample partially-lithiated at 600 °C with a dwell time of two hours.
Interestingly, two samples with an identical average Ni oxidation state ("500 °C 2 h" and "600 °C 1 h") show a large difference in the weight fraction of "soluble Li" (1.46 wt% and 0.69 wt%, respectively). We suggest that this can be explained by the disordered crystal structure and small crystallites prone to surface reactions at this early stage of material synthesis. Figure S2 (Supplementary Information) shows representative top view SEM images of the samples after the partial-lithiation step in 20 k magnification and the impact of partial-lithiation temperature and dwell time can clearly be seen. After the heat treatment at 400 °C for one hour, the thread-like structure of the precursor is still maintained to a large extent. Cavities occur, which are related to the densification from Ni(OH)2 to NiO. Increasing the partial-lithiation temperature to 500 °C leads to the emergence of small crystallites, which are growing in size when 600 °C is applied during this step, although still in the range of only a few tens of nm. Cross section SEM images in Fig. S3 (Supplementary Information) confirm that the discussed observations are not confined to the surface but rather extend into the bulk of the secondary particles.
As discussed in the literature, exposing CAM to H2O can lead to leaching of Li from the near-surface lattice via the proton exchange reaction depicted in Eq. 2. 42,43

This contributes to the overall LiOH content, which is measured by the used titration method. The experimental conditions for the dispersion in deionized H2O were kept constant, but a larger contribution from the leached Li is expected for the "500 °C 2 h" sample compared to the "600 °C 1 h" sample due to the smaller crystallite size (higher surface-to-volume ratio).
To further corroborate the discussed results, PXRD measurements were performed and the outcome is shown in Fig. 6. Significant differences between the samples are observed in the overview image in Fig. 6a. The transition from a lithiated rocksalt-type NiO to the rhombohedral phase of LiNiO2 is clearly measurable when the partial-lithiation temperature profile is adjusted. For the sample partially-lithiated at 400 °C and a dwell time of one hour, large peaks from LiOH impurities can be seen. Instead of a well-defined 003R Bragg peak, a blurred low-intensity signal is observed. Other than that, the 111C and 200C peaks of the cubic phase dominate the PXRD pattern. Increasing the temperature during this step to 500 °C leads to an increase in intensity of the 003R peak and indications of additional Bragg peaks related to the rhombohedral phase, e.g. 101R and 015R. Furthermore, the Bragg peaks formerly corresponding to the solely cubic phase shift to higher diffraction angles as the formation of the rhombohedral LiNiO2 structure proceeds. For the samples partially-lithiated at 600 °C, the transition to the rhombohedral phase has further progressed and the peaks become more defined as the crystallite size increases. However, it must be underlined that the formation of a perfectly layered LiNiO2 crystal structure is not yet reached, which can be concluded, e.g., from the integrated intensity ratio I(003R)/I(104R) not being well above 1.0 and from the absence of characteristic peak splittings, e.g. of the 006R and 012R peaks. Furthermore the overall background in the PXRD patterns of the 600 °C partially-lithiated samples is still high, which we attribute to amorphous lithium-containing impurity phases on top of the secondary particles and indicate an incomplete crystallization. Minor contributions of Li2CO3 to the PXRD pattern can be seen for the samples heat-treated at 500 °C in the magnified image in Fig. 6b, whereas no signs of crystalline Li2CO3 are present for the samples partially-lithiated at 600 °C. Figures 6c and 6d show that crystalline LiOH is only present for the samples partially-lithiated at 400 °C and 500 °C and a dwell time of one hour.
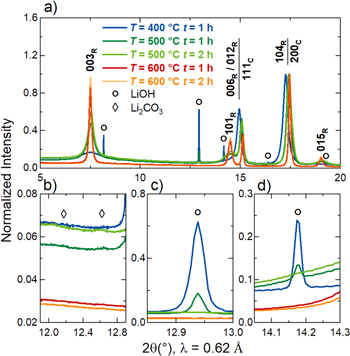
Figure 6. Synchrotron powder X-ray diffraction (PXRD) patterns of the samples after a partial-lithiation step using the rotary kiln setup (RK) and applying different temperatures and dwell times. Patterns are shown for the RK partially-lithiated samples using 100% of the Li amount required to obtain 1.01 Li equivalents per mol of Ni with 400 °C and a dwell time of one hour (blue), 500 °C and a dwell time of one hour (dark green), 500 °C and a dwell time of two hours (light green), 600 °C and a dwell time of one hour (red) and 600 °C and a dwell time of two hours (orange). (a) PXRD patterns in the range of 2θ = 5°−20° with the Bragg peaks of the rhombohedral LiNiO2 structure marked by the subscript "R" and the Bragg peaks of the cubic (lithiated) NiO structure marked by the subscript "C". (b)–(d) Magnifications of selected 2θ regions with the symbols marking peaks assigned to the lithium-containing impurities LiOH (circles) and Li2CO3 (diamonds). The data were collected at the BL04-MSPD beamline of the ALBA synchrotron at a set wavelength of λ = 0.62 Å and were normalized to the maximum intensity.
Download figure:
Standard image High-resolution imageTo confirm the composition of the needle-like lithium-containing residuals from the incomplete lithiation reaction, they were further investigated by X-ray photoelectron spectroscopy (XPS) with the results depicted in Fig. S4 (Supplementary Information). Three samples were investigated: the untreated Ni(OH)2 precursor (black), the partially-lithiated sample using the rotary kiln setup, 500 °C and a dwell time of one hour (green) and the RK partially-lithiated sample using 600 °C and a dwell time of one hour (red). The Ni(OH)2 serves as a reference without Li, the 500 °C partially-lithiated sample was chosen as it exhibits lithium-containing residual needles and the 600 °C counterpart as in this case there are no residual impurities visible in the SEM image (Fig. 5). The C 1 s spectra of all three samples show one signal at 284.8 eV from adventitious carbon contamination. A second signal is visible in the binding energy range of carbonates at around ∼ 289 eV. For the lithiated samples, this signal can mainly be attributed to Li2CO3, 44,45 while the carbonate fraction is observed to be very similar for both samples. Since the sample partially-lithiated at 500 °C displays the lithium-containing residual needles and the 600 °C sample does not, Li2CO3 can be excluded as the origin of this surface impurity phase. In the case of the Ni(OH)2 reference, the second C 1 s signal most likely stems from carbonate impurities from the precipitation process (the carbon content of the precursor was determined to be 0.13 wt% by elemental analysis). 46,47
The Ni 2p spectra reveal significant differences between Ni(OH)2 and the heat-treated samples, which can be attributed to the progressive oxidation of Ni2+ to Ni3+ during the lithiation reaction. However, since there is almost no difference in the Ni 2p spectra between the two partially-lithiated samples (consider the detection limit of the XPS), no absolute values/fractions for the Ni oxidation states can be obtained with this setup.
The Li 1 s spectra of the partially-lithiated samples are mainly composed of two contributions: one signal at a binding energy of 55.0 eV and one at a binding energy of 53.8 eV. Otto et al. investigated the Li 1 s region for a set of lithium-containing compounds and according to this study the signal at 55.0 eV can be attributed to LiOH and/or Li2CO3. 48 Moreover, the signal at 53.8 eV binding energy can be related to the lattice Li in LiNiO2. 49 It is observed in Fig. S4 that the relative contribution of LiOH/Li2CO3 to the Li 1 s spectrum decreases and the contribution of LiNiO2 increases, when the partial-lithiation temperature is raised from 500 °C to 600 °C. The same behaviour is found for the O 1 s spectra, where the contribution of LiOH/Li2CO3 at ∼531.5 eV decreases with a concomitant increase of the contribution of LNO at ∼528.7 eV. In principle, Li2O could also be involved as its Li 1 s and O 1 s binding energies overlap with the ones of LiNiO2 and the TGA results revealed that decomposition of LiOH to Li2O is indeed happening. We did not find any indication of a crystalline Li2O phase in the PXRD patterns, but small amounts of Li2O would be difficult to detect by XRD and the reaction with trace amounts of H2O to form LiOH is expected to be fast.
Transmission electron microscopy (TEM) measurements were performed to conclusively clarify the structure of the lithium-containing residual needles. The sample preparation is depicted in Fig. S5 (Supplementary Information). Figure 7a shows a TEM image of the interface between a lithium-containing residual needle and the precursor secondary particle. Figure 7b is a scanning-precession electron diffraction virtual bright-field (SPED-VBF) image from a 4D dataset taken from the position marked by the red rectangle in Fig. 7a. Figures 7c and 7d depict the PED patterns from two positions marked in Fig. 7b. They are successfully matched with simulated PED patterns from LiOH phase (the matching procedure is described in Fig. S6). It is important to note that the two PED patterns are exemplarily shown in Figs. 7c and 7d to illustrate the phase identification and corresponding matching procedure. The PED patterns from all the pixels from the bright contrast area in the SPED-VBF image in Fig. 7b are successfully matched with the LiOH phase, showing that the lithium-containing residual needles solely consist of LiOH. We also acquired SPED 4D datasets at other positions and found the same result.
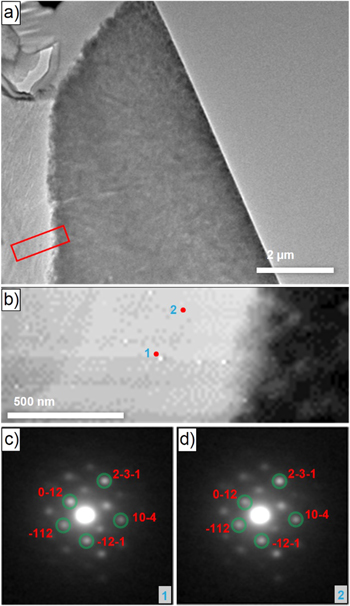
Figure 7. Transmission electron microscopy (TEM) was used for the phase identification of the lithium-containing residual needles. (a) Image of the interface between the precursor secondary particle (right) and one of the needles (left). (b) Scanning-precession electron diffraction virtual bright-field (SPED-VBF) image from the area marked with the red rectangle in (a). The SPED-VBF image was constructed from 4D datasets, which means that at each pixel in (b), there is a 2D-precession electron diffraction (PED) pattern that can be matched with the candidate phases for phase identification. The bright contrast on the left of this image is the residual needle and the dark contrast on the right are primary particles from the precursor secondary particle. (c) and (d) PED patterns from positions 1 and 2 in (b), respectively. The diffraction patterns were matched with the LiOH phase (marked by green circles). The miller indices of some of the exemplary spots/reflections are also marked. The length of the white bar equals 2 μm and 500 nm in (a) and (b), respectively.
Download figure:
Standard image High-resolution imageTo the best of our knowledge, this is the first report on the composition of the lithium-containing residual needles. By combination of PXRD, XPS and SPED-VBF, Li2CO3 and Li2O were excluded and the presence of LiOH was confirmed.
Comparison of LNO samples after main calcination step
The materials prepared for the comparison between fixed-bed and agitated-bed partial-lithiation were afterwards subjected to a main calcination step. For this purpose, LiOH·H2O was added to the intermediate samples to compensate for the Li deficiency, such that 1.01 Li equivalents per mol of Ni were achieved. The mixtures were then calcined at 700 °C for six hours in a box furnace. Additionally, a "one-step reference" sample was prepared by using a standard temperature profile with a hold at 400 °C for four hours and a second hold at 700 °C for six hours without an intermediate cool-down or a second mixing step (see Fig. 1).
Recently, we introduced an automated SEM image analysis approach to quantify the primary particle size distribution of LNO after calcination. 21 This method was applied to the samples prepared in this study and the results are shown in Fig. 8. Figures 8a and 8b show an exemplary SEM image in 20 k magnification before and after the automated segmentation, respectively. The primary particle size distributions are depicted in Fig. 8c by means of the equivalent diameter defined in the experimental section. No large differences are observed concerning the median primary particle size Q0.5 and the width of the size distribution between the two samples calcined following the box furnace partial-lithiation and the one-step reference. In contrast, the two CAMs prepared from the samples partially-lithiated using the rotary kiln show slightly smaller median primary particle sizes and also a narrower size distribution. As discussed, the agitated-bed partial-lithiation with the rotary kiln setup leads to a faster lithiation of the secondary particles and thus less residual LiOH remains compared to the samples heat-treated in the box furnace as observed in Fig. 3. Molten LiOH can support the crystal growth and the fact that a smaller fraction of it is involved in the rotary kiln partially-lithiated samples during the main calcination can be one possible explanation for the slightly smaller primary particle sizes.

Figure 8. SEM image analysis of the calcined CAM. Top view SEM image of one exemplary sample (a) before primary particle segmentation and (b) after the segmentation. The length of the white bar equals 1 μm. (c) Primary particle size distributions obtained by automated SEM image analysis. Ten images in 20 k magnification of individual secondary particles were analyzed per sample. Results are shown for the calcined samples made from the RK partially-lithiated sample using 80% of the Li amount required to obtain 1.01 Li equivalents per mol of Ni (light green), from the RK partially-lithiated sample using 100% of the Li amount (dark green), from the box partially-lithiated sample using 80% of the Li amount (light blue), from the box partially-lithiated sample using 100% of the Li amount (dark blue) and for the one-step reference sample (gray). The particle size distributions are depicted as violin plots with the y-axis showing the equivalent diameter and the width in x-axis direction indicating the probability density distribution as a kernel smoothed histogram. The boxes indicate the median as well as the 25% and 75% percentiles, with the whiskers extending to the 10% and 90% percentiles. The median values Q0.5 are shown as numbers as well.
Download figure:
Standard image High-resolution imageAnalytical data of the samples after the main calcination step are summarized in Table III. The number of Li equivalents per mol of Ni determined by ICP-OES is very similar for all samples and close to the intended value of 1.01. Moreover, the weight fractions of soluble lithium-containing residuals (as determined by titration) of the CAMs prepared using the partial-lithiation step are comparable to the results of the one-step reference ("soluble Li" weight fraction of ∼0.4 wt% for all investigated samples). The average Ni oxidation states of the partially-lithiated samples after the main calcination are very close to +3, although a slightly higher value was obtained for the one-step reference. The reference sample was investigated by iodometric titration immediately upon preparation, whereas the partially-lithiated samples were stored for some time prior to the measurement. Although the samples were stored in an air-tight box inside a dry room, LiNiO2 already reacts with trace amounts of moisture (occuring e.g. during sample bottling) and decomposes to a lithiated rock salt-type phase over time, which leads to a decrease of the Ni oxidation state.
Table III. Comparison of analytical results after the main calcination of samples beforehand partially-lithiated at 500 °C and a dwell time of one hour for the rotary kiln (RK) and box furnace (Box) design and two different numbers of Li equivalents (0.8 and 1.01). The results for a material synthesized with a one-step calcination are shown as well. Weight fractions of Li and Ni determined by ICP-OES, resulting number of Li equivalents per mol of Ni, weight fractions of LiOH and Li2CO3 measured by acid titration, resulting "soluble Li" weight fraction and average Ni oxidation state determined by iodometric titration.
| Sample | Li [wt%] | Ni [wt%] | Li equiv. | LiOH [wt%] | Li2CO3 [wt%] | "Soluble Li" [wt%] | Ni oxid. state |
|---|---|---|---|---|---|---|---|
| RK 80% Li | 7.1 | 60.0 | 1.00 | 0.92 | 0.63 | 0.39 | 2.93 |
| RK 100% Li | 7.1 | 60.0 | 1.00 | 0.86 | 0.81 | 0.40 | 2.95 |
| Box 80% Li | 7.0 | 60.0 | 0.99 | 0.82 | 0.80 | 0.39 | 2.95 |
| Box 100% Li | 7.0 | 60.0 | 0.99 | 0.92 | 0.49 | 0.36 | 2.95 |
| One-step ref. | 7.0 | 58.9 | 1.01 | 0.81 | 0.72 | 0.37 | 2.99 |
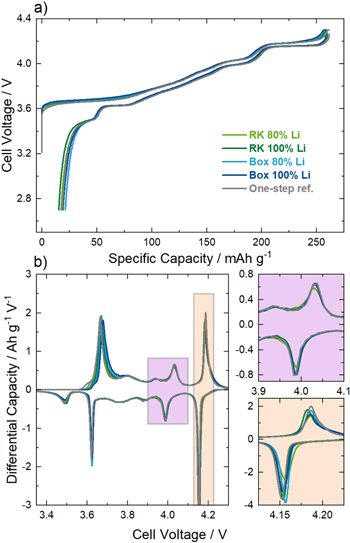
Finally, the prepared CAMs were characterized regarding their electrochemical behavior in coin half-cells. The 1st cycle voltage profiles of all samples shown in Fig. 9a are very similar and no significant differences compared to the one-step reference are observed. The results depicted in Table IV do not show large deviations regarding the 1st cycle charge capacities and only slightly lower 1st cycle discharge capacities for the samples prepared with a partial-lithiation step in the box furnace. The small differences are also reflected in the 1st cycle capacity loss, which deviates by ± 3 mAh g−1. We have reported in a recent publication that the primary particle morphology is the decisive factor for the electrochemical performance of LNO, determines the 1st cycle capacity loss and that samples with a smaller primary particle size show a higher Coulombic efficiency. 21 In the present work, this is also observed for the comparison between the samples partially-lithiated with the rotary kiln setup (comparatively smaller primary particles) and the samples partially-lithiated with the box furnace (comparatively larger primary particles, see Fig. 8), as the RK samples show a smaller 1st cycle capacity loss. However, the one-step reference sample exhibits a primary particle size distribution similar to the samples partially-lithiated with the box furnace, but a smaller 1st cycle capacity loss. Note that the differences in primary particle sizes are much smaller (Q0.5 values deviating by ∼ 20 nm) compared to the previous work and therefore marginal variance in sample properties can attribute for the different 1st cycle results.
Figure 9. Electrochemical analysis of the calcined CAM made from the RK partially-lithiated sample using 80% of the Li amount required to obtain 1.01 Li equivalents per mol of Ni (light green), from the RK partially-lithiated sample using 100% of the Li amount (dark green), from the box partially-lithiated sample using 80% of the Li amount (light blue), from the box partially-lithiated sample using 100% of the Li amount (dark blue) and for the one-step reference sample (gray). (a) Cell voltage vs specific capacity of the 1st cycle and (b) differential capacity vs cell voltage. Two magnifications of the data in the range of 3.9–4.1 V (purple) and 4.125–4.225 V (orange) are shown. All measurements were performed in a coin half-cell setup with Li metal anodes and a glass fiber separator soaked with LP57 as electrolyte. The measurement temperature was set at 25 °C with a current rate of 10 mA g−1.
Download figure:
Standard image High-resolution image
Table IV. Electrochemical properties of the calcined samples measured during the 1st cycle in a coin half-cell setup. All measurements were performed with Li metal anodes and a glass fiber separator soaked with LP57 as electrolyte. The measurement temperature was set at 25 °C with a current rate of 10 mA g−1. Three cells per sample were evaluated.
| Sample | Charge Capacity [mAh g−1] | Discharge Capacity [mAh g−1] | Capacity loss [mAh g−1] | H2-H3 Mean Potential [V] |
|---|---|---|---|---|
| RK 80% Li | 260.4(5) | 242.5(1) | 17.9 | 4.176 |
| RK 100% Li | 259.9(2) | 244.3(1) | 15.6 | 4.172 |
| Box 80% Li | 258.5(1) | 237.2(2) | 21.3 | 4.174 |
| Box 100% Li | 258.5(4) | 239.1(2) | 19.4 | 4.174 |
| One-step ref. | 260.7(7) | 242.6(2) | 18.1 | 4.172 |
Several reports have shown that LNO tends to an excess of z Ni2+ ions in the Li layer ("off-stoichiometry") and is thus better described by Li1-z Ni1+z O2. We have shown in a recent report that dQ/dV analysis is a valuable tool to characterize the structural chemistry of LNO and the value of z in particular. 22 Figure 9b shows the dQ/dV curves of the 1st cycle for all calcined materials with the magnified views depicting two distinct voltage ranges. All materials exhibit the common structural phase transitions of LNO during (de-)lithiation, which occur as peaks in the dQ/dV curves.
The purple inset shows the voltage range between 3.9–4.1 V, where a local minimum in the dQ/dV corresponding to Li0.4NiO2 is expected. 50 We have shown that materials with a small Ni excess (z = 0.016–0.022, determined as Ni occupancy on the Li site by Rietveld refinement) exhibit two peaks with a clear local minimum, whereas for samples with Ni excess values exceeding a certain threshold (z ∼ 0.03), this minimum is no longer observed in the dQ/dV curve. All samples from the present study display the local minimum, and thus, only moderate off-stoichiometry is expected.
The orange inset shows the peaks related to the H2 to H3 phase transition. Our recent publication revealed that there is a linear correlation between the mean potential of this phase transition and the Ni occupancy on the Li site. This relation was found to be valid for samples made from two individual Ni(OH)2 precursors from the same supplier as the one used in this study. The results for the mean potential of the H2 to H3 phase transition are depicted in Table IV and, as already expected from Fig. 9b, the mean potentials are very similar and deviate by not more than 4 mV. This again underlines that the off-stoichiometry of the samples is very similar regardless of whether a partial-lithiation step was used or not.
We also performed PXRD measurements and Rietveld refinement for all calcined samples of this study using the same structural model as in our previous report. 22 This was done to compare the amount of Ni excess and the average crystallite size obtained from the refinement to the results of the dQ/dV analysis and the SEM image segmentation.
As can be seen for one exemplary sample (partially-lithiated using 1.01 Li equivalents and the rotary kiln setup before main calcination) in Figs. S7a and S7b (Supplementary Information), this structural model leads to a good fit but with some remaining differences between the measured and the calculated patterns, which is further on expressed in the reliability factors depicted in Table SI. One possible explanation could be anisotropic size effects, where line broadening in the PXRD patterns is caused by the deviation of the crystallite shape from the ideal spherical symmetry. This effect was shown to determine the line broadening in the PXRD patterns of plate-like Ni(OH)2 particles using a structural model based on linear combinations of spherical harmonics. 23 This approach was used in the present study to investigate whether including anisotropy in the structural model improves the goodness of fit after refinement. It is evident from the results in Figs. S7c and S7d, that indeed this structural model leads to an improved fitting. Moreover, this is also observed for the other CAMs prepared in this study as can be seen by comparing the reliability factors in Table SI.
We believe that the anisotropy might be caused by the specific morphology of the Ni(OH)2 precursor (d50 = 10 μm) employed in this study, which features more anisotropic primary grains and hence differs slightly from the previously used ones (same commercial precursor supplier, d50 = 4 μm and 12 μm, respectively 22 ), leading to anisotropic growth of the crystallites. On the other hand, the anisotropy model includes five additional free parameters and thus an improved fitting could be of artificial nature and not fully related to the model itself. Besides, the anisotropy model prevents the evaluation of one single average crystallite size (it results in an apparent size value for all crystallographic directions, e.g., 180 nm along 003 and 230 nm along 110 for the sample depicted in Fig. S7) in contrast to the conventional model for approximately spherical crystallites. Finally, both the anisotropy model and the "conventional model" used in the previous work lead to comparably large off-stoichiometry values of 0.025 < z < 0.036 (the z values are ∼0.002–0.004 larger when the anisotropy model is used). This result is contrary to the dQ/dV analysis, which indicates that a rather moderate off-stoichiometry is present in all samples (z ≈ 0.02). All in all, we believe that it is more convenient for the present samples to rely on the electrochemical data and the SEM image analysis for evaluation of the off-stoichiometry and primary particle size distribution, respectively.
Implications for future CAM production design
In summary, the investigations in the last section confirm that materials prepared by a synthesis including a partial-lithiation step indeed show similar physico-chemical properties and electrochemical behavior when compared to conventionally calcined samples. The open point remains whether this two-stage calcination concept can have a beneficial impact on large-scale CAM production.
As explained in the introduction, an increased CAM calcination throughput directly translates into a production cost decrease. This throughput increase is currently addressed by using roller hearth kilns with a larger number of saggers in a row and additional sagger layers on top. 51,52 However, to exploit the full potential of this synthesis concept, still higher sagger loadings and shorter calcination times are required. This in turn can potentially cause a demixing of precursor and Li source due to H2O evolution and melting processes together with an inhomogeneous temperature distribution inside the saggers, leading to a variation of chemical composition and crystallite size in the final product.
Although a laboratory process with restricted sample size cannot probe all these issues to the full extent, a simple calculation can illustrate the tremendous advantage of the partial-lithiation concept regarding economically feasible production. An exemplary sagger used in industrial production has a size of 33 cm × 33 cm × 10 cm (wall thickness ∼1 cm) and the bulk density of the mixture of Ni(OH)2 and LiOH·H2O is ∼1 g cm−3, corresponding to a maximum loading of 8.65 kg. Filling the sagger up to 80% of the total volume corresponds to a loading of 6.92 kg. As discussed in the context of the TG-DTA data, full conversion of the used precursors to LiNiO2 will lead to a mass loss of 27.5% in the form of H2O vapor, meaning that only 5.02 kg per sagger and production run are obtained as final product. In contrast, the bulk density of the "500 °C 2 h" partially-lithiated sample was determined to be 2.3 g cm−3 and the two samples heat-treated at 600 °C showed bulk densities of 2.4 g cm−3. Filling the same sagger volume as before, loadings of 15.91–16.60 kg can be achieved without additional mass losses in the main calcination as the removal of H2O is completed during the partial-lithiation step. In the present case, the amount of CAM per sagger and production run can thus be increased by a factor of ∼3.
Certainly, this is a rather rough estimation and a higher bulk density will also lead to a time delay during heating and cooling, which requires an adjustment of the temperature profiles. Furthermore, a two-stage calcination concept including a partial-lithiation step in a rotary kiln requires additional capital expenditures for the kiln and its infrastructure (filling and emptying equipment, O2 atmosphere, etc.). However, the metal bulb of the rotary kiln is more robust against fast heating compared to the ceramic saggers and therefore heating ramps up to 30 °C min−1 can be used instead of the standard 3 °C min−1 applied for a roller hearth kiln. Moreover, the rotational movement and the continuous supply of fresh O2 gas to the mixture of precursor and Li source leads to a fast lithiation, and dwell times of not more than two hours are needed. The calcination in a roller hearth kiln is an energy-intensive process step and thus the dwell time in this furnace should be as short as possible. With the use of the two-stage calcination, the overall time in the roller hearth kiln can be reduced as no plateau in the medium temperature region (400 °C–500 °C) is used and higher sagger loadings can be realized, both leading to an increased production throughput.
Unfortunately, performing the entire calcination only with the rotary kiln would not be cost-effective as temperatures of 700 °C and more are needed for complete formation of the rhombohedral structure and proper growth of the crystallites. The herein used metal bulb of the rotary kiln is composed of a Ni-Fe-Cr alloy (Inconel 600), which is specified to be corrosion-resistant against high temperatures and oxidizing conditions. However, the molten Li source is believed to be very corrosive and to aggressively react with the alloy, especially at elevated temperatures, which will lead to corrosion of the bulb over time and impurities in the final product. Thus, a compromise has to be found regarding the partial-lithiation temperature profile, such that the lithiation reaction is (almost) finished, but the metal bulb is not severely affected. We believe that in the present study a partial-lithiation temperature of 500 °C and a dwell time of two hours is the favorable profile as the lithiation has progressed to a large extent (only small lithium-containing impurities visible in the SEM images, Ni oxidation state is 2.94) and the bulk density is similar to the values obtained for the samples prepared at 600 °C. Note that this is only valid for the educts used in this study and that precursors with different morphology (crystallite size and aspect ratio, porosity) and chemical composition might require an adjusted temperature profile. In particular, the impact of the other transition metals Co, Mn and Al on the kinetics of the lithiation of Ni1-x-y Cox Mny (OH)2 and Ni1-x-y Cox Aly (OH)2 precursors needs to be investigated.
Conclusions
We have shown in this report for the synthesis of LiNiO2, as model system for Ni-rich NCM and NCA cathode materials, that a two-stage calcination process including a partial-lithiation step has the potential to increase the calcination throughput while still resulting in a final product with similar physico-chemical properties and electrochemical behavior compared to a one-step calcination. It is pointed out that the agitated-bed partial-lithiation using the rotational movement of a rotary kiln setup leads to a faster lithiation reaction compared to the fixed-bed counterpart in a crucible. Moreover, the impact of the temperature and the dwell time on the progress of the agitated-bed partial-lithiation was investigated. Taking the corrosion issue of the metal rotary bulb into account, the optimum conditions for the present starting materials LiOH·H2O and Ni(OH)2 were determined to be 500 °C and a dwell time of two hours within the chosen parameter space of the heat treatment. The use of such partially-lithiated samples would lead to a potential increase in sagger loadings by a factor of ∼3 and therefore to an immensely increased throughput in large-scale production. The temperature profile needs to be optimized for precursors with different morphology and chemical composition, although the benefits of the two-stage calcination are expected to remain. Further advantages of the partial-lithiation process regarding homogeneity of the composition and crystallite size of the CAM are believed to come into view as soon as large-scale sample amounts are investigated, which will be part of future work.
Acknowledgments
François Fauth and the BL04-MSPD beamline team at the ALBA synchrotron are gratefully acknowledged for their support to the PXRD measurements. Daniel Sander from BASF SE's group Calcination and Combustion is gratefully acknowledged for the help and advise with the rotary kiln setup.
Funding
Shamail Ahmed and Kerstin Volz gratefully acknowledge the funding from Bundesministerium für Bildung und Forschung (BMBF) within the FESTBATT cluster of competence (project 03XP0433C).