
Abstract
Single crystal Li[Ni0.5Mn0.3Co0.2]O2//graphite (NMC532) pouch cells with only sufficient graphite for operation to 3.80 V (rather than ≥4.2 V) were cycled with charging to either 3.65 V or 3.80 V to facilitate comparison with LiFePO4//graphite (LFP) pouch cells on the grounds of similar maximum charging potential and similar negative electrode utilization. The NMC532 cells, when constructed with only sufficient graphite to be charged to 3.80 V, have an energy density that exceeds that of the LFP cells and a cycle-life that greatly exceeds that of the LFP cells at 40 °C, 55 °C and 70 °C. Excellent lifetime at high temperature is demonstrated with electrolytes that contain lithium bis(fluorosulfonyl)imide (LiFSI) salt, well beyond those provided by conventional LiPF6 electrolytes. Ultra-high precision coulometry and electrochemical impedance spectroscopy are used to complement cycling results and investigate the reasons for the improved performance of the NMC cells. NMC cells, particularly those balanced and charged to 3.8 V, show better coulombic efficiency, less capacity fade and higher energy density compared to LFP cells and are projected to yield lifetimes approaching a century at 25 °C.
Export citation and abstract BibTeX RIS

This is an open access article distributed under the terms of the Creative Commons Attribution 4.0 License (CC BY, http://creativecommons.org/licenses/by/4.0/), which permits unrestricted reuse of the work in any medium, provided the original work is properly cited.
Layered transition metal oxides, LiMO2 (where M is typically a blend of Ni, Mn and Co), 1,2 and phospho-olivines, LiMPO4 (where M is typically Fe) 3 are two of the most utilized positive electrode material types in Li-ion batteries. The two materials tend to be diametrically opposed in how their use is thought to impact cell characteristics and performance. Cells containing Li[NixMnyCo1-x-y]O2 (0 ≤ x, y ≤ 1, x + y ≤ 1) (NMC) positive electrodes are typically high energy cells, owing to the materials high specific capacity (>200 mAh g−1, upper cutoff dependent) and high average voltage (>3.6 V vs Li+/Li, upper cutoff dependent). 1,2,4 Higher voltage operation leads to more oxidizing conditions, can limit lifetime and can lead to stability and safety concerns in the charged state. 5–8 Acquisition of the transition metals required to synthesize NMC materials, particularly Co, is accompanied by ethical complications and considerable financial expense. 9,10 Conversely, LiFePO4 containing cells provide less energy, due to the material having both smaller specific and volumetric capacity, as well as lower average voltage 3 , but have superior stability and safety characteristics 5 , compared to NMC. LFP cells use a more affordable and abundant transition metal (Fe). At the battery pack and device level, the sloped voltage curve of NMC offers simpler state of charge estimation options 11,12 and inherent balancing among parallel connected cells, while the two-phase, 3.3 V voltage plateau of LFP allows series configurations to conveniently work in traditional 12 V (and multiple of 12 V) electronics architectures.
A large portion of the capacity offered by an NMC positive electrode is accessed by charging to higher voltages, beyond 4.0 V vs Li+/Li. 1,2,4 At high voltages, however, positive electrode failure modes, including irreversible phase transitions, 4,13–15 electrolyte oxidation 16–18 and particle cracking, 19–21 become more likely and can significantly reduce cell lifetime. As such, NMC containing cells are conventionally designed with 4.3 V vs Li+/Li, or 4.2 V vs graphite as the maximum intended charging voltage and only contain enough negative electrode capacity for charging up to this specified voltage (with some safety margin). This leaves unutilized lithium in the positive electrode but preserves longevity. Any use of the cell to lower charging voltages in this configuration results in unutilized graphite. LFP, being a two-phase material cannot deliver voltage-metered capacity and LFP containing cells are normally built with exactly enough negative electrode capacity to match the positive electrode capacity (again with some margin). Because LFP is operated at a lower voltage, failure modes like electrolyte oxidation are less likely. 22
Due to conventional differences in construction, comparisons of cells containing NMC and LFP materials are often made at different upper charging (or equivalently positive electrode) voltages with full positive and negative electrode utilization in both cells. 23–27 Comparison of the two materials could be made with conventional cells, operated at similar voltages, but with partial positive and negative electrode utilization in the NMC-containing cell. Such comparisons could not be found in the literature, but usage of layered oxide cells in this manner has been reported, without comparison to LFP. Cells operated between 2.5 V and 3.78 V have been shown to provide superior cycle life to identical cells operated between 2.5 V and 4.2 V. 28 The present work seeks to facilitate a careful comparison of NMC and LFP positive electrode materials in nearly equivalently constructed cells. It details the performance of NMC-containing cells balanced for operation to lower-than-conventional voltages and makes a comparison of these cells with LFP-containing cells, where similar positive electrode voltages and full negative electrode utilization are achieved in both cell types. NMC-containing cells built in this fashion are presented as superior alternatives that can be used in some applications that typically target LFP-containing cells.
Experimental
Cells and preparation
Machine made, Li-ion pouch cells containing single crystal Li[Ni0.5Mn0.3Co0.2]O2 (NMC532) positive electrodes and artificial graphite negative electrodes (LiFUN Technology, Zhuzhou City, Hunan Province, China) were selected for this work due to their unique construction. Specifically, the cells were only constructed with enough graphite to allow operation up to 3.85 V, beyond which, Li plating will occur. This is atypical, where most NMC cells would be constructed to allow charging up to at least 4.20 V. The use of these was originally reported by Martin et al. where they were used as hybrid negative electrode Li-ion/Li-metal cells. 29 For comparison, 204035 LiFePO4//artificial graphite cells (also LiFUN Technology) were also selected. Table I shows the physical and electrochemical specifications of both cell types as assembled. The LFP cells have a larger capacity than the NMC532 cells and therefore larger coating volume. Conveniently, for the sake of comparison, both cell types use the exact same negative electrode active material and formulation. It should be noted, that the N/P ratio in the LFP cells is larger than typical and there is slightly more graphite per unit cell capacity than in the NMC cells. This can be observed in Fig. 1, and may mean that the passivation demands of these cells are slightly higher due to the excess active material. These LFP cells were retroactively selected for comparison to the NMC532 cells that are the focus of this work, but were originally constructed for other experiments that are the subject of other publications. This means that data does not exist to form a comparison between NMC532 and LFP cells for every experiment, but available comparisons are still excellent and instructive. Cells were dried under vacuum at 120 °C for 14 h before being filled with approximately 4.5 g Ah−1 of electrolyte and vacuum sealed under applied vacuum gauge pressure of −90 kPa. The electrolyte chosen was either 1.5 M LiPF6 or 1.5 M lithium bis(fluorosulfonyl)imide (LiFSI), dissolved in a 3:7 mixture by weight of ethylene carbonate (EC) and dimethyl carbonate (DMC), with vinylene carbonate (VC) added at a quantity of 2% of the total electrolyte weight. For some cells, the solvent mixture had 20 wt% methyl acetate (MA) added before mixing in the salt or additives. Resulting mixtures were 80% (EC/DMC 3:7) and 20% MA. All electrolyte materials were obtained from Shenzen Capchem Co. Ltd. and used as received. Electrolyte formulation, pouch cell filling and sealing were performed in an argon atmosphere. Cells were charged to 1.5 V and held at constant voltage for 24 h to facilitate wetting of the jellyroll with electrolyte while avoiding dissolution of the negative electrode current collector. The NMC cells underwent a single formation cycle on a Maccor Series 4000 test system to an upper cutoff of either 3.65 V or 3.80 V while LFP cells completed a cycle to an upper cutoff of 3.65 V. Both cell types were formed at a C/20 rate at 40 °C, after which they were opened in an argon atmosphere and re-sealed under vacuum to remove any gas produced during formation.
Table I. Basic geometric and electrochemical assembly parameters for LiFePO4//graphite and Li[Ni0.5Mn0.3Co0.2]O2//graphite pouch cells used throughout this work. *Positive electrode current collector used with LFP cells is carbon coated aluminum, which results in increased thickness compared to bare aluminum.
| LFP | NMC | |
|---|---|---|
| Positive Electrode Active Material | Pulead LFP | Zhenhua BDA5000 |
| Positive Electrode Area (cm2) | 123.8 | 86.6 |
| Positive Electrode Coating Thickness (um) | 55 | 47 |
| Positive Electrode Loading (mg cm−2) | 12.3 | 15.8 |
| Positive Electrode Foil Thickness (um) | 26* | 13 |
| Separator Thickness (um) | 15 | 15 |
| Negative Electrode Active Material | Kaijin AML400 | Kaijin AML400 |
| Negative Electrode Area (cm2) | 142.0 | 99.4 |
| Negative Electrode Coating Thickness (um) | 48 | 36 |
| Negative Electrode Loading (mg cm−2) | 6.6 | 5.1 |
| Negative Electrode Foil Thickness (um) | 8 | 8 |
| Typical Charging Cutoff (V) | 3.65 | 3.80 |
| Capacity at C/3 (mAh) | 210 | 130 |
| Average Discharge Voltage at C/3 (V) | 3.23 | 3.59 |
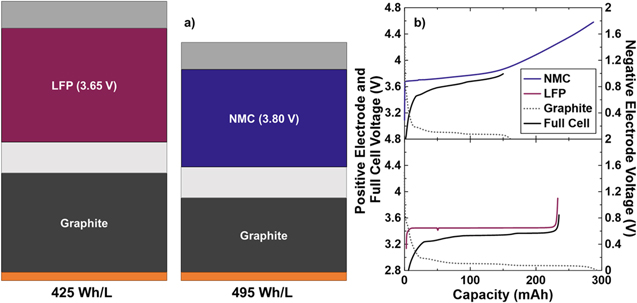
Figure 1. (a) Schematic of the approximate stack energy density for LiFePO4//graphite and Li[Ni0.5Mn0.3Co0.2]O2//graphite pouch cells used throughout this work. The schematic is representative of the relative volumes required for equal energy in each cell type. The major stack components: aluminum foil (light grey), positive electrode (blue or maroon), separator (off-white), negative electrode (dark grey) and copper foil (orange). (b) Voltage curves showing the approximate electrode alignment of each cell type at beginning-of-life.
Download figure:
Standard image High-resolution imageTesting methods
Cells were cycled on a Neware Battery Testing System (Shenzen, China) using conventional constant current, constant voltage charge and constant current discharge methods, between either 3.65 V or 3.80 V and 3.00 V for NMC532 cells and 3.65 V and 2.5 V for LFP cells. Cycling was performed with a nominal C/3 current, with a C/20 characterization cycle every 50 cycles. The NMC cells which charged to 3.65 V cycled at approximately C/2 due to a capacity estimation error during cycling protocol programming. During cycling, cells were housed in temperature-controlled chambers at either 40 °C, 55 °C and 70 °C ± 0.1 °C. After 3000 h of cycling for NMC532 cells and 2000 h of cycling for LFP cells, ultra-high precision coulometry was performed on Dalhousie University's Ultra-High Precision Charger (UHPC) 30 at 40 °C on cells which cycled at 40 °C. The choice to restrict UHPC testing to only cells which cycled at 40 °C is due to the availability of testing data in LPF cells with which to compare. Both prior to commencing long-term cycling and after 3000 h of testing, electrochemical impedance spectra (EIS) were collected using a Biologic VMP3 Multichannel Potentiostat. Cells were held at 10 °C in a Novonix Wide-Range Thermal Chamber while supplied with a 10 mV stimulus that varied from 10 mHz to 100 kHz. Micro X-ray fluorescence (μXRF) spectroscopy was performed on the negative electrodes of NMC cells, after 3000 h of testing, using the methods described by Thompson et al., 31 and Eldesoky et al. 32 Lastly, linear dimensions and weights of the electrodes, as coated were obtained using a millimeter scale ruler, a Mitutoyo 542–132 linear gauge and a Shimadzu AUW220D balance.
Results and Discussion
The NMC532 cells under consideration are unique in their construction and required a custom specification when ordering from LiFUN Technology. Figure 1a shows a schematic detailing the stack energy density the LFP and NMC cells compared throughout this work. The stack energy density presented here considers the electrode coatings, current collector foils and separator. Figure 1a indicates the amount of material required for a given energy, therefore larger stack energy density results in a smaller schematic. Despite being charged to 3.80 V, lower than the typical upper cutoffs, the low voltage NMC532 cells used here yield a stack energy density of 495 Wh L−1. This is larger than the LFP cells used in this study, which have a stack energy density of 425 Wh L−1. Calculation of these quantities is done using Eq. S1 (available online at stacks.iop.org/JES/169/050512/mmedia). Further details can be found in the Supplementary Information. Volumetric energy density is often prioritized due to space constraints being more demanding than weight constraints in many applications. When these cells are compared on the basis of gravimetric energy density, at the stack level, they are remarkably similar with the NMC532 cells delivering approximately 210 Wh kg−1 and the LFP cells delivering approximately 210 Wh kg−1. Neither of these cell types is particularly optimized for energy density, therefore this comparison is approximate. N/P ratio, electrode porosity, electrode dimensions and cell format might change in a cell intended for use in a product demanding higher energy density. Despite this, the electrodes are formulated to be ≥94% active material, receive calendaring and are high quality commercially prepared electrodes. Figure 1b shows measured voltage curves of the full cell, along with the individual positive and negative electrodes, at the beginning-of-life for both the NMC532 and LFP cells used. As constructed, the NMC532 cells can utilize only about half of the lithium inventory of the positive electrode, which makes the fact that it holds an energy density advantage over the LFP cells even more remarkable. When charged to 3.80 V, the NMC532 cells have N/P ≅ 1.10. The LFP cells can utilize all the lithium inventory in the positive electrode, but have a considerable excess of graphite, at N/P ≅ 1.2. If the N/P ratio in the LFP cells was corrected to be 1.1, like the NMC532 cells, the increase in the stack energy density would be approximately 3%, almost 440 Wh l−1, and still less than the NMC532 cells. The physical and electrochemical data required to calculate these energy densities can be found in Table I. The reported electrochemical data is collected at beginning-of-life, but after the cell formation process. This means that the capacities reported, and therefore resultant energy, already account for any first cycle irreversible capacity loss. Figure 2 shows the gas volume generated per unit capacity during formation and the first cycle efficiency for each cell type. Among the NMC532 cells, those with LiFSI-containing electrolytes produced more gas than those with LiPF6-containing electrolytes. When error bars are considered, there does not appear to be large variation between gas produced when charging to 3.65 V vs 3.80 V. This indicates the gas is likely produced during passivation of the negative electrode at the beginning of the first charge, and suggests that the passivation may depend on the choice of LiPF6 or LiFSI. Similarly, LiFSI electrolytes generate more gas during formation in LFP cells, compared to LiPF6 electrolytes. The fact that the LFP cells produce more gas per unit capacity than the NMC532 cells can partly be explained by the excess graphite (larger N/P ratio) which they contain. The excess graphite in a cell has been shown to be electrochemically active and can conceivably participate in gas producing reactions even when not aligned with the active area of the positive electrode. 33 The water content of the LFP electrodes is much larger than that of the NMC electrodes and the reaction of this water during the formation cycle to produce LiOH and H2 is the reason that the LFP cells produce more gas. Figure 2 also shows that first cycle efficiency is higher among NMC532 cells which charge to higher voltage, but that all NMC cells show lower efficiency than LFP cells. The larger first cycle efficiency of the LFP cells is expected, as LFP positive electrodes have been shown to have very little contribution to irreversible capacity loss on the first cycle, and therefore any inefficiency on the first cycle in a full cell is due to reactions on the graphite surface. 34 NMC positive electrodes are known to have an irreversible capacity loss that contributes to first cycle inefficiency, along with graphite in a full cell. 35 The inefficiency in NMC cells is known to decrease as the upper charging voltage is raised, 35 thus corroborating the trend shown in the NMC532 cells charged to 3.65 V and 3.80 V here. In general, this suggests that in practical use, selecting an upper cutoff for NMC cells balanced to lower voltages may involve a compromise between initial energy loss and rate of gradual energy loss during cycling. There does not seem to be a significant difference in the first cycle efficiency of NMC532 cells containing LiPF6 vs LiFSI electrolytes, but if initial energy is highly prized, slight improvements are gained by using a LiPF6-containing electrolyte. Again, this suggests that there may be differences in the passivation reaction occurring on the negative electrode in the presence of either LiPF6 or LiFSI.
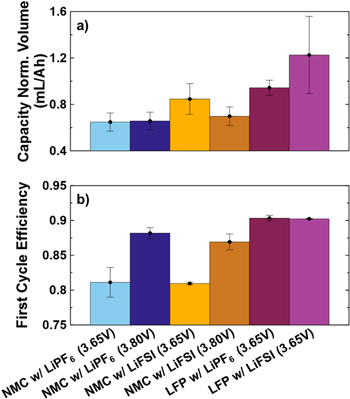
Figure 2. (a) Volume of gas generated during the first cycle, per unit capacity, and (b) first cycle efficiency measured at 40 °C, during a C/20 cycle with charging up to the specified upper cutoff for LiFePO4//graphite and Li[Ni0.5Mn0.3Co0.2]O2//graphite pouch cells.
Download figure:
Standard image High-resolution imageFigure 3 shows the discharge capacity and capacity averaged difference between charge and discharge voltages, ∆V, vs cycle number for low voltage NMC532 cells under charge-discharge cycling protocols at three different temperatures as indicated, over the first 1000 cycles of life. Cells cycled to 3.65 V were cycled at a rate of ∼C/2 while cells cycled to 3.80 V were cycled at a C/3 rate. C/20 cycles were performed every 50 cycles to characterize lithium inventory accessible under low rate, without as much influence from cell impedance growth. Cells cycling at 40 °C show less capacity fade (capacity loss per cycle) than cells cycled at 55 °C, which in turn show less fade than cells cycled at 70 °C. Similarly, at each respective temperature, cells cycled to 3.65 V show less fade than those cycled to 3.80 V. Both trends make sense, as parasitic, lithium consuming reactions between the electrolyte and electrodes are both electrochemically and thermally activated. Cells cycled at 40 °C and 55 °C show decreasing or eventually constant ∆V, implying that cell impedance or internal resistance is not increasing, and any capacity loss is due to lithium inventory depletion. This is confirmed by consulting capacity delivered during C/20 cycles. Cells cycled at 70 °C do show ∆V growth with cycle number, which is notably worse at 3.80 V than 3.65 V. Currently, it is unclear exactly what the source of the impedance growth is at 70 °C, but it could perhaps be attributed build-up of resistive parasitic reaction products. Generally, the capacity loss shown here is very low, amounting to a few percent loss or less in nearly 1000 cycles, except at 70 °C. The discussion here applies well to cells containing both LiPF6 and LiFSI electrolytes. Under every test condition, cells containing LiFSI show equal or better capacity retention and ΔV control than cells containing LiPF6. The largest differences can be noted at the highest test temperature, 70 °C, at either charging upper cutoff voltage. LiPF6 has been known to be thermally unstable, particularly in the presence of trace water. 36 In addition to different negative electrode passivation quality between LiPF6 and LiFSI electrolytes, it is also possible that performance differences come about from electrolyte stability differences. It has been previously determined, in graphite/lithium cells, that when compared to LiPF6, the use of LiFSI provides better cycling performance which is attributed to a thinner solid electrolyte interphase, composed of more predominantly inorganic species such as LiF and deemed to be more thermally stable 37 . Because the cells used here operate to such a low upper cutoff voltage, the presence of oxidation reactions at the positive electrode and a cathode-electrolyte interphase are thought to be unlikely. This would consequently leave the performance of the graphite as a major contributor to the overall cell performance. Cells were not constructed for cycling at lower temperature because the time required to resolve differences between cells, let alone determine cycles to failure is incredibly long. [Comparison is made to other cell types below, in Fig. 7, for readers that want to place these cells in appropriate context.]

Figure 3. (a), (b) Discharge capacity and difference between average charge and (c), (d) discharge voltages (∆V) as a function of cycle number, over the first 1000 cycles, for low voltage Li[Ni0.5Mn0.3Co0.2]O2//graphite pouch cells. Galvanostatic cycling was performed at three temperatures, at (a), (c) ∼C/2 for cells cycled to 3.65 V and (b), (d) ∼C/3 for cells cycled to 3.80 V.
Download figure:
Standard image High-resolution imageAt 3000 h, duplicates of the NMC532 cells were removed from long-term testing to characterize capacity loss and cell condition via UHPC cycling, EIS analysis and finally μXRF spectroscopy. Figure 4 shows voltage curves indicating the relative positioning of the positive and negative electrodes. Voltage curves of individual electrodes were obtained via differential voltage (dV/dQ) analysis. 38 A common positive electrode voltage curve is shown in each panel, and aligned so the leftmost, vertical part of the curve is at at 0 mAh. The negative electrode voltage curves are positioned, according to their relative slippage or shift, with respect to that positive electrode. Full cell voltage curves are not shown to avoid visual clutter. There is negligible active mass loss to report over 3000 h of cycling. Among cells with LiPF6-containing electrolytes it can be readily observed that electrode slippage, or relative shift occurs more with cells cycling under higher temperatures and voltages. Specifically, the discharge endpoint of the negative electrode voltage curve (visualized as a near-vertical, leftmost region) is to the left of the discharge endpoint of the positive electrode voltage curve in the cell containing LiPF6, cycled to 3.65 V at 40 °C. The two discharge endpoints are aligned in the cell cycled to 3.65 V at 55 °C, and the negative electrode discharge endpoint has slipped further to the right in the cell cycled to 3.65 V at 70 °C. A similar trend is observed in the cells containing LiPF6 which were charged to 3.80 V, except all negative electrode voltage curves have moved slightly more to the right. In this case the negative electrode in the cell that was cycled at 40 °C, is positioned to the left, but just barely, when compared to the cell that was cycled at 55 °C. The lack of mass loss and increasing amounts of shift with increasing upper cutoff voltage and cycling temperature indicate that the capacity loss is primarily due to parasitic, lithium consuming reactions, and agrees well with the cycling data in Fig. 3. In cells that contain LiFSI electrolyte, the above trend is non-existent. For cells that were charged to 3.65 V, the negative electrode voltage curves have considerably less shift than the LiPF6-containing cells and are nearly all aligned with each other, showing negligible temperature dependence to the shift. In cells which contained LiFSI that charged to 3.80 V, the negative electrodes similarly show little-to-no shift, but also yield an unexpected result. The cell which cycled at the highest temperature, 70 °C, shows the negative electrode which is positioned furthest to the left. It shows near-perfect alignment with the positive electrode or no relative slippage. These results, when taken together, either suggest that LiFSI electrolyte yields excellent passivation that is thermally and electrochemically robust, or, there are some parasitic reactions occurring at both electrodes at near equal rates. This would cause both the positive and the negative electrode to slip to the right at near equal rates. If such a reaction was occurring at the positive electrode, it stands to reason that it would occur to a greater extent at the highest potentials and temperatures considered, thus offering a possible explanation to the positioning of the negative electrode voltage curve from the cell with LiFSI electrolyte, charging to 3.80 V at 70 °C.

Figure 4. Voltage curves showing electrode alignment of Li[Ni0.5Mn0.3Co0.2]O2//graphite cells after 3000 h of cycling at the denoted temperature. Panels (a) and (b) include data for cells which contained LiPF6 electrolyte, while (c) and (d) include data for cells which contained LiFSI. Cells were charged to either (a), (c) 3.65 V or (b), (d) 3.80 V. Electrode alignment was obtained via differential voltage analysis (dV/dQ fitting) of voltage curves measured on an ultra-high precision charger. A reference positive electrode is plotted in each panel and used as a reference point to zero the capacity axes.
Download figure:
Standard image High-resolution imageFigure 5 shows coulombic efficiency (CE), charge endpoint capacity slippage and fractional fade per cycle for both NMC532 cell types tested after 3000 h of cycling and, for comparison, LFP cells after 2000 h of cycling. As previously mentioned, due to use in experiments for other work, LFP cells were not available for comparison to NMC532 cells in every test. Only LFP cells which underwent long term cycling at 40 °C were available for UHPC testing, hence, only cells which cycle at 40 °C are considered here. The difference in time under test between the NMC532 cells and the LFP cells should not significantly impact the comparison, as the main importance for these cells is that the CE is constant as a function of cycle number, which is not the case at beginning-of-life, while maturation of electrode passivation layers is still ongoing. For the first time in this work, LFP cells are shown in comparison. An excellent study and discussion of the role of these and similar electrolytes in LFP cells is the subject of an additional manuscript, currently in preparation. It should be noted immediately that the NMC532 cell, containing LiFSI electrolyte, which cycled to 3.65 V is believed to be an outlier. It may have been damaged during transfer from long-term to ultra-high precision cycling, or been a cell of slightly poor construction which could not be detected until tested on an ultra-high precision charger. It is shown for completeness, but will not be mentioned further and any discussion below of the group of NMC532 cells is assumed to omit this cell. CE is higher in NMC532 cells than LFP cells, which indicates better expected lifetime where lithium inventory, not impedance growth, is the primary failure mode. Among the NMC532 cells, the cells cycling to 3.80 V show higher columbic efficiency than the cells cycling to 3.65 V and it appears that LiPF6 electrolytes yield better CE in NMC532 cells than LiFSI electrolytes. The fractional charge endpoint slippage is higher for the NMC532 cell cycled to 3.80 V than 3.65 V, and appears to be higher when LiFSI electrolyte is used. One cause of charge endpoint slippage is electrolyte oxidation adding lithium to the inventory at the positive electrode, 39 and electrolyte oxidation is more likely to occur at higher voltages, although 3.8 V is not typically considered a high voltage. There is also a possibility of shuttle reactions occurring. The fact that cells containing LiFSI electrolyte show higher charge endpoint slippage, suggests that parasitic reactions may be ongoing at the positive electrode, supporting the discussion of Fig. 4. When LiPF6 electrolytes are considered, NMC532 has less charge endpoint slippage than LFP when charged to the same upper cutoff (3.65 V), and more charge endpoint slippage when charged to a higher upper cutoff (3.80 V). This may indicate that overall, the NMC532 surface is no more reactive than LFP, through inherent surface properties or superior passivation, and increased electrolyte oxidation is occurring in NMC532 at 3.80 V simply due to the increased potential. The same looks like it could be true if a comparison of NMC532 and LFP cells with LiFSI electrolyte was made with a more robust data set. The LFP cell with LiFSI electrolyte shows larger charge endpoint slippage than the LFP cell with LiPF6 electrolyte, similar to the NMC532 cells, indicating LiFSI may partake in oxidative or shuttling reactions. Lastly, NMC532 and LFP cells with either electrolyte show very similar capacity fade when cycled to 3.65 V. The use of LiFSI electrolyte shows improved fade in both cells types, which corresponds to the improved performance that was mentioned for NMC532 cells in Fig. 3. When the NMC532 cell is charged to 3.80 V, the fade rate is more than three times smaller than any other cell considered, with both LiPF6 and LiFSI. NMC positive electrodes are known to participate in beneficial cross-talk reactions that can occur at increasing voltages, 40 which may explain the incredibly low fade rate measured here.
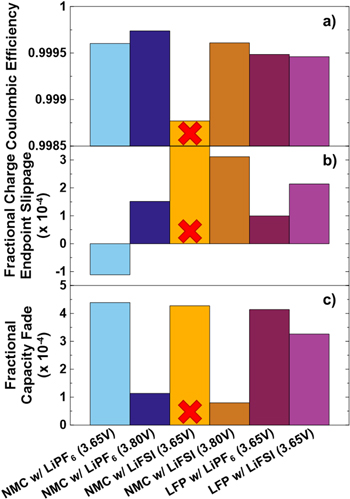
Figure 5. (a) Coulombic efficiency, (b) fractional charge endpoint capacity slippage per cycle and (c) fractional capacity fade per cycle measured by ultra-high precision coloumetry (UHPC). UHPC was conducted after 3000 h of cycling for Li[Ni0.5Mn0.3Co0.2]O2//graphite cells and after 2000 h for LiFePO4//graphite cells to ensure sufficient maturation. UHPC testing was done at C/20 and at 40 °C. A red X is placed over the data for the NMC532 cell with LiFSI electrolyte, which is shown for completeness, to indicate skepticism over the reliability of the cell and any data collected from it.
Download figure:
Standard image High-resolution imageFigure 6 shows Nyquist plots of area specific impedance spectra collected after 3000 h of cycling and UHPC characterization. Spectra are collected when cells are charged to 3.80 V, which corresponds to near 100% state-of-charge for these cells, as used in this work. This is approximately 50% state-of-charge for the positive electrode, based on its full capacity, and the typical voltage at which impedance spectra are collected. No "after formation" spectra are provided for cells that were charged to 3.65 V during cycling, as charging to 3.80 V early in life was believed to possibly alter the passivation and outcomes during other testing. Also, it should be noted that the axes in Fig. 6, for panels containing data for cells with LiPF6 electrolyte have a different scale than panels containing data for cells with LiFSI electrolyte. Both the width and the height of the spectra are smaller in cells that were cycled to 3.80 V and in cells that contain LiFSI electrolyte. In Fig. 3, the change in ∆V with cycle number indicates that in cells cycled to 3.65 V impedance is decreasing at a slower rate compared to cells that cycled to 3.80 V. This may indicate that less resistive and faster forming passivation layers are set up at 3.80 V, compared to at 3.65 V. Considering cells which contained LiPF6 electrolyte, cycling at higher temperature results in increasing width and height in Nyquist impedance, suggesting that a thicker or more resistive layer of parasitic reaction products is building up at higher temperature. In particular, the impedance of the cells which cycled at 70 °C has increased to be many times larger than the spectra collected after formation or for cells which cycled at other temperatures, ending up mostly off scale. The opposite trend is observed when cells which contained LiFSI are considered. Cells which cycled at higher temperature produced smaller impedance features, with both smaller width and height in each spectra. This implies, again, that the nature and stability of the passivation provided by LiFSI-containing electrolytes is considerably different than LiPF6-containing electrolytes, in the low voltage NMC532 cells. On the basis of impedance, and resulting cell performance metrics such as rate capability and high temperature internal resistance control, this suggests the LiFSI electrolyte is vastly superior.

Figure 6. Nyquist plot of area-specific impedance collected for Li[Ni0.5Mn0.3Co0.2]//graphite cells after 3000 h of cycling. Electrochemical impedance spectroscopy was conducted at 10 °C, at 3.80 V to achieve approximately 50% Li[Ni0.5Mn0.3Co0.2]O2 lithiation and be comparable with impedance spectra collected from conventionally built cells. Panels (a) and (b) include data for cells which contained LiPF6 electrolyte, while (c) and (d) include data for cells which contained LiFSI. Cells were charged to either (a), (c) 3.65 V or (b), (d) 3.80 V.
Download figure:
Standard image High-resolution imageBriefly, Fig. S1 shows μXRF spectra collected from the negative electrodes obtained from cells examined in Figs. 4–6, with spectra offset vertically for clarity. Blank runs are shown, obtained from pristine negative electrodes which had never been exposed to electrolyte or charged. The region of interest shown highlights the presence of any Ni, Mn or Co ions which may have dissolved into the electrolyte from the positive electrode, migrated to the negative electrode and deposited on the surface. Every spectrum, for all cells and test conditions yields an identical profile, indicating no detectable transition metal dissolution. This suggests that the electrolytes used and the charging potentials selected avoid any electrochemical attack or structural damage to the positive electrode, respectively.
Figure 7 shows discharge capacity retention and ∆V, normalized to 1 at their fifth cycle values, as a function of time. The normalization allows comparison between cells of different capacities, while plotting as a function of time allows for comparison of cells cycling at slightly different rates. In addition to the NMC532 cells presented in Fig. 3 and throughout, NMC532 balanced to 4.3 V and operated to 4.2 V with LiPF6 electrolyte, as well as LFP cells with both LiPF6 and LiFSI electrolytes are included. An NMC532 cell operated up to 4.20 V with an LiFSI electrolyte is not included as LiFSI catastrophically corrodes the positive electrode current collector at higher voltages, such as 4.20 V. The cells are sorted based on cycling temperatures of 40 °C, 55 °C and 70 °C. At all three temperatures, all the NMC532 cells, including those cycled to 4.20 V, show superior capacity retention compared to the LFP cells, regardless of electrolyte salt selection. At 40 °C and 55 °C, where comparison data exists, the low voltage NMC532 cells are superior in both capacity retention and minimizing ∆V growth compared to normally balanced cells, such as NMC532 cycled to 4.20 V. At 40 °C, the NMC532 cell cycled to 4.20 V has a similar fade rate when compared to the cell cycling to 3.80 V. At 55 °C, the fade rate of the 4.20 V cell is worse, when making the same comparison. This suggests that there may be an optimum upper cutoff voltage when designing cells for maximum lifetime. Sufficiently high potential capability is necessary to ensure high first cycle efficiency and low fade but too high voltage will result in excessive electrolyte oxidation, impedance growth and inventory loss.
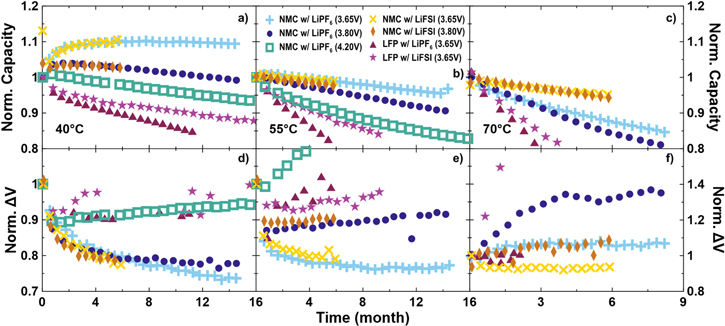
Figure 7. (a)–(c) Discharge capacity and (d)–(f) the difference between average charge and discharge voltages (∆V), normalized to the cycle 5 value, as a function of time for Li[Ni0.5Mn0.3Co0.2]O2//graphite (NMC) and LiFePO4//graphite (LFP) pouch cells. Cycling was performed at C/3 (except ∼C/2 for 3.65 V NMC) at (a), (d) 40 °C, (b), (e) 55 °C and (e), (f) 70 °C. Data is plotted against time to account for the slight differences in cycling rate.
Download figure:
Standard image High-resolution imageComparison of the LiPF6-containing NMC532 cells in Fig. 7, to the LiFSI-containing NMC532 cells in Fig. 7 yields a similar result as in Fig. 3. Capacity retention and ∆V control are equal or better for all LiFSI-containing cells, compared to equivalent LiPF6-containing cells under all test conditions and the differences become dramatic at very high temperature, 70 °C. At 55 °C and 70 °C, the differences in capacity retention between the 3.65 V and 3.8 V LiFSI-containing NMC532 cells is very small, unlike the LiPF6-containing cells, which show noticeable and increasing differences as time under test accumulates. It is remarkable that at 70 °C, both NMC532 cells with LiFSI electrolyte retained about 95% capacity after 6 months of continuous testing and are still under test at the time of writing.
Comparing the NMC532 cells to LFP cells in Fig. 7, NMC532 cells show superior capacity retention at all temperatures and all upper cutoff voltages. This result is unsurprising, as NMC532 cells have been used to demonstrate excellent lifetime at conventional voltages 41 and the benefits of using single crystal particles are also well documented. 42–44 Both NMC532 cells charged to 3.65 V or to 3.8 V and LFP cells show remarkable impedance control at 40 and 55 °C, in that ∆V decreases or remains mostly constant over thousands of hours. Generally, a doubling of ∆V is a possible metric for classifying a cell as reaching end-of-life, similar to when a cell reaches a specified fraction of remaining capacity, normally 80%. Therefore, changes of 10%–20% in ∆V should viewed as small. At 70 °C, the LFP cells show little or no increase in ∆V with time (with the exception of the LFP cell containing LiFSI electrolyte, which shows anomalous ∆V due to electrical connection noise), as do the NMC532 cells which contain LiFSI. LFP cells at 40 °C and 55 °C also show excellent impedance control over many months, but similar noise in the normalized ∆V series prevents a confident interpretation. LFP cells containing LiFSI electrolyte show better capacity retention compared to LFP cells containing LiPF6 electrolytes and represent the best LFP cells available to the authors for comparison at the time of publication. As mentioned previously, the benefits afforded by using LiFSI in LFP cells will be detailed in a separate publication. These best LFP cells, containing LiFSI, are within a few percent of the worst NMC532 cells at all temperatures. From a cell and device manufacturer perspective, LFP cells have merit based on the desire to have low-cost cells, but if lifetime is in anyway important, NMC532, and likely other NMC materials, have a considerable advantage through increased volumetric energy density and the associated decrease in levelized cost of energy that is the result of long-lived cells. The latter advantage only stands to increase by operating at moderately low voltages.
The differences in capacity retention and ∆V shown in Fig. 7 appear to identify large differences between different cell types and cycling voltages. While there are large relative differences, the loss of less than 10% capacity and a ∆V increase of less than 20% is excellent over thousands of hours of cycling at highly elevated temperatures. Large amounts of ∆V growth would be values approaching double the beginning-of-life quantity. Assuming minimal electrolyte oxidation or impedance growth, and that parasitic reactions consume lithium to produce an imperfect passivating layer on the negative electrode that evolves in time under a parabolic growth law, data of this type can be fitted by 45,46

where Q/Q0 is the normalized capacity as a function of time, A is a constant that represents the rate of layer growth and t is time. Furthermore, if the parasitic reactions resulting in passivation layer thickening follow an Arrhenius temperature dependence, a log-linear plot of A vs the reciprocal of temperature, 1/T, should yield a straight line. A frequency factor, B, and an activation energy, Ea, for said reactions can be extracted according to

where Ea has units of eV and T has units of K. Figure 8 shows a log-linear plot of A vs 1/T for the cells shown in Fig. 7. Data for NMC532 cycled to 4.20 V was not available at 70 °C. To increase the robustness of any best fit line, data from a NMC532 cycled to 4.20 V at 20 °C (capacity retention not shown) was added to the analysis which yielded Fig. 8. This analysis, namely the fitting of Eq. 1 to data from cells in Fig. 7, can be viewed in detail in Figs. S2–S5. Nearly all data series can be fit with high coefficient of determination (R2 > 0.96). There are a trio of exceptions to this, however. The two NMC532 cells which cycle to 3.65 V at 40 °C show such little capacity loss in the present amount of time under test which reduces the coefficient of determination to around 0.9 in both cases. Finally the NMC532 cells which cycle to 4.20 V at 20 °C shows a low coefficient of determination due to noise in the data attributed to inconsistent temperature control. The best fit line slopes, or activation energies, obtained from Fig. 8 are very similar among each cell type and upper cutoff voltage, and generally, lower positioning throughout this graph indicates better performance. Mirroring the results in Fig. 7, The NMC532 cells with LiFSI electrolytes are near the bottom (best lifetime), while the LFP cells with LiPF6 electrolyte is near the top (worst lifetime). Comparing NMC532 cells at equal charging voltage, cells with LiFSI electrolyte have lower values of A by about a factor of 2 at all temperatures compared to compared to cells with LiPF6 electrolyte. This clearly shows that LiFSI is preferred over LiPF6 for long lifetime NMC532 cells designed to operate with an upper cutoff voltage near 3.8 V. With that being said, the results of a simple model like this cannot extend to very low temperature regimes where other phenomena such as lithium plating or freezing may occur. LFP cells containing LiFSI electrolyte show smaller values of A compared to those with LiPF6 electrolyte. This, combined with worse CE and charge endpoint slippage, but better fade and capacity retention compared to cells containing LiPF6 electrolyte suggests the possibility of a charge carrying shuttle in the electrolyte that is not deleterious to cell operation. Overall, Fig. 8 suggests that NMC532//graphite cells, balanced and cycled to appropriate voltages are less reactive towards electrolyte, compared to LFP//graphite cells and hence yield longer lifetimes.
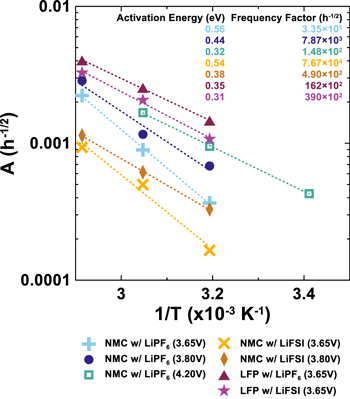
Figure 8. Arrhenius plot of capacity loss rate constant, A, obtained from fitting Q/Q0 = 1—At½ to the capacity retention data in Fig. 7. Best fit lines to each data series are included. Frequency factor and activation energies for capacity consuming reactions in each cell chemistry, extracted from the y-intercept and slope of the line of best fit line respectively, are reported. Fitting results can be found in the Supplementary Information Figs. S2–S5.
Download figure:
Standard image High-resolution imageBased on the Arrhenius temperature dependence established for the cells characterized by Fig. 8, lifetimes can be projected under the assumption that there is no capacity loss due to impedance growth or active mass loss. Solving Eq. 2 for A, substituting into Eq. 1 and solving for time yields

where Q/Q0 is fixed at the fractional capacity to which the lifetime is projected. Typically, and here, Q/Q0 = 0.8. Figure 9 shows the lifetime, calculated from Eq. 3, for each cell type characterized in Fig. 8 as a function of temperature. The NMC532 cells balanced and operated at low voltage show superior lifetimes at all temperatures compared to LFP cells and to NMC532 cells balanced and operated to typical voltages (4.20 V). Comparing the low voltage NMC532 cells, Fig. 9 illustrates the trend that operation up to 3.65 V provides better capacity retention and hence lifetime, especially at lower temperatures. Operation up to 3.80 V provides capacity retention which is worse, but becomes more competitive with 3.65 V operation at higher temperatures. At equivalent charging voltages, the use of LiFSI in NMC532 cells produces better lifetimes. At high temperature, the projections imply that the use of LiFSI can allow operation of NMC532 cells to 3.80 V with better lifetime than NMC532 cells containing LiPF6 operated to 3.65 V. This result has yet to be directly observed in Fig. 7. It should be noted, that in Fig. 8, the Arrhenius fit for the NMC532 cell with LiPF6, operated to 3.80 V, yielded among the worst fit quality, likely due to impedance growth at 70 °C. This directly influences the projection here, which indicates that operation of NMC532 cells with LiPF6 up to 4.20 V will yield improved high temperature lifetime compared to 3.80 V operation, and LFP cells with LiFSI are only slightly worse in lifetime at high temperature, even on a logarithmic scale. The former is anecdotally not generally observed, and the latter is, by examination of Fig. 7, not correct. This is due to the inaccuracies in the fit for the LiPF6-containing cell operated at 3.80 V. The LFP cell with LiFSI electrolyte projects to have longer lifetime at all temperatures considered, than both LFP cells with LiPF6 electrolyte and NMC532 cells operated to 4.20 V. The low temperature superiority of LFP with LiFSI to NMC532 charged to 4.20 V disagrees with Fig. 7, but in real lifetime tests, impedance growth, not inventory loss will likely contribute as the major cause of failure and not be perfectly captured in this model. The lifetimes suggested in Fig. 9, especially at 20 °C and similar temperatures, for the low voltage NMC532 cells are beyond 100 years, with particularly impressive results predicted for cells using LiFSI electrolyte. Management of charging rates to ensure that lithium plating did not occur would be required to realize a lifetime of such length with these cells.

Figure 9. Projected lifetime to 80% capacity remaining, in the absence of impedance growth, for NMC532 and LFP cells as a function of operating temperature, based on charging voltage and/or electrolyte salt type.
Download figure:
Standard image High-resolution imageIn addition to superior lifetime compared to LFP cells, the use of NMC materials in cells balanced to low voltages present a multitude of opportunities for improved Li-ion batteries and devices that use them. These represent opportunities for future work and may include:
- 1.Available charging strategies to overcome capacity loss from electrode slippage and further increase lifetime: Fig. 4 shows that with increased cell degradation, the negative electrode voltage curve can "slip" or move to the right, relative to the positive electrode voltage curve. The result is reduced capacity within the designated operating voltage window of the cell, due to the sloped nature of the positive electrode voltage curve. By charging to higher cell voltages after substantial slippage has occurred, access to the full storage capacity of negative electrode can be reattained. This method would treat the positive electrode as having an excess lithium reservoir that requires charging to higher voltage to access, as needed. This would allow the capacity to remain constant as the cell degrades and provide more energy due to the raised voltage at the expense of accelerated degradation as the voltage is raised further. Therefore, the lifetime projections in Fig. 9 could be exceeded!
- 2.Superior impedance characteristics for fast charging: NMC-type positive electrodes have their minimum charge transfer resistance near 50% lithiation, and during operation increases in impedance or internal resistance are often assigned to increases in positive electrode impedance. 47 Additionally, the positive electrode and therefore cell impedance gets large near 0% positive electrode lithiation, 47 corresponding to 100% state of charge in a normally-balanced NMC cell. This means that devices which implement fast charging methods tend to decrease the charging rate as cells get closer to "full charge." Figure 6 shows that in the 3.80 V balanced NMC532 used here, features in the impedance spectra, including charge transfer resistance get smaller at 100% state of charge, at the cell level. This may mean that fast charge protocols need not reduce charging rate as severely as batteries reach "full charge."
- 3.Better electrochemical compatibility with liquid electrolytes designed for fast charging: Electrolytes containing low viscosity solvents such as methyl acetate and ethyl acetate have been shown to provide considerable benefit for fast charging applications at the expense of lifetime when operated at high voltage, due to lower oxidation stability. 48 Operation of NMC cells to low voltage avoids placing considerable oxidative stress on the electrolyte, which may allow the use of such solvents with minimal lifetime penalty. In a similar notion, the operation of NMC cells to low voltage has enabled the use of LiFSI with NMC, which cannot traditionally be done due to corrosion concerns at typical voltages, hence unlocking incredible lifetime discussed here.
- 4.Option to use high nickel, low cobalt (i.e. Li[Ni0.8 Mn0.1 Co0.1 ]O2 ) or cobalt-free materials (i.e. Li[Ni0.95 Mn0.05 ]O2 ) without suffering from structural degradation at higher voltages: High nickel, low cobalt materials currently offer improvements to cost and energy density (given a modest upper cutoff voltage), compared to traditional layered materials with larger amounts of cobalt. When charged to sufficiently high voltage, typically some potential beyond 4.06 V, these materials suffer degradation due to large unit cell volume changes. 49 Cells balanced for use to lower voltages, such as 3.80 V would avoid such structural issues.
- 5.Potential improved performance in blended LFP + NMC positive electrodes: The negative electrodes contained in the NMC532 and LFP cells are identical in formulation and nearly identical in utilization. They differ significantly in coated volume, due to cell sizing and slightly in utilization or N/P ratio. Nevertheless, the comparison between the two cells types should be very good. LFP is thought to be less reactive towards electrolyte and more stable than other positive electrode materials, including layered materials like NMC. 34,50–52 If this is the case, the inferior performance of the LFP cells compared to the NMC cells perhaps indicates that reactions at the NMC are improving the performance of the graphite negative electrode. The absence of these reactions at the LFP surface may account for the performance difference. As mentioned previously, there are beneficial cross-talk reactions that can occur which improve cell performance in various metrics. 40 The topic of blended electrodes has already received research, 53–56 but discussion here suggests that a sufficient quantity of NMC, operated to the correct voltage may "condition" the graphite for maximum capacity retention while LFP is used to keep costs low. Lastly, LFP particles tend to be sub-micron sized and may pack well between micron sized NMC particles. This opens opportunities for low porosity, highly dense electrodes that can hypothetically offer impressive energy density.
To not simply speculate about the opportunities enabled by this unique cell design, but to actually demonstrate one, an effort was made to generate a data set that demonstrated the third point above. Figure 10 shows discharge capacity retention and ∆V, normalized to 1 at their fifth cycle values, as a function of cycle number, for low voltage NMC532 cells and LFP cells containing LiPF6 and LiFSI with and without the solvent blend diluted with 20% methyl acetate (e.g. 80% EC/DMC + 20% MA). Testing was performed at 20 °C, with 1 C rate charging to probe long-term rate capability, 40 °C and 55 °C. Testing was not undertaken at 70 °C due to charger channel availability. Cells shown which do not have MA are selected from the cells shown in Fig. 7. At 20 °C, the NMC532 cell with LiPF6 and 20% MA shows sudden failure (corroborated by a duplicate cell, not shown) just before 1000 cycles. Such rapid failure may indicate lithium plating. The NMC532 cell with LiFSI and 20% MA shows no such sudden failure and shows no signs of capacity loss after nearly 2000 cycles. The LFP cells with 20% MA are both worse than the NMC532 cell with LiFSI and 20% MA, but of these, the LFP cell with LiFSI shows slightly better capacity retention and slightly lower ∆V. At 40 °C and 55 °C, the NMC532 cells show vastly superior capacity retention compared to the LFP cells. Comparing the LFP cells, those with LiPF6 give worse capacity retention that cells with LiFSI, and cells with MA give worse capacity retention without MA. The impact of salt type appears to be larger, but the effects compound. The same is true of the NMC532 cells, but the differences are very small at 40 °C, and more readily observable at 55 °C. The NMC532 cells at 55 °C with LiFSI are very tolerant to the addition of 20% MA, showing only 1% difference in capacity retention after 600 cycles. When LiPF6 is used in NMC cells at 55 °C, the capacity retention is worse than when LiFSI is used, and the fade rate penalty incurred by using MA is larger. This implies that the combination of low voltage NMC with LiFSI electrolyte can provide a stable cell chemistry in which MA can be used without the lifetime consequences often seen in other cell designs.

Figure 10. (a)–(c) Discharge capacity and (d)–(f) the difference between average charge and discharge voltages (∆V), normalized to the cycle 5 value, as a function of cycle number for various Li[Ni0.5Mn0.3Co0.2]O2//graphite (NMC532) and LiFePO4//graphite (LFP) pouch cells. Cycling was performed at C/3 at (a), (d) 40 °C, (b), (e) 55 °C and (e), (f) 70 °C. All NMC532 cells were charged to 3.80 V and LFP cells were charged to 3.65 V. Cell contained either LiPF6 or LiFSI salts and the typical EC/DMC solvent blend was diluted with 20% methyl acetate (MA) in some cases.
Download figure:
Standard image High-resolution image
It is easy to dismiss the results presented here, as it seems obvious that lower voltage operation of NMC532 cells should yield better lifetime than operation at higher voltage, and any lifetime or energy gains may be offset by the low price of LFP materials. Applications that require immense cycle life, such as stationary energy storage, EV batteries serving as vehicle-to-grid storage or battery leasing services can benefit from such cell designs as cost per unit of lifetime energy throughput is definitely superior for low voltage NMC compared to LFP cells. The initial cost imbalance can possibly be alleviated as recycling efforts are improved and lower the economic pressure on certain resources, such as cobalt and nickel. 57
Conclusions
NMC532 cells that are balanced for low voltage operation were cycled to 3.65 V and 3.80 V for the basis of comparison with LFP cells at equivalent cell potentials and without a considerable excess of graphite, like in a conventional NMC-containing cell. At all cycling temperatures considered, low voltage NMC532 cells provided superior capacity retention compared to both LFP cells and NMC532 cells balanced for and operated up to 4.20 V. Therefore, similar cell designs with similar materials should receive consideration for applications that demand the highest lifetimes. Among many benefits, these cells were shown to be compatible with LiFSI-containing electrolytes, avoiding high voltage corrosion problems and resulting in high temperature lifetimes vastly superior to cells with conventional LiPF6 electrolyte. UHPC, EIS and μXRF analyses were completed to understand the better performance of the NMC532 cells, compared to each other and the LFP cells. There appears to be no damage to the positive electrode and the negative electrode passivation is identified as the most likely cause of capacity fade. NMC532 may exhibit synergy with graphite negative electrodes that does not exist when LFP is used and can offer one explanation to the superior capacity retention of NMC cells compared to LFP cells, even when cycling at similar voltages. Despite LFP cells showing excellent impedance control and capacity retention in long-term cycling, CE and capacity fade in UHPC testing both suggest inferior ability to prevent lithium inventory loss when compared to NMC cells. LiFSI-containing electrolyte in NMC532 cells shows lower CE, higher charge endpoint slippage and yet better fade and long-term capacity retention. There is some evidence to suggest a shuttle or offsetting reactions at the positive and negative electrodes, but this requires further study. Very high compatibility of this cell design and LiFSI electrolyte with methyl acetate solvents has been demonstrated. Overall, low voltage NMC532 cells exceed LFP cells in lifetime and volumetric energy density. This should warrant use consideration where the energy density of LFP cells is insufficient and the device lifetime is more important than initial costs. This does not immediately dismiss LFP cells as a viable storage technology, as it is believed that initial cost and safety would remain superior. Further analysis of these metrics is required. Future work on low voltage NMC cells includes application of this cell design to fast charge applications, use of low cobalt and high nickel NMC materials and the use of blended NMC and LFP positive electrodes.
Acknowledgments
This work was funded under the auspices of the NSERC/Tesla Canada Industrial Research Chair program at Dalhousie University. C.A., E.L. , A.E. and J.O. thank NSERC for scholarship support.