
Abstract
Nickel-rich NCM (LiMO2, with M = Ni, Co, and Mn) cathode active materials for lithium-ion batteries are being increasingly commercialized due to their high specific capacity. Since the particle cracking of conventional polycrystalline NCMs is reported to be a major failure mechanism, the demand for single-crystalline materials is rising, as they are believed to provide superior cycle life. To gain comprehensive insights into the implications of NCM particle morphology on the electrochemical performance, the fundamental properties of these two material classes will be examined in this study. Krypton physisorption experiments and capacitance measurements reveal considerable differences in the change of the NCM surface area upon compression, delithiation, and charge/discharge cycling, depending on the material's morphology. Here, a polycrystalline NCM622 exhibits changes of its specific surface area of up to 650 % when cycled to a high state of charge, while the one of a single-crystalline NCM622 remains essentially unaffected. Consequently, the difference in morphology and, therefore, in exposed NCM surface area leads to differences in the extent of gassing at high degrees of delithiation (determined via on-line electrochemical mass spectrometry), in the rate capability (evaluated in half-cell discharge rate tests), and in the thermal stability (assessed by thermogravimetric analysis).
Export citation and abstract BibTeX RIS

This is an open access article distributed under the terms of the Creative Commons Attribution Non-Commercial No Derivatives 4.0 License (CC BY-NC-ND, http://creativecommons.org/licenses/by-nc-nd/4.0/), which permits non-commercial reuse, distribution, and reproduction in any medium, provided the original work is not changed in any way and is properly cited. For permission for commercial reuse, please email: permissions@ioppublishing.org.
Owing to their high specific capacity and their technological maturity, ternary layered lithium transition metal oxides (LiMO2) such as NCMs (M = Nix Coy Mnz , x+y+z = 1) have already been commercialized as cathode active materials (CAMs) for lithium-ion batteries. 1,2 In particular, nickel-rich NCM compositions are cost-effective and deliver practical discharge capacities of >200 mAh/gNCM. 3–5 With increasing nickel content, however, the capacity gain is often accompanied by a shorter cycle life due to undesired side reactions at the NCM/electrolyte interface, resulting, e.g., from (i) the decomposition of residual lithium salts leftover from the synthesis 6,7 or of surface contaminants formed during improper storage, 8–10 all present in greater amounts on nickel-rich materials, 7,10 as well as from (ii) the reaction of released (singlet) oxygen at high degrees of delithiation from the NCM lattice with the electrolyte, 11,12 which occurs at lower potentials for higher nickel content. 13,14 These processes degrade the NCM active material upon charge/discharge cycling and increase the cell impedance, eventually leading to cell failure. 10,15
One additional reported failure mechanism of conventional polycrystalline NCMs is the cracking of the secondary agglomerates due to the anisotropic volume change of the NCM unit cell of up to −8 % upon (de)lithiation, 16–18 causing stress and strain throughout the NCM particle, 16 what results in the formation of pores and cracks between the NCM primary crystallites and, therefore, in an increase of the NCM surface area that is in contact with the electrolyte. 19–21 This does not only enhance surface-area-dependent side reactions but also impairs the electrical contact across a secondary agglomerate upon its fragmentation into primary crystallites. 22,23
To overcome this issue, more and more attention has been dedicated to the development of an improved particle morphology. 2,24 One way to minimize the occurring side reactions and resistances lays in the reduction of the specific surface area through a greater primary crystallite size, being known in the literature under the designation single-crystals, 24–26 describing relatively large primary crystallites without a regular secondary structure and (ideally) without agglomeration, which are expected to maintain their pristine surface area upon cycling. 14,20,27 The expected integrity of the single-crystalline particle morphology could be the origin of the improved capacity retention observed during extended charge/discharge cycling experiments reported in recent studies. 27–30 However, the synthesis of single-crystalline NCMs is more demanding and, therefore, more expensive when implemented in large-scale industrial processes. For example, the synthesis of single-crystalline layered transition metal oxides often includes higher calcination temperatures of up to 1000 °C, multi-step calcination procedures, a washing step to remove excess lithium salts and flux agents, as well as mechanical grinding to deagglomerate the sintered primary crystallites (e.g., by ball milling). 24
To better understand the morphology-related (dis)advantages of single-crystalline NCMs, this study focuses on elucidating the intrinsic characteristics and the possible performance benefits of different NCM particle morphologies: a comparison of a polycrystalline and a single-crystalline NCM622 with similar pristine specific surface area (∼0.3 m2 NCM/gNCM) allows for the discrimination of the effect of particle morphology, whereas a comparison of the rather large NCM622 single-crystals (with a size of ∼5 μm) with the tiny primary crystallites obtained by milling of the polycrystalline NCM622 (with ∼0.6 μm) exposes the effect of the difference in pristine surface area (of a factor of ∼8x) for single-crystalline materials. As one might expect on account of the very different morphologies and specific surface areas of these three materials, krypton physisorption experiments (referred to as Kr-BET) and capacitance measurements reveal considerable differences in the change of the NCM surface area upon compression, delithiation, and charge/discharge cycling. Consequently, the effect of the morphology on the extent of gassing at high state of charge (SOC) was determined via on-line electrochemical mass spectrometry (OEMS), the rate capability was evaluated in half-cell discharge rate test, and the thermal stability was assessed by thermogravimetric analysis (TGA). In summary, this report gives comprehensive insights into the fundamental properties of poly- and single-crystalline NCMs.
Experimental
NCM622 active material powders
Three different NCM622 (LiNi0.6Co0.2Mn0.2O2) active materials were used in this study. The polycrystalline NCM622 material (referred to as "PC," 0.32 m2 NCM/gNCM (measured by Kr-BET), BASF SE, Germany) was used as received.
In order to obtain an NCM622 material that consists mostly of individual primary crystallites, the secondary agglomerates of the polycrystalline NCM622 powder were crushed to obtain the individual primary particles by ball milling, similar to the procedure shown by Hou et al.: 31 The polycrystalline NCM622 powder was mixed with N-methyl-2-pyrrolidone (NMP, anhydrous, 99.5 %, Sigma-Aldrich) at a mass ratio of 4:1 and ground in a 45 ml zirconium oxide beaker using zirconium oxide balls (ZrO2, 2 mm in diameter) for 2×5 min at 400 rpm and 2×5 min at 1000 rpm, using a planetary ball mill (Pulverisette 7, Fritsch, Germany), including rest periods of 2 min between each step. The mixture of NCM, NMP, and ZrO2 balls was heated and dried in a tube furnace (Carbolite, Germany) under argon atmosphere (1 l/min), applying a temperature ramp of 0.75 K/min from room temperature to 150 °C and then at 0.33 K/min to 210 °C, where each of the two temperatures was held for 4 h. (The relatively flat temperature profile (including the slow temperature increase and the temperature hold) was chosen to avoid boiling, bubbling, and splashing of the NMP in the furnace during drying. Through the here chosen procedure, most of the solvent had evaporated before the boiling point of NMP (at ∼203 °C) was reached. Up to this point, however, no changes of the NCM particles regarding morphology, composition, or crystal structure were expected). Subsequently, the dried mixture of NCM powder and ZrO2 balls was re-annealed by applying a temperature ramp of 10 K/min up to 525 °C in a gas atmosphere of 20 vol% oxygen in argon (1 l/min), holding it at 525 °C for 1 h before letting it cool down to room temperature. The resulting ball-milled NCM622 was separated from the ZrO2 balls by sieving and then stored under inert conditions; this material, consisting of mostly individual primary NCM622 particles, will be referred to further on as "PC-bm" (2.25 m2 NCM/gNCM).
As a third NCM622 material, a directly synthesized single-crystalline NCM622 (referred to as "SC," 0.27 m2 NCM/gNCM, BASF SE, Shanghai, China) was used as received.
Scanning electron microscopy
The morphology of the CAM powders was investigated via top-view scanning electron microscopy (SEM) using a tabletop microscope (JCM-6000, JEOL, Japan) in secondary electron mode and applying an acceleration voltage of 15 kV.
Electrode preparation
For cell cycling, NCM electrodes were prepared from the three above described NCM622 powders that exhibit very different morphologies (described later in Fig. 1) and specific surface areas: the as-received polycrystalline NCM622 (PC), the ball-milled polycrystalline NCM622 (PC-bm), and the as-received single-crystalline NCM622 (SC). Targeting different experimental investigations (see below), three different electrode inks were prepared with each of the three NCM622 powders, using different mass ratios of active material, carbon black (C65, carbon black SuperC65, 64 m2 C65/gC65, TIMCAL, Switzerland), and polyvinylidene difluoride binder (PVDF, Solef, Solvay, Germany) binder as well as different solid contents in the NMP solvent: (i) with a mass ratio of 96:2:2 and a solid content of 80 wt%; (ii) with a mass ratio of 96:2:2 and a solid content of 63 wt%; and, (iii) with a mass ratio of 90:5:5 and a solid content of 52 wt%. The inks based on polycrystalline NCM622 (PC) were mixed in a planetary mixer (Thinky Corp., USA) for 17 min, using a four-step sequential mixing procedure. To avoid particle agglomeration, the inks based on the SC and PC-bm active materials were prepared using the planetary ball mill with a ZrO2 beaker (20 ml) and ZrO2 balls (10 mm in diameter) by mixing 4×5 min at 400 rpm, including rest periods of 2 min between each step.
Due to the very high specific surface area of the PC-bm material, uncompressed electrodes with a composition of 96:2:2 resulted in significant overpotentials during electrochemical testing, even when cycled at a slow rate of C/20, as the amount of conductive carbon of 2 wt% in the electrode was not sufficient to allow for a complete and homogeneous electrical contacting of the PC-bm particles. Therefore, PC-bm electrodes were compressed, even in experiments in which uncompressed electrodes were used for the SC and PC materials, as described in the following paragraphs. However, since the PC-bm material consists mostly of separated primary crystallites, as will be further discussed later, the mechanical compression of the electrodes is expected to have no effect on the pristine CAM surface area. In the following, we will describe the different electrode compositions and electrode compressions used for the different experimental procedures.
On-line electrochemical mass spectrometry (OEMS) measurements: The NCM slurries with a mass ratio of 96:2:2 and a solid content of 80 wt% were coated onto a stainless steel mesh (316 grade, 26 μm aperture, 25 μm wire diameter, The Mesh Company, United Kingdom) with a doctor blade, using an automated coater (RK PrintCoat Instruments, United Kingdom). The electrode sheets were then dried in a convection oven at 50 °C for 5 h before electrodes with a diameter of 14 mm were punched out, having a mass loading in the range of 10.0 ± 1.8 mgNCM/cm2. For the counter electrodes, lithium iron phosphate (LFP) electrodes with a diameter of 15 mm were punched out from commercially available LFP electrode sheets (LFP on aluminum, 3.5 mAh/cm2, Customcells, Germany). While the PC and the SC electrodes were used uncompressed to avoid mechanically induced particle cracking, the PC-bm electrodes were compressed at 100 MPa for 30 s using a manual hydraulic press (Specac, United Kingdom) to minimize electrical contact resistances (see above). Data with these NCM electrodes are shown in Figs. 4 and A·5.
Cycling experiments in coin cells and T-cells: The NCM inks were coated onto the rough side of an aluminum foil (18 μm, MTI, USA) with a box-type coating bar (Erichsen, Germany), using the automated coater. All NCM electrode sheets were then dried in a convection oven at 50 °C for 5 h before punching out electrodes for the different types of experiments:
- The electrodes used for the Kr-BET and TGA measurements as well as for the potential curves of the first charge were prepared from the inks with an NCM:C65:PVDF mass ratio of 96:2:2 (with a solid content of 63 wt%). They were punched out to diameter of 14 mm (for the use in coin cells) and had a mass loading of 12.5 ± 1.5 mgNCM/cm2. The PC and SC electrodes were used uncompressed while the PC-bm electrodes were compressed at 100 MPa for 30 s, if not stated otherwise. Data with these NCM electrodes are shown in Figs. 2, 6, A·2, and A·4.
- The electrodes used for the discharge rate tests were prepared from the inks with an NCM:C65:PVDF mass ratio of 90:5:5 (with a solid content of 52 wt%). They were punched out to a diameter of 10.95 mm (for the use in T-cells) and had a mass loading of 12.5 ± 0.5 mgNCM/cm2. The electrodes for all three NCM materials were compressed at 200 MPa for 30 s. Data with these NCM electrodes are shown in Figs. 5 and A·6.
- The electrodes used for the NCM capacitance measurements in T-cells were prepared from the inks with an NCM:C65:PVDF mass ratio of 96:2:2 (with a solid content of 63 wt%). They were punched out to a diameter of 10.95 mm and had a loading of 8.5 ± 0.5 mgNCM/cm2. These electrodes with all three NCM materials were used both uncompressed and compressed at 100 MPa for 30 s. Data with these NCM electrodes are shown in Figs. 3 and A·3.
Two types of counter electrodes are used in these experiments: either LTO electrodes, punched out at a diameter of 10.95 mm from commercially available LTO electrode sheets (LTO on aluminum, 3.5 mAh/cm2, Customcells, Germany), or lithium metal electrodes (450 μm thick, Rockwood Lithium, USA) with a diameter of 11 mm in T-cells or 15 mm in coin cells.
C65/PVDF electrodes: To serve as a background reference material for the determination of the NCM specific surface area as well as for the evaluation of the NCM thermal stability, slurries without active material containing only C65 and PVDF at a mass ratio of 1:1 were mixed with NMP in the planetary centrifugal mixer, and coatings on aluminum foil were prepared as described above. For the Kr-BET and TGA measurements, uncompressed C65 electrodes with a diameter of 14 mm and a mass loading of 3.2 mg/cm2 were used.
All electrodes were dried in a Büchi oven at 120 °C under dynamic vacuum for at least 6 h and then transferred without exposure to air to an argon-filled glove box (<1 ppm O2 and H2O, MBraun, Germany) where all cells were assembled.
On-line electrochemical mass spectrometry
In preparation of the on-line electrochemical mass spectrometry (OEMS) experiments (reprinted here from a previous publication 14 for the sake of completeness), capacitively oversized LFP electrodes (15 mm in diameter, 3.5 mAh/cm2) were pre-delithiated in coin cells (Hohsen, Japan) using two glass fiber separators (16 mm in diameter), one polyolefin separator (17 mm in diameter, H2013, Celgard, USA) facing the LFP electrode (preventing that glass fibers adhere to the LFP electrodes and get transferred to the OEMS cell), and 100 μl of LP57 electrolyte (1 M LiPF6 in EC:EMC 3:7 w/w, <20 ppm H2O, BASF, Germany). For this, they were pre-delithiated in coin half-cells against metallic lithium (450 μm thick and 15 mm in diameter, Rockwood Lithium, USA) to ∼90 %SOC at a specific current of 30 mA/gLFP for 4.5 h, after having performed one full formation cycle at 30 mA/gNCM between 3.0 and 4.0 VLi (note that throughout this article potentials referenced to the Li+/Li redox potential are denoted as VLi; similarly, VLFP and VLTO are used for the cell potential of the OEMS cells with LFP as counter electrode as well as for the pseudo full-cells with LTO as counter electrode, respectively). After pre-delithiation, the LFP electrodes were harvested from the cells and used without washing as the counter electrode in the OEMS cells for the gas evolution experiments. As described previously, 14 the pre-delithiated, capacitively oversized LFP electrodes are used because they: (i) provide a stable potential of ∼3.45 VLi over a wide SOC window, (ii) provide a sufficiently large capacity to take up the lithium from the investigated NCM working electrodes, and (iii) exhibit no gas evolution due to the absence of electrolyte decomposition reactions at their operating potential (as compared to typical anodes such as lithium metal or graphite forming an SEI, accompanied by gas evolution 15,32,33 ). To later choose the end of charge potential of the NCM electrodes in the OEMS experiments, the LFP potential at ∼10 %SOC is used: during the re-lithiation in here-mentioned half-cells, a potential of 3.40 VLi was observed.
For the OEMS experiments, a pre-delithiated LFP counter electrode was placed on the bottom of the custom-made OEMS cell hardware, then covered by two polyolefin separators (24 mm in diameter, H2013, Celgard, USA) that were wetted with 100 μl of LP57 electrolyte, and finally an NCM electrode (14 mm in diameter, NCM:C65:PVDF mass ratio of 96:2:2, with the PC-bm electrode compressed at 100 MPa and the PC and SC electrodes uncompressed) was placed on top of the stack in the spring-compressed OEMS cells. The assembled cells were positioned in a climate chamber (CTS, Germany) at 25 °C and connected to a potentiostat (SP-300, BioLogic, France) and the mass spectrometer system (HiQuad QMH 400–1, Pfeiffer Vacuum, Germany), which has been described in detail elsewhere. 34
The cells were held at OCV for 4 h before they were charged in constant-current mode (CC) to 4.08 VLi (corresponding to 0.68 VLFP against the pre-delithiated, capacitively oversized LFP counter electrode) at a C-rate of C/5 (corresponding to 55 mA/gNCM, referenced to the theoretical capacity of 276.5 mAh/gNCM of NCM622), where they were held for one hour in constant-voltage mode (CV), before they were discharged to ∼3.0 VLi (corresponding to −0.4 VLFP). After two full cycles to 4.08 VLi, three cycles were executed with a higher upper cutoff potential of 4.73 VLi (corresponding to 1.33 VLFP). Each of the five CV steps was followed by a OCV period of 10 min.
The traced mass signals were normalized to the ion current of the 36Ar isotope in order to correct for fluctuations of pressure and temperature, and the signals for O2 and CO2 were then converted to concentrations using a calibration gas (Ar with 2000 ppm of H2, O2, C2H4, and CO2 each, Westfalen, Germany) and considering a cell volume of ∼11 cm3, as introduced by Strehle et al. and Jung et al. for the gassing of (LMR-)NCM. 15,35 For details on the calibration procedure, see Tsiouvaras et al. 34
Impedance spectroscopy
All electrochemical impedance spectra were included directly into the cycling procedure of a multi-channel potentiostat VMP3 (BioLogic, France) and recorded in a climate chamber (Binder, Germany) at 25 °C in potentiostatic mode (PEIS), with an amplitude of 15 mV for 8 points per decade from 100 kHz to 100 mHz, including a data point at a frequency of 180 mHz. This results in an acquisition time of ∼10 min per PEIS. Each EIS spectrum consists of a full-cell spectrum (between working and counter electrode) and, by using a micro-reference electrode (μ-RE, i.e., a gold-wire reference electrode (GWRE) 36 ), also of the half-cell spectrum (i.e., between the working electrode and the μ-RE).
Coin cell assembly and testing
All electrochemical cycling tests (of both coin and Swagelok T-cells) were performed in a climate chamber (Binder, Germany) at 25 °C, using a battery cycler (Series 4000, Maccor, USA) for cell cycling or a multi-channel potentiostat (VMP3, Biologic, France) for cell cycling with PEIS.
For the Kr-BET surface area determination as well as for the TGA, NCM electrodes (14 mm in diameter, NCM:C65:PVDF mass ratio of 96:2:2, with the PC-bm electrodes compressed at 100 MPa and the PC and SC electrodes uncompressed) as well as C65 electrodes (14 mm in diameter, C65:PVDF mass ratio of 1:1, uncompressed) were assembled in coin cells (CR2032, Hohsen, Japan) using two glass fiber separators (16 mm in diameter), one polyolefin separator (17 mm in diameter, H2013, Celgard, USA) facing the NCM or C65 electrode, and 100 μl of LP57 electrolyte cycled against metallic lithium as counter electrode (15 mm in diameter).
For Kr-BET, the coin half-cells with lithium counter and NCM working electrodes were cycled at a C-rate of C/20 (corresponding to 13.8 mA/gNCM referenced to the theoretical capacity of 276.5 mAh/gNCM of NCM622). After an initial OCV phase of 1 h, the cells were charged to 3.9 VLi or to 4.4 VLi, where the potential was held for 1 h, followed by an OCV phase of 1 h. Additional cells were cycled to 4.4 VLi and, subsequently, discharged to 2.55 VLi, applying a potential hold of 1 h at both potentials, resulting in a total time of the experiment of 32 h. This procedure is shown in Fig. A·2 in the Appendix. To investigate the influence of the storage of the electrode in the electrolyte on the electrode surface area, additional cells with NCM or C65 electrodes were held at OCV for 24 h.
For thermal analysis via TGA, the coin half-cells with NCM electrodes were first held at OCV for 1 h and then charged at C/15 (corresponding to 18.3 mA/gNCM referenced to the theoretical capacity of 276.5 mAh/gNCM of NCM622) to 4.1 VLi, where the potential was held for 1 h, followed by another OCV phase of 1 h (this procedure is also shown in Fig. A·2).
To record the potential charge curves of the three NCMs, coin half-cells with lithium metal as the counter electrode (15 mm in diameter) and PC, PC-bm, and SC as working electrodes (14 mm in diameter, NCM:C65:PVDF mass ratio of 96:2:2, with the PC-bm electrodes compressed at 100 MPa and the PC and SC electrodes uncompressed) were assembled using two glass fiber separators (16 mm in diameter) and 100 μl of LP57 electrolyte. To allow for the assignment of the applied potential to an SOC (i.e., to a degree of delithiation of the NCM material) for each of the three NCMs, the coin half-cells were charged in constant-current mode to 5.0 VLi at a C-rate of C/20 (corresponding to 13.8 mA/gNCM).
T-cell assembly and testing
In preparation of the cycling experiments in T-cells (Swagelok, USA) with μ-RE (adapted and reprinted here from a previous publication 14 for the sake of completeness), capacitively oversized LTO electrodes (10.95 mm in diameter, 3.5 mAh/cm2) were pre-lithiated in spring-compressed T-cells using two glass fiber separators (11 mm in diameter) and 60 μl of LP57 electrolyte against metallic lithium (450 μm in thickness and 11 mm in diameter, Rockwood Lithium, USA) to ∼10 %SOC at a specific current of 30 mA/gLTO for 0.5 h, after having performed one full formation cycle at 30 mA/gLTO between 1.2 VLi and 2.0 VLi. After pre-lithiation, the LTO electrodes were harvested from the cells and used as the counter electrode in the pseudo full-cells for the electrochemical cycling tests (note that pseudo full-cell here refers to a cell with a specific working electrode and a capacitively oversized, pre-lithiated LTO electrode). As it was already discussed in a previous publication, 19 the pre-lithiated, capacitively oversized LTO are used because they provide: (i) a stable half-cell potential of 1.55 VLi over a wide SOC window, (ii) a sufficiently large capacity to take up the lithium from the investigated NCM working electrodes, and (iii) a sufficient excess of lithium to compensate for any lithium consumed by side reactions during cycling, so that the NCM working electrode can be fully lithiated for the EIS measurements that are being conducted in blocking conditions (see below). Due to the stable half-cell potential of 1.55 VLi of the LTO counter electrode, the NCM working electrode potential could be controlled by the cell voltage.
For the electrochemical cycling tests, spring-compressed T-cells with capacitively oversized pre-lithiated LTO as the counter electrode and NCM as working electrode (10.95 mm in diameter, NCM:C65:PVDF mass ratio of 96:2:2, with all NCM electrodes examined both uncompressed and compressed at 100 MPa) were assembled using two glass fiber separators (11 mm in diameter) and 60 μl of LP57 electrolyte. Between the two separators, a micro-reference electrode (μ-RE) was inserted, namely a gold-wire reference electrode (GWRE) based on the setup described by Solchenbach et al. 36 Prior to the experiments, the GWRE was lithiated in situ at 150 nA over 1 h from the LTO counter electrode before cycling, which establishes a constant GWRE potential of 0.31 VLi 36 that remained stable for more than 800 h (note that the GWRE lithiation charge of ∼0.15 μAh is negligible compared to the capacity of the counter electrode). For details about the cell setup and the preparation of the gold wire, please refer to the original publication. 36
To acquire EIS spectra under blocking conditions, represented by a very large or quasi-infinite charge-transfer resistance, the working electrode is cycled to the fully discharged state (corresponding to ∼5 %SOC due to the irreversible capacity of the first cycle) at a potential of 2.55 VLi for all active materials (corresponding to a cell voltage of 1.00 VLTO in the pseudo full-cells), i.e., to full lithiation for the NCM working electrodes, where the working electrode was then held for 1 h prior to taking EIS spectra (for further details, see Ref. 19). The long-term cycling procedure (adapted and reprinted here from a previous publication 14 for the sake of completeness), was initiated by an OCV phase of 10 h, during which a PEIS was taken every 1 h. To identify the pristine value of the electrode capacitance (cycle #0), the NCM working electrode was discharged to the lower cutoff potential of 2.55 VLi at C/10 (corresponding to 27.7 mA/gNCM) in CC mode, where a CV hold of 1 h was performed, followed by a PEIS. During conditioning (cycle #1), the electrodes were charged at C/10 in CC mode for 1 h, then discharged to the lower cutoff potential of 2.55 VLi at C/10 in CC mode, where a CV hold of 1 h was performed, followed by a PEIS. Since nickel-rich CAMs are commonly slightly overlithiated (by up to 1 %) in the synthesis process, the conditioning step was included in the procedure to ensure comparable impedance spectra for each cycle, namely by assuring that similar SOCs are obtained by the potential hold of 1 h at 2.55 VLi, especially when comparing different NCM active materials.
For the subsequent cycling, three charge/discharge cycles are executed, with a charge to the initial upper cutoff potential of 3.9 VLi at C/10 followed by a CV hold until the current dropped to below 0.1 mA (∼C/20, CCCV mode), and with a discharge to the lower cutoff potential at C/10 followed by a CV hold of 1 h before recording a PEIS (corresponding to cycle #2, #3, and #4). This set of three cycles is then repeated while increasing the upper cutoff potential by 0.1 V for each set after every third cycle, finishing with three cycles to 5.0 VLi (corresponding to cycle #35, #36, and #37). The impedance spectra taken in blocking conditions are numbered by the cycles the cell had performed up to that point (e.g., #7 after the three cycles to 4.0 VLi).
To record the charge curves of the first charge of the three NCMs (shown in Fig. A·4 in the Appendix), coin half-cells with lithium metal as the counter electrode (15 mm in diameter) and PC, PC-bm, and SC as working electrodes (14 mm in diameter, NCM:C65:PVDF mass ratio of 96:2:2, with the PC-bm compressed at 100 MPa and the PC and SC electrodes uncompressed) were assembled using two glass fiber separators (11 mm in diameter) and 100 μl of LP57 electrolyte. To allow for the assignment of the applied potential to an SOC (i.e., to a defined degree of delithiation) for each of the three NCMs, the coin half-cells were charged in constant-current mode (CC) to 5.0 VLi at a C-rate of C/20 (corresponding to 13.8 mA/gNCM).
For the discharge rate tests, spring-compressed T-cells with a lithium metal reference (6 mm in diameter) and a lithium metal counter electrode (11 mm in diameter) as well as NCM-based working electrodes (10.95 mm in diameter, NCM:C65:PVDF mass ratio of 90:5:5, all NCM electrodes compressed at 200 MPa) were assembled using three glass fiber separators (11 mm in diameter, two between working and counter electrode and one on the lithium metal reference electrode) and 90 μl of LP57 electrolyte. The NCM electrodes were cycled between 3.0 VLi and 4.1 VLi measured against the potential of the lithium metal reference electrode. After an initial OCV phase of 1 h, the cells were charged in CCCV mode, with a CV step for 1 h or until the current dropped to below C/20, and were then discharged in CC mode. The applied discharge C-rates (referenced to the theoretical capacity of 276.5 mAh/gNCM of NCM622) were increased from C/100 to C/50, C/20, C/10, C/5, C/2, 1C, 2C, 5C, 10C, 20C, while each rate was applied for three cycles. For C-rates between C/100 and C/2, the charge currents were set to be the same as the ones for discharge, and set to C/2 for all other rates. After the rate test, another 14 cycles with a charge rate of C/2 and a discharge rate of 1C as well as three cycles at C/10 for both charge and discharge were appended.
Cell disassembly
In several experiments, the NCM electrodes were harvested from charged or discharged coin half-cells under inert atmosphere to determine their specific surface area by Kr-BET as well as their thermal stability by TGA. Any residue of the conductive salt was removed from the electrodes in a three-step sequential washing procedure: first, they were washed for 5 min in 5 ml EC:EMC 3:7 w/w (Gelon Lib, China), followed by a soaking step of 24 h in 1 ml DMC (anhydrous, ≥99 %, Sigma Aldrich, USA) and, finally, a washing step of 5 min in 5 ml DMC.
Surface area analysis
The surface area of the active material powders and of the pristine as well as of the harvested and washed electrodes was determined by krypton gas physisorption measurements at 77 K (adapted and reprinted here from previous publications
14,19,21,23
for the sake of completeness), measuring at 13 points between  using an autosorb iQ (Quantachrome Instruments, USA). Comparative N2-BET measurements for the pristine materials (C65 and NCM powders) are within ±10 % of the specific surface areas obtained by krypton physisorption (also referred to as Kr-BET, referring to the original publication by Brunauer, Emmett, and Teller
37
). The advantage of the measurement with krypton is a superior sensitivity of this method, since only ca. 1/100 of the total surface area is required for krypton compared to nitrogen physisorption measurements, so that Kr-BET areas can be obtained for electrodes with 14 mm in diameter, whereas an approximately 100-fold larger electrode area would be required for meaningful N2-BET measurements. Prior to Kr-BET measurements, both powder samples as well as samples of pristine or harvested and washed electrodes were dried at 120 °C under vacuum for 6 h. (It has to be noted that these conditions are common, both for the outgassing of samples for BET measurements as well as for the drying of battery electrodes. No Kr-BET measurements were performed with non-dried electrodes, as this would not lead to reliable surface area measurements).
using an autosorb iQ (Quantachrome Instruments, USA). Comparative N2-BET measurements for the pristine materials (C65 and NCM powders) are within ±10 % of the specific surface areas obtained by krypton physisorption (also referred to as Kr-BET, referring to the original publication by Brunauer, Emmett, and Teller
37
). The advantage of the measurement with krypton is a superior sensitivity of this method, since only ca. 1/100 of the total surface area is required for krypton compared to nitrogen physisorption measurements, so that Kr-BET areas can be obtained for electrodes with 14 mm in diameter, whereas an approximately 100-fold larger electrode area would be required for meaningful N2-BET measurements. Prior to Kr-BET measurements, both powder samples as well as samples of pristine or harvested and washed electrodes were dried at 120 °C under vacuum for 6 h. (It has to be noted that these conditions are common, both for the outgassing of samples for BET measurements as well as for the drying of battery electrodes. No Kr-BET measurements were performed with non-dried electrodes, as this would not lead to reliable surface area measurements).
Thermal analysis
To investigate the thermal stability of charged electrodes by thermogravimetric analysis (TGA), the pristine as well as the washed and harvested electrodes were dried at 120 °C under dynamic vacuum for 6 h. To avoid contact to ambient atmosphere during the transfer to the TGA device (TGA/DSC 1, Mettler Toledo, USA), the electrodes were placed in crimped, air-tight aluminum crucibles (Mettler Toledo, USA), which were opened by a needle right before the start of the TGA measurement. First, the measurement cell with the sample was flushed at 25 °C for 5 min under an argon flow rate of 200 ml/min, which was then reduced to 50 ml/min for another 5 min at 25 °C. Subsequently, the sample was heated under a constant argon flow rate of 50 ml/min applying a temperature ramp of 5 K/min from 25 °C to 325 °C, while the mass of the sample was recorded.
Results and Discussion
Visual investigation of pristine NCM622 powders
In advance to the electrochemical investigations, the morphology of the three NCM622 CAM powders is examined by SEM and BET surface area measurements with krypton gas (Kr-BET). The as-received pristine polycrystalline NCM622 powder (PC, marked in blue color) displayed in Fig. 1a consists of spherical secondary particles with a diameter of 5–10 μm, each comprising thousands of primary crystallites. Kr-BET yields a specific surface area of 0.32 m2 NCM/gNCM for PC, which (based on a spherical approximation of solid spheres with a single diameter d = 6/(ABET·ρ)) would correspond to an average diameter of d ≈ 4 μm, using the crystallographic NCM622 density of ρ = 4.78 g/cm3, 17 suggesting that mostly the external surface area of the secondary particle agglomerates of the pristine PC material is accessible to the electrolyte. For the pristine ball-milled polycrystalline NCM622 (PC-bm, yellow) shown in Fig. 1b, most of the secondary agglomerates of the polycrystalline NCM622 have been completely separated into their primary particles, showing individual crystallites with a size of 0.2–1.0 μm, while only a few agglomerates with a size of ∼2 μm remain (see also the magnification in Fig. A·1 in the Appendix). If compared to the original polycrystalline material, this separation of the secondary agglomerates into its primary crystallites results in an 8-fold increase of the specific surface area to 2.25 m2 NCM/gNCM, corresponding to an average particle size of 0.6 μm (for the spherical approximation). In contrast to the as-received polycrystalline NCM622, the single-crystalline NCM622 (SC, green) consists of individual monolithic particles without significant agglomeration, with a particle size ranging from 2–8 μm, as displayed in Fig. 1c, exhibiting a specific surface area of 0.27 m2 NCM/gNCM, very similar to that of the PC material.
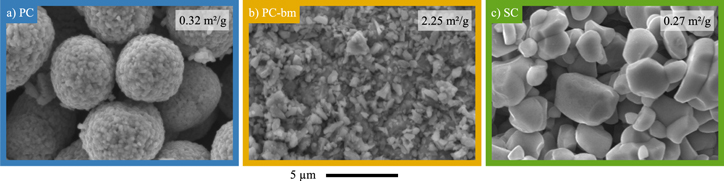
Figure 1. Visual investigation of the particle morphology of the three pristine NCM622 powders by top-view SEM in secondary electron mode at 15 kV. a) Polycrystalline NCM (PC). b) Ball-milled polycrystalline NCM (PC-bm). c) Single-crystalline NCM (SC). The specific surface area obtained by Kr-BET is displayed for each material in the respective panel.
Download figure:
Standard image High-resolution image
Figure 2. Specific surface area of PC (blue), PC-bm (yellow), and SC (green) electrodes obtained by Kr-BET measurements at different states of charge. Electrodes were used in the pristine state or harvested from stored or cycled cells. Coin half-cells were assembled using lithium metal as counter electrode, 100 μl of LP57 electrolyte, two glass fiber separators, and one polyolefin separator facing the NCM electrode. Cells were either stored at OCV for 24 h, charged to 3.9 VLi or to 4.4 VLi, or discharged to 2.55 VLi after one full cycle to 4.4 VLi, as depicted by the exemplary potential profiles in Fig. A·2. Electrodes were harvested, washed in carbonate-based solvents, and subsequently dried. a) Specific electrode surface area (in units of m2/gelectrode, left y-axis) and specific NCM surface area (in units of m2 NCM/gNCM, right y-axis), whereby the latter was obtained by the subtraction of the contribution of the C65 electrode (gray area, multiplied by 0.04). The horizontal dashed lines indicate the expected surface area obtained from Kr-BET measurements of the NCM powders (plotted on the right y-axis). The error bars correspond to the minimum/maximum value of two measurements. b) NCM surface area normalized to the value of the pristine NCM surface area, calculated from the values of the right axis of Fig. 2a. The error bars are determined by the laws of error propagation taking into account the error value of the C65 electrode.
Download figure:
Standard image High-resolution imageTherefore, the three NCM622 materials used in this study allow for the discrimination of the effect of particle morphology (polycrystalline vs. single-crystalline) for a similar pristine specific surface area when comparing the PC and SC materials, whereas the comparison of the PC-bm and SC materials allows to examine the effect of the difference in pristine specific surface area (with an ∼8-fold difference) for a similar single-crystalline particle morphology (i.e., without significant secondary agglomerates).
NCM surface area during the first charge/discharge cycle
Due to their secondary structure, polycrystalline NCM particles experience cracking upon long-term cycling, caused by the repeated volume change of the NCM unit cell upon (de)lithiation and, more importantly, by the anisotropic change of the lattice parameters a and c that induces stress and strain throughout the secondary particle agglomerate. 16,17,19 Particle cracking increases the surface area, facilitating unwanted side reactions as well as the loss of electrical contact between the separated primary crystallites, both leading to a decrease in cell capacity. In a previous publication, 19 SEM analysis of the cross section of an NCM electrode cut by a focused ion beam (FIB-SEM) showed that this chemo-mechanical effect does not only lead to cracking upon extended charge/discharge cycling, but also induces the reversible formation of cracks through the polycrystalline particle in its charged state already in the very first cycle. For single-crystalline materials, however, no (reversible) surface area change is expected upon (de)lithiation due to their monolithic nature having no secondary structure. To quantify the extent of the surface area change of the three active materials during the first charge/discharge cycle, Kr-BET measurements of pristine, stored, and cycled electrodes are performed. To illustrate the procedure, the respective voltage profiles of the stored and cycled PC electrodes are depicted in Fig. A·2.
As mechanical compression of the electrodes affects the integrity of the CAM particles, 19 it was intended to use uncompressed electrodes. However, it was found that the electrochemical performance of the PC-bm material is very poor when only 2 wt% C65 were used for electrode preparation, as this is too low for the very high specific surface area of PC-bm (2.25 m2 NCM/gNCM) and thus results in significant overpotentials during cycling (data not shown). At the same time, increasing the carbon content in the electrode was not possible due to the high specific surface area of C65, as it would then be the main contributor to the electrode surface area, thereby masking any changes in the CAM surface area. For this reason, the electrodes based on the PC-bm material had to be compressed, but, since the primary crystallites of the PC-bm material were already mostly separated, no change of its specific surface area is expected upon electrode compression. A change of the surface area of the PC-bm material could be excluded by Kr-BET measurements of pristine (un)compressed PC-bm electrodes, which exhibited similar specific surface area values of 2.81 ± 0.03 m2/gelectrode for the uncompressed electrodes (data not shown) and 2.92 ± 0.05 m2/gelectrode for the electrodes compressed at 100 MPa (see Fig. 2a), respectively (note that the error values of the specific surface areas correspond to the minimum/maximum values determined from the separate measurement of two electrodes and are always below ±0.07 m2/gelectrode or below ±0.07 m2 NCM/gNCM.). Even though we illustrated that the specific surface area and, therefore, the integrity of the PC-bm primary crystallites was maintained despite the mechanical compression at 200 MPa, the integrity is certainly dependent on the applied compressing force and may be affected negatively at higher compressive forces. The advanced mechanical stability of the single-crystalline material as compared to the polycrystalline equivalent is discussed in detail in Fig. 3. For the materials with relatively low specific surface area (i.e., PC and SC), no compression was required, and uncompressed electrodes were used for this experiment.
The measured values of the electrodes obtained by Kr-BET are depicted in Fig. 2a (left y-axis): in the pristine state, the specific surface areas are determined to be 1.20 ± 0.03 m2/gelectrode, 2.92 ± 0.05 m2/gelectrode, and 1.17 ± 0.03 m2/gelectrode for the PC, PC-bm, and SC electrodes, respectively. For the electrodes charged to 3.9 VLi or to 4.4 VLi, it is observed already in this representation that there is a relatively small increase of the specific surface area of the SC and PC-bm electrodes, while the one of the PC electrodes exhibits a significant increase.
To allow for a quantitative analysis of the surface area change of the NCM active material only, the contribution of C65 and PVDF, which is assumed to remain constant, is subtracted by considering the specific surface area of a C65 electrode (C65:PVDF 1:1 w/w) of 17.9 ± 0.4 m2/gelectrode: as the NCM electrodes comprise 2 wt% of C65 and 2 wt% of PVDF, the conductive carbon and binder are assumed to contribute 0.72 ± 0.01 m2/gelectrode to the NCM electrode (corresponding to 4 % of the measured value of the C65 electrode and as marked by the gray area in Fig. 2a). Subtracting this value provides a good estimate of the contribution of the NCM active material to the specific surface area of the electrode and, when normalized by the mass of the NCM in the electrode (mNCM = 0.96·melectrode), of the specific surface area of the NCM material. The latter is displayed on the right y-axis of Fig. 2a in units of m2 NCM/gNCM. For the further discussion, this latter contribution of the NCM only will be considered.
The pristine NCM surface area of 2.30 ± 0.05 m2 NCM/gNCM extracted from the PC-bm electrode (left-most yellow symbol in Fig. 2a) agrees well with the one of 2.25 m2 NCM/gNCM of the PC-bm powder (dashed yellow line). For the PC and SC materials, however, the NCM surface areas in the electrodes of 0.50 ± 0.04 and 0.47 ± 0.04 m2 NCM/gNCM (left-most blue and green symbols) are noticeably larger than the 0.32 and 0.27 m2 NCM/gNCM of the pristine powders (dashed blue and green lines), respectively. The difference for these two NCMs with a low specific surface area could stem from an underestimation of the contribution of C65 and PVDF in the NCM electrode: based on the specific surface area of the C65 powder of 64 m2 C65/gC65, one would expect a value of at least 32 m2/gelectrode for the C65 electrode with PVDF, as 50 wt% are contributed by the C65. From the value of 17.9 ± 0.4 m2/gelectrode which was actually measured, however, we conclude that the binder might agglomerate C65 particles and/or cover its surface and/or its pores, resulting in a lower electrode surface area as expected from the powder values. When an NCM electrode is prepared, the binder is distributed between NCM and C65, reducing the covering effect of the binder on the carbon and therefore, possibly increasing the contribution of the C65 to the surface area of the NCM electrode. This increase would result in the observed overestimation of the NCM specific surface area and an underestimation of its relative increase upon charge; therefore, the determined NCM specific surface area increase represents a lower limit only.
To assure that the mere exposure of the electrodes to the electrolyte does not affect the Kr-BET measurement (e.g., through the decomposition of residual lithium salts such as Li2CO3 in pores of the polycrystalline particles by HF impurities), 23,38 all electrodes were also stored with electrolyte in the cell at OCV for 24 h, then harvested, washed, and subjected to Kr-BET measurements. In this experiment, the surface area of the C65 electrode remains constant at 18.0 ± 0.7 m2/gelectrode (data not shown), which is why it is assumed to also be unchanged throughout the following experiments. The stored NCM electrodes exhibit NCM surface areas of 0.41 ± 0.02 m2 NCM/gNCM, 2.33 ± 0.02 m2 NCM/gNCM, and 0.51 ± 0.07 m2 NCM/gNCM for the PC, PC-bm, and SC electrodes, respectively (see second set of symbols from the left in Fig. 2a), which are essentially identical with the values obtained for the pristine electrodes within the measurement error.
After the charge to 3.9 VLi (corresponding to 49 %SOC, see Fig. A·4 in the Appendix), the specific surface area of the SC material remains unchanged (showing a value of 0.50 ± 0.02 m2 NCM/gNCM) and that of the PC-bm material increases only slightly (to 2.44 ± 0.07 m2 NCM/gNCM). In contrast to these two single-crystalline materials, the specific surface area of the polycrystalline PC material increases drastically (to 1.26 ± 0.05 m2 NCM/gNCM). This value corresponds to a ∼2.5-fold specific surface area increase as compared to the pristine PC material, which is depicted in Fig. 2b. These trends continue when the electrodes are charged to 4.4 VLi (corresponding to 76 %SOC, see Fig. A·4): the specific surface areas of both the SC and PC-bm materials increase slightly to 0.65 ± 0.02 and 2.68 ± 0.04 m2 NCM/gNCM, respectively, while the one of the PC material increases further to 1.48 ± 0.02 m2 NCM/gNCM, corresponding to a ∼3-fold increase over the pristine PC material. Additionally, this experiment shows that the specific surface area of the PC material after its first charge to 4.4 VLi reaches 55 % of the specific surface area of the pristine PC-bm, what implies that more than half of the surface area of the primary crystallites in the polycrystalline secondary particle agglomerates is exposed to the electrolyte already during the very first charge.
Discharging again to 2.55 VLi after the initial charge to 4.4 VLi, the NCM materials show specific surface areas which are similar to the ones in their pristine state: 0.49 ± 0.02 m2 NCM/gNCM for PC, 2.55 ± 0.02 m2 NCM/gNCM for PC-bm, and 0.48 ± 0.02 m2 NCM/gNCM for SC. This is in contrast to a previous study, where we found that the specific capacitance of a polycrystalline NCM622 increases by ∼50 % and by ∼70 % after a first full cycle to 4.2 VLi and 4.5 VLi, respectively, 19 so that one would have expected a similar increase in NCM specific surface area. This suggests that for the here performed ex situ surface area determination by Kr-BET, it is possible that small pores are closed/clogged due to the washing and drying procedure of the harvested electrodes.
De Biasi et al. showed that NCM622 experiences a volume change of its unit cell of −0.8 % as well as a change of the ratio of its a and c lattice parameters of +3.3 % for a charge to 3.9 VLi, whereas a charge to 4.4 VLi induces a volume change of −3.0 % and an a/c change of +1.9 %. Apparently, these structural changes are responsible for the up to ∼3-fold specific surface area of the here investigated polycrystalline NCM622 (PC) observed in the charged state, which can be induced by cracking of the primary crystallites and/or by a gradual separation of the primary crystallites in the secondary particle agglomerates. The former is expected to be minor due to the much lower specific surface area increase of the single-crystalline materials (SC and PC-bm, see Fig. 2a), so that the major effect must be the formation of cracks between the primary crystallites in the secondary particle agglomerates, in which case the specific surface area increase should depend on the size, shape, and orientation of the primary crystallites, as suggested by Kim et al. 39 Similar increases in the specific surface area in the charged state were also observed for NCM811 by Trevisanello et al., 20 who showed by Kr-BET that the NCM811 specific surface area changes by ∼3.5-fold and ∼4.5-fold when charged to 3.9 VLi (∼50 %SOC) and 4.2 VLi (∼75 %SOC), respectively. Our study shows that this process seems to be reversible, as the specific surface area of the PC material discharged after one full cycle is similar to the one observed for the pristine material, suggesting that the initially formed cracks close again in the discharged state.
The reversible change of the specific surface area by a factor of ∼1.4 between the charged state at 4.4 VLi and the subsequent discharged state, however, cannot likely be explained by reversible opening and closing of cracks between primary particles, as very few particles are fused together (see Fig. 1). However, the reversible gliding of the (003) planes, previously observed by scanning tunneling electron microscopy (STEM) and in situ atomic force microscopy (AFM) in a study by Bi et al. for a nickel-rich NCM, 40 could roughen the surface area of single-crystalline materials in the charged state and, therefore, be the origin of the (relatively small) reversible change in surface area. This would also explain the small reversible change in specific surface area observed for the PC-bm material (∼1.2-fold).
Overall, the behavior of the specific NCM surface area as a function of its state of charge differs significantly depending on the NCM particle morphology: polycrystalline materials increase their surface (reversibly) already during the first charge, whereas the surface area of single-crystalline materials remains almost constant. While the absolute value of the specific surface area of PC material in its pristine state is similar to the one of the SC material, its drastic specific surface area increase upon charge is expected to promote a larger amount of released lattice oxygen at high state of charge, an improved rate capability, as well as a decreased thermal stability.
Morphological stability at high state of charge
To investigate the effect of the SOC on the particle integrity for the poly- and single-crystalline morphologies, the NCMs are cycled at slow rates while the upper cutoff potential is increased stepwise by 0.1 V every three cycles, using the exact procedure introduced in a previous publication. 14 Any induced morphological changes that increase the electrode surface area can be followed through the measurement of the NCM capacitance in the fully discharged state, i.e., in blocking conditions.
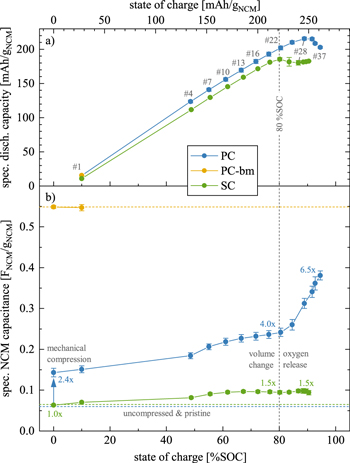
Figure 3. Electrochemical cycling data as a function of SOC for PC (blue), PC-bm (yellow), and SC (green) as working electrodes (all compressed at 100 MPa) in pseudo full-cells with 60 μl LP57, two glass fiber separators, and a μ-RE, using pre-lithiated, capacitively oversized LTO as the counter electrode. Following a previously developed procedure, 14 the cells were cycled at 25 °C and at C/10 to an upper cutoff potential which was increased every three cycles by 0.1 V, starting at 3.9 VLi. Impedance spectra of the NCM working electrodes were recorded in blocking conditions after a potential hold of 1 h at 2.55 VLi (15 mV amplitude, from 100 kHz to 100 mHz), from which the electrode capacitance was extracted. The obtained capacity and capacitance data are depicted in Fig. A·3 as a function of cycle number and then presented here for every third cycle as a function of SOC (top x-axis in mAh/gNCM, bottom x-axis in terms of the degree of delithiation x in Li1-x MO2), which was calculated for each NCM material from the applied upper cutoff potential using the potential curves of the first charge depicted in Fig. A·4. The vertical gray dashed line marks the value of ∼80 %SOC (extracted from Fig. A·4), and the gray numbers mark the cycle for which the data were extracted from Fig. A·3. The specific capacitances and the specific discharge capacities represent the mean of two nominally identical cells, with the error bars corresponding to the minimum/maximum value of two cells. a) Specific discharge capacity delivered at a given SOC and normalized by the NCM mass. b) Specific NCM capacitances (in units of FNCM/gNCM). Derived from the specific capacitance of the NCM working electrodes (in units of F/gelectrode, as depicted in Fig. A·3b) determined from the imaginary impedance at 180 mHz in blocking conditions, with a subsequent subtraction of the contribution of the C65 electrode and a normalization to the NCM mass. The blue and green horizontal dashed lines indicate the capacitance value of the pristine uncompressed PC and SC electrodes, respectively, and the yellow dashed line the one of the compressed pristine PC-bm electrode. The blue and green numbers indicate the relative change of the capacitance at selected SOCs as compared to the pristine uncompressed electrode. The error bars are determined by the laws of error propagation (see supporting information of a previous publication 19 ), using the average capacitances and their minimum/maximum values given by Fig. A·3b.
Download figure:
Standard image High-resolution imageIt was shown previously that the release of lattice oxygen from NCMs due to structural instabilities which are often attributed to the H2-H3 phase transition at high degrees of delithiation, viz., at/above ∼80 %SOC, has a negative effect on the discharge capacity; 7,15,41 additionally, these processes are accompanied by a sudden increase of the specific surface area of polycrystalline NCMs at high SOCs. 14 To better illustrate this behavior, the measured specific discharge capacity and electrode capacitance data (depicted in Fig. A·3 as a function of cycle number) are plotted as a function of SOC in Fig. 3. The latter is determined from an analysis of the potential curves collected in half-cells charged to 5.0 VLi (see Fig. A·4), allowing to assign each one of the applied upper cutoff potentials (i.e., 3.9, 4.0, ..., and 5.0 VLi) to its respective SOC (corresponding to the degree of delithiation x in Li1-x MO2), as introduced previously. 14 For the PC-bm material, however, only the pristine and the conditioned electrode (i.e., after a C/10 charge of 1 h and subsequent discharge to 2.55 VLi) could be analyzed, since the impedance spectra obtained after subsequent cycling were corrupted by additional features, as discussed below in more detail.
The specific discharge capacity depicted in Fig. 3a increases linearly with SOC for both the PC and SC materials, up to a degree of delithiation of ∼80 %SOC (i.e., up to an upper cutoff potential of 4.5 VLi in cycle #22). During these first 22 cycles, the SC material consistently delivers ∼10 mAh/gNCM less discharge capacity as compared to the PC material, what we assign to a kinetic limitation caused by the much lower specific surface area that is accessible to the electrolyte in the charged state even after one cycle (see Fig. 2a); this difference is further analyzed below in the discussion on the rate capability in Fig. 5. At 4.5 VLi (or ∼80 %SOC), the PC material reaches a discharge capacity of 202 ± 3 mAh/gNCM compared to only 185 ± 2 mAh/gNCM for the SC material (note that the error values of the specific capacities as well as of the specific capacitances correspond to the minimum/maximum values determined from the measurement of two cells). Above 80 %SOC (i.e., starting at 4.6 VLi in cycle #25), the discharge capacity does not follow its observed linear increase with SOC anymore and even decreases significantly, particularly in the case of the SC material: while the PC material delivers its maximum discharge capacity of 216 ± 2 mAh/gNCM at 4.7 VLi, the maximum discharge capacity of 185 ± 3 mAh/gNCM is already reached at 4.5 VLi (#28) for the SC material. We assign this earlier and larger decrease in discharge capacity of the SC material to its almost an order of magnitude larger primary crystallite size: while the release of lattice oxygen near/beyond ∼80 %SOC is known to form a resistive, oxygen-depleted surface layer on NCMs, 15,23 the specific surface area of the SC material remains at lower values as compared to the PC material, both when charged (see Fig. 2) and/or when electrodes are mechanically compressed during preparation (see Fig. 3b), what results in a higher surface-area-normalized current at a given C-rate and, therefore, in a higher overpotential during cycling. This effect (amongst others) decreases the capacity of single-crystalline CAMs at high SOCs, as we had previously observed and analyzed in more detail for NCM851005 in similar experiments. 14 Overall, a high SOC is detrimental for the discharge capacity of NCMs, especially for SC materials with larger primary crystallite size.
To track the effect of a high SOC on the morphological stability of the three NCMs, the electrode capacitance was measured in situ from the recorded impedance spectra as a function of the upper cutoff potential (reprinted here from a previous publication for the sake of completeness
14
). All spectra of the working electrode were collected via the μ-RE (i.e., the gold-wire reference electrode
36
(GWRE)) after each cycle in the fully discharged state at an NCM potential of 2.55 VLi. As the charge transfer of NCMs is impeded in the fully discharged/lithiated state, resulting in a very large or quasi-infinite value of the charge-transfer resistance (so-called blocking conditions), the impedance is dominated by the capacitive contribution of the electrochemical double layer at the electrode/electrolyte interface.
19,42
Assuming that the surface-area-normalized capacitance is distinct, constant, and uniformly distributed for each of the electrode components (i.e., the active material and the conductive carbon), the capacitance contribution of each of the electrode materials would be proportional to their respective surface area, what was proven by Kr-BET in previous publications.
14,19
There, we had also shown that the electrode capacitance does not necessarily have to be extracted from a fit of the entire impedance spectrum, but that the impedance of the individual frequency point at 180 mHz under blocking conditions is sufficient to accurately determine the electrode capacitance (for more details, see Ref. 19). Quantitatively, the electrode capacitance is obtained from the capacitive branch of the NCM electrode impedance spectrum in blocking conditions, which was achieved for all recorded impedance spectra through the full lithiation of the NCM particles by a potential hold of 1 h at 2.55 VLi. From the spectra, the value of the imaginary part of the electrode impedance  at the selected frequency of
  (with
(with  ) yields the electrode capacitance
  by means of Eq. 1:
19
by means of Eq. 1:
19

The thus obtained capacitance values can then be normalized by the electrode mass (in units of F/gelectrode) serving as a measure for the specific electrode surface area.
Unfortunately, in case of the uncompressed PC-bm electrodes, the impedance spectra showed an additional semicircle (of ∼1 kΩ·cm2 electrode) at high to medium frequencies (at around 100 kHz to 1 Hz) in their discharged state only; this feature was absent for the compressed PC-bm electrodes in their pristine state but developed also there upon cycling (with a somewhat smaller value ranging from 0.1–1 kΩ·cm2 electrode). We assign these observations to the relatively large surface area of the PC-bm material (of 2.25 m2 NCM/gNCM) and the resulting low carbon-to-surface-area ratio in combination with the poor electrical conductivity of NCM at full lithiation, 43 which seems to result in a growing contact resistance upon cycling as well as a poor electrical conductivity through the electrode at low SOC (note that a similar behavior was also observed for an LNMO (LiNi0.5Mn1.5O4) cathode when using 1.5 wt% rather than 5 wt% of conductive carbon 44 ). An increase of the carbon content in the electrode would alleviate this problem but was not feasible for the analysis of the NCM capacitance since the excessively high capacitance contribution from the high-surface-area carbon would not allow anymore to quantify the NCM capacitance at higher carbon content (due to the high specific surface area of carbon compared to that of the NCMs, as discussed in detail for the Kr-BET measurements).
For the PC and SC materials, the effect of electrode compression during fabrication of the polycrystalline and single-crystalline morphologies is analyzed in the pristine state (shown at 0 %SOC), comparing both uncompressed and compressed electrodes for the PC and SC materials. As the determination of the capacitance of the uncompressed PC‑bm electrode was not possible (see above), and as the primary crystallites of PC-bm were already separated mechanically during ball milling, the effect of compression as well as the effect of charge/discharge cycling on the electrode surface area is assumed to be negligible for PC‑bm electrodes; therefore, the results of the PC‑bm material are only depicted for compressed electrodes in their pristine and conditioned state, representing the value of the capacitance expected for the fully exposed primary crystallite surface area of the PC material.
The measured specific electrode capacitance of the three NCM morphologies is displayed in Fig. A·3b as a function of cycle number. In the pristine uncompressed state (electrodes having a thickness of 46 ± 3 μm and a porosity of 59 %), the capacitance amounts to 0.127 ± 0.001 F/gelectrode and 0.131 ± 0.001 F/gelectrode for the PC and SC electrodes, respectively (shown in Fig. A·3b as green and blue horizontal dashed lines); in the pristine compressed state (electrodes having a thickness of 37 ± 3 μm and a porosity of 49 %), the capacitance is increased to 0.207 ± 0.010 F/gelectrode for PC but remained unchanged with a value of 0.130 ± 0.001 F/gelectrode for the SC material (shown in Fig. A·3b as green and blue symbols at 0 %SOC, respectively), while the one of the PC-bm material is 0.596 ± 0.004 F/gelectrode (yellow horizontal dashed line and yellow symbol at 0 %SOC).
For a quantitative analysis of the capacitance of the NCM active material only, the contribution of C65 and PVDF is subtracted: for the C65 electrode (with a composition of C65:PVDF of 1:1 w/w), a specific capacitance of 1.729 ± 0.028 F/gelectrode was previously obtained. 19 As the NCM electrode comprises 4 wt% of the carbon-binder mixture at the same C65:PVDF ratio, a capacitance value of 0.069 ± 0.001 F/gelectrode (corresponding to 4 % of the measured value of the C65 electrode, and displayed as the gray area in Fig. A·3b) is subtracted from the capacitance value of the electrode, resulting in the value of the NCM only, which is subsequently normalized to the NCM mass in the electrode, as done in a similar manner above for the Kr-BET measurements. Through this approach, capacitance values of the NCM only in the pristine uncompressed electrode of 0.060 ± 0.001 FNCM/gNCM and 0.065 ± 0.001 FNCM/gNCM are obtained for the PC and SC material, respectively (shown in Fig. 3b as green and blue horizontal dashed lines). In the pristine compressed state, the NCM capacitance amounts to 0.143 ± 0.010 FNCM/gNCM for the PC material, 0.549 ± 0.003 FNCM/gNCM for the PC-bm material, and 0.064 ± 0.001 FNCM/gNCM for the SC material. When comparing the NCM capacitance values of the pristine electrodes (uncompressed for the PC and SC materials, and compressed for the PC-bm material), a ratio of 1:0.93:8.5 is observed for PC:PC-bm:SC, which agrees reasonably well (within an error of <20 %) with the ratio of the specific surface areas of the pristine powders of 1:0.82:7.0 obtained by Kr-BET (see Fig. 1). This illustrates nicely that the in situ determined capacitance is a reasonably good measure of the CAM specific surface area determined by ex situ Kr-BET and demonstrates the convenience and relevance of the capacitance-based in situ determination of any changes in the CAM specific surface area.
Upon electrode compression (at 100 MPa for 30 s), the NCM capacitance of the PC material changes by a factor of 2.4x from a value of 0.060 ± 0.001 FNCM/gNCM to 0.143 ± 0.010 FNCM/gNCM. The same increase was observed already for the same polycrystalline NCM622 material in a previous publication (also 2.4-fold when compressed to 100 MPa), where this capacitance change was verified through Kr-BET measurements and further explained by FIB-SEM images, which clearly identified the appearance of partially cracked secondary particles. 19 For the SC material, however, the capacitance remains unchanged at 0.064 ± 0.001 FNCM/gNCM upon compression. As the capacitance and, therefore, the specific surface area of the single-crystalline materials is unaffected, particle cracking by mechanical compression (at least for pressures up to 100 MPa) can be excluded, highlighting the mechanical stability of the primary crystallites in contrast to that of the secondary particle agglomerates in the polycrystalline material, as it was already shown qualitatively in a previous study. 45
During the conditioning cycle to 10 %SOC (see cycle #1 in Fig. 3b), the NCM capacitance of the PC-bm material remains unchanged as compared to its compressed and pristine state (yellow symbols and dashed yellow line). For the compressed PC and SC materials, however, a slight increase of the capacitance is observed during conditioning, which then continues for both materials during the subsequent cycles (blue and green symbols, respectively): For the SC material, the evolution of the NCM capacitance does not exceed a value of 0.098 ± 0.006 FNCM/gNCM, corresponding to an increase of not more than 1.5x over the entire SOC range, which is already reached when cycled to 67 %SOC (#13 or 4.2 VLi). The PC material, however, shows an enhanced and steady NCM capacitance increase during the cycling up to 80 %SOC (cycle #22 or 4.5 VLi), yielding a capacitance of 0.242 ± 0.010 FNCM/gNCM, i.e., 4.0x larger than in its pristine and uncompressed state. This steady increase is interrupted by a sudden rise of the capacitance when cycled beyond 80 %SOC (marked by the vertical gray dashed line), which reaches 0.381 ± 0.011 FNCM/gNCM when cycled up to 95 %SOC (#37 or 5.0 VLi). The possible causes for this increase are the change of the unit cell volume of the oxygen-depleted surface layer and/or the decomposition of residual lithium salts 38 in the pores, as already discussed in detail in our previous publication. 14
Most importantly, it must be noted that the NCM capacitance (and thus its specific surface area) of the PC material does not only rise by a factor of 6.5x when cycled to high SOCs as compared to its pristine and uncompressed state, but that it reaches 69 % of the NCM capacitance value of the PC-bm material for which the secondary agglomerates were almost fully separated into their primary crystallites. This implies that two thirds of the primary crystallite surface area of the polycrystalline NCM622 material are exposed to the electrolyte already after a few cycles to high SOC. In contrast, the single-crystalline material shows a resilience toward particle cracking—not only to cracking upon mechanical compression as discussed above, but additionally to cracking both upon repeated volume change during (de)lithiation as well as upon oxygen release at high SOCs. Here it should be noted, however, that the cracking of the primary crystallites of single-crystalline CAMs has been observed under more harsh conditions, namely over the course of long-term cycling at higher rates and elevated temperatures. 46–48
Structural stability and gas evolution at high state of charge
To illuminate the effect of particle morphology on the gassing behavior, the three NCM materials are cycled consecutively to two different upper cutoff potentials, one below the onset of the release of lattice oxygen and one above, while the amounts of evolved oxygen (O2, determined at the mass-over-charge ratio of m/z = 32) and carbon dioxide (CO2, m/z = 44) were tracked, as depicted in Fig. 4. To avoid any effect on the integrity of the NCM particles upon mechanical compression, uncompressed PC and SC electrodes were investigated, while the PC-bm electrode had to be compressed at 100 MPa (this should not alter the PC-bm specific surface area, as already discussed above).
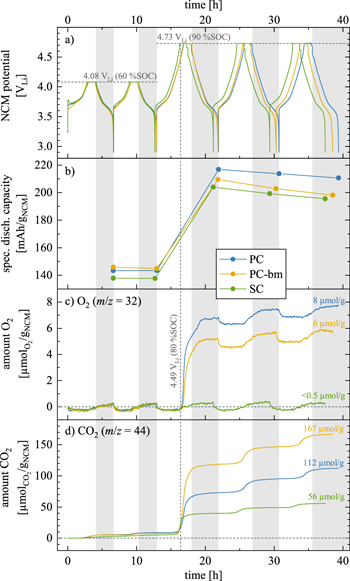
Figure 4. Cycling and gas evolution data as a function of time for OEMS cells assembled with PC (blue), PC-bm (yellow), and SC (green) as working electrodes (uncompressed for PC and SC; compressed at 100 MPa for PC-bm), using delithiated, capacitively oversized LFP as counter electrode, two Celgard H2013 separators, and 100 μl LP57 electrolyte. The cells were cycled at 25 °C at C/5 (corresponding to 55.3 mA/gNCM when referenced to the theoretical NCM622 capacity of 276.5 mAh/gNCM), with a 1 h CV hold at the upper potential cutoff followed by a 10 min OCV phase, recording the gas evolution by mass spectrometry: (i) two cycles to an NCM potential of 4.08 VLi (corresponding to 0.68 VLFP cell voltage or to a degree of delithiation of 60 %SOC (determined from the potential curve in Fig. A·4)); (ii) three cycles to 4.73 VLi (corresponding to 1.33 VLFP cell voltage or to 90 %SOC). a) NCM cathode potential vs. Li+/Li. b) Specific discharge capacity for each of the five cycles. c) & d) Total amount of evolved oxygen (determined at m/z = 32) and carbon dioxide (at m/z = 44) in the OEMS cell, both normalized to the NCM mass (in units of μmolgas/gNCM). The vertical light gray areas accentuate each NCM discharge/lithiation period (marked for the PC material). The vertical gray dashed line marks the onset of the O2 evolution of PC at a potential of 4.49 VLi, corresponding to a degree of delithiation of ∼80 %SOC. The numbers represent the gas amounts obtained at the end of the experiment.
Download figure:
Standard image High-resolution imageDuring the first two cycles to 4.08 VLi (corresponding to a degree of delithiation of 60 %SOC when converted using the charge curve in Fig. A·4), the potential curves shown in Fig. 4a as a function of time coincide for all three NCMs; only during the first hour of the initial charge (i.e., up to ∼20 %SOC), the overpotential of the PC electrode (blue curve in Fig. 4a) is higher as compared to that of the PC-bm electrode (yellow), while that of the SC electrode (green) is even more pronounced, appearing in the form of an initial potential spike. A similar behavior was also observed in half-cells during the first charge at C/20 (i.e., a quarter of the here used C-rate), where the SC electrode requires the highest overpotential and the PC-bm electrode the lowest, as seen in Fig. A·4, albeit to a smaller extent due to the lower applied specific current. This difference in the initial charge overpotential is believed to originate from the effect of the different particle morphologies of the three CAMs, which will be discussed in detail for the discharge rate test in Fig. 5. In addition, as the charge-transfer resistance of NCMs becomes very large at both ends of the SOC window, 23 the observed morphology-dependent overpotential is particularly pronounced in the pristine and, therefore, fully lithiated state at the beginning of the first charge; it decreases to negligible values at intermediate SOC values, as reflected in the data of Figs. 4a and A·4. In conclusion, the observed initial charge overpotential is more pronounced for smaller specific CAM surface areas, for very low/high SOCs, and for faster C-rates. Additionally, no relaxation of the potential is observed during the 10 min OCV phases (following the 1 h CV hold) at the upper cutoff potential of the first two cycles, which implies a negligible overpotential in the intermediate SOC range for the applied current if cycled below the onset of oxygen release.
For the subsequent three cycles to 4.73 VLi (or 90 %SOC), the potential curves in Fig. 4a start to differ depending on the particle morphology: the required time per cycle is smallest for the SC material, followed by the PC-bm material, and longest for the PC material, which is also reflected in the discharge capacities discussed below in Fig. 4b. Additionally, a significant potential drop appears after the CV hold once the potential was cycled into the oxygen release region: for the fifth and last cycle, the NCM potential drop during the OCV phase of 10 min amounts to 38 and 42 mV for the PC-bm and the PC material, respectively, while the OCV drop amounts to 119 mV for the SC material. This finding coincides with the previous observation of a pronounced capacity loss of single-crystalline materials due to the impedance build-up at high SOCs (see green data points in Fig. 3a for the NCM622 SC material as well as a previous publication for an NCM851005 SC material 14 ) on account of the formation of an oxygen-depleted surface layer, in combination with the relatively low and constant specific surface area of the single-crystalline material (see Figs. 2 and 3b).
When considering the discharge capacities that are depicted in Fig. 4b, a similar picture emerges: during the first two cycles to 4.08 VLi, the PC-bm material delivers with 146 mAh/gNCM the highest capacity, followed by the PC material with 143 mAh/gNCM, while the SC material provides only 138 mAh/gNCM. These values coincide well with the determined discharge capacities at the identical C-rate of C/5, shown in Fig. 5 for the discharge rate test in half-cells to an upper cutoff potential of 4.1 VLi. As the upper cutoff potential is increased to 4.73 VLi, the discharge capacities increase to 217 mAh/gNCM, 210 mAh/gNCM, and 204 mAh/gNCM for the PC, the PC-bm, and the SC material, respectively (see Fig. 4b). During these three cycles to 4.73 VLi, all materials suffer from a fading of the discharge capacity in the range of 6–12 mAh/gNCM. When comparing the first two and the last three cycles in Fig. 4b, an increased difference in the discharge capacity of the PC and the SC material becomes apparent, which we assign to the pronounced impedance build-up of the SC material, supporting the arguments of the above discussion. For the PC-bm material, the lower discharge capacity obtained at high upper cutoff potential as compared to the one of the PC material is believed to result from the relatively high surface area (of 2.25 m2 NCM/gNCM) of the pristine powder in combination with the relatively low conductive carbon content (of 2 wt%) in the electrode: When the electrical conductivity of lithium layered oxides of roughly 10−1−100 S/cm for LiNiO2 (LNO, being a semiconductor) 49–51 is compared to the one of the respective rock-salt structure of NiO with 10−7−10−5 S/cm (being an insulator), 52,53 the latter has an at least four orders of magnitude lower conductivity. If the electrical conductivity of the NCM622 material were to be in the same range as the one of LNO, and if the electrical conductivity of the corresponding oxygen-depleted (rock-salt-type) near-surface layer formed upon lattice oxygen release were also to be lower by several orders of magnitude, the electron transport across the NCM electrode thickness would have to rely on the conductive carbon, which seems, however, not sufficient for the PC-bm particle morphology. This is supported by the fact that rate capability of the PC-bm based electrodes is actually superior to that of the PC and SC electrodes when the amount of conductive carbon in the electrode is increased to 5 wt% (demonstrated below in Figs. 5 and A·6). The lower carbon content of 2 wt% is apparently sufficient for the PC and SC electrodes, explained by the fact that their pristine specific surface areas are ∼8-fold lower compared to the PC-bm material, so that 2 wt% of carbon seem to suffice for good electrical conduction across the electrode thickness.
During the cycling experiment, the specific amounts of evolved oxygen are monitored for each NCM material and depicted in Fig. 4c. Apart from the apparent release of lattice oxygen initially observed for the first cycle to 4.73 VLi (i.e., for the third of the five cycles) for the PC (blue line) and the PC-bm (yellow) material, a periodic increase and decrease of the oxygen signal is observed, which is visible best for the SC (green) material: it decreases to around −0.5  during charge, and then increases to around +0.5
  during discharge (corresponding to a fluctuation of the apparent O2 concentration of ±20 ppm), which is not only visible for all of the five cycles, but also similar in its extent, independent of the upper cutoff potential. At first sight, one explanation could be the potential-dependent consumption and production of oxygen by the reversible reaction of lithium oxide to/from lithium peroxide, as it is known from lithium-air battery research,
54–56
e.g., happening for residual lithium oxide on the surface of the NCMs, as previously suggested by Yabuuchi et al.
57
This, however, would result in a release of molecular oxygen at potentials >4.0 VLi (i.e., during charge),
54–56
whereas the opposite is observed in this experiment (i.e., a decrease of the oxygen signal at high potential). Furthermore, NCM622 should not evolve any oxygen when cycled to only 4.08 VLi (i.e., to 60 %SOC), putting in question whether the signals at m/z = 32 really derive from oxygen.
during discharge (corresponding to a fluctuation of the apparent O2 concentration of ±20 ppm), which is not only visible for all of the five cycles, but also similar in its extent, independent of the upper cutoff potential. At first sight, one explanation could be the potential-dependent consumption and production of oxygen by the reversible reaction of lithium oxide to/from lithium peroxide, as it is known from lithium-air battery research,
54–56
e.g., happening for residual lithium oxide on the surface of the NCMs, as previously suggested by Yabuuchi et al.
57
This, however, would result in a release of molecular oxygen at potentials >4.0 VLi (i.e., during charge),
54–56
whereas the opposite is observed in this experiment (i.e., a decrease of the oxygen signal at high potential). Furthermore, NCM622 should not evolve any oxygen when cycled to only 4.08 VLi (i.e., to 60 %SOC), putting in question whether the signals at m/z = 32 really derive from oxygen.
In principle, it could be possible that a fluctuating concentration of the electrolyte solvents in the gas phase (i.e., ethylene carbonate (EC) or ethyl methyl carbonate (EMC)) could affect the signals at m/z = 32. Due to the four orders of magnitude higher vapor pressure of the linear carbonate,
58
this affect would be dominant for EMC, which has its main MS signal at m/z = 77 and, due to the fragmentation pattern in the MS, minor signals at, e.g., m/z = 32 (∼20 % of the one at m/z = 77) and at m/z = 44 (∼20 %), as shown by Strehle et al.
59
Looking at the signal of m/z = 77 multiplied by 20 % (corresponding to the expected signal contribution at m/z = 32) as well as the signal of m/z = 44, both signals show a similarly fluctuating behavior, changing simultaneously as the one at m/z = 32 (note that all ion currents were normalized to the signal at m/z = 36 of the 36Ar isotope, see Fig. A·5). Since EMC is expected to be the only substance which can be detected in this experiment on the signal at m/z = 77, we assign the apparent O2 signal fluctuation of ±0.5  to a fluctuation of the EMC background signal (note that the fluctuation of the m/z = 44 signal cannot be observed in the representation of Fig. 4d due to the relatively high CO2 evolution during this experiment, which is at least two orders of magnitude higher than the fluctuation of the signal).
The possible origin of a fluctuating EMC signal can be found by a closer examination of the time dependence of the fluctuation of the apparent oxygen signal for all three NCM materials: the increase of the apparent oxygen signal subsequent to the charge phase does not initiate at lower potentials but initiates with the beginning of the CV hold at high potential. During this potential hold of 1 h, the charge current drops quickly to below 10 mA/gNCM (corresponding to ∼C/20; data not shown). From this observation one can conclude that the repeated change of the apparent oxygen signal at m/z = 32 at least correlates with the extent and the direction of the applied current, even in the low potential region where no evolution of oxygen should yet have occurred. One possible explanation might be a small fluctuation of the local salt concentration in the NCM working electrode that faces the OEMS inlet (note that the cathode current collector is a porous stainless steel mesh to allow for fast access of the evolved gases to the mass spectrometer inlet), due to the salt concentration gradient generated in electrochemical cells when a current is drawn.
60,61
This effect predicts an increase of the lithium salt concentration in the NCM working electrode during charge, due to the delithiation of the NCM active material, particularly at the interface between electrolyte and the gas phase of the OEMS cell (i.e., furthest away from the cathode/separator interface); during discharge (or NCM lithiation), however, the lithium salt concentration is predicted to be decreased at that interface. As a higher (or lower) salt concentration should result in a decreased (or increased) vapor pressure of the EMC solvent, the OEMS mass signals at m/z = 77 and m/z = 32 should also fluctuate, decreasing during charge and increasing during discharge, exactly as observed for the m/z = 32 signal in Fig. 4c. From this, we conclude that the apparent fluctuation of the OEMS signal at m/z = 32, with an amplitude corresponding to approximately ±0.5  is due to an alternating partial pressure of the EMC solvent in the OEMS cell. Nevertheless, the proper quantification and interpretation of the evolved oxygen is not affected, as the change of the background with ±0.5
  is periodic and at least an order of magnitude lower than the oxygen evolved at ∼80 %SOC from the PC and PC-bm materials.
Considering that the fluctuations of the signal at m/z = 32 of roughly ±0.5  are not related to changes in the oxygen concentration, the data in Fig. 4c would suggest that no oxygen is evolved for the SC material even at >80 %SOC. For the PC and PC-bm materials, however, a significant amount of oxygen (i.e., far above the background fluctuation) is evolved in the first cycle to 4.73 VLi, initiating as the potential increases above ∼4.5 VLi (corresponding to a degree of delithiation of ∼80 %SOC); in subsequent cycles, smaller but still visible amounts of oxygen are evolved whenever the potential increases above ∼4.5 VLi. This is attributed to the release of lattice oxygen from the layered oxide due to the reported structural instabilities of NCMs at high degrees of delithation.
15
At the end of the fifth and final charge/discharge cycle, ∼8 and ∼6
are not related to changes in the oxygen concentration, the data in Fig. 4c would suggest that no oxygen is evolved for the SC material even at >80 %SOC. For the PC and PC-bm materials, however, a significant amount of oxygen (i.e., far above the background fluctuation) is evolved in the first cycle to 4.73 VLi, initiating as the potential increases above ∼4.5 VLi (corresponding to a degree of delithiation of ∼80 %SOC); in subsequent cycles, smaller but still visible amounts of oxygen are evolved whenever the potential increases above ∼4.5 VLi. This is attributed to the release of lattice oxygen from the layered oxide due to the reported structural instabilities of NCMs at high degrees of delithation.
15
At the end of the fifth and final charge/discharge cycle, ∼8 and ∼6  of oxygen are detected for the PC and PC-bm material, respectively, while none (<0.5
  ) is observed for the SC material.
However, as the major fraction of the released (singlet) oxygen reacts with the solvents in the electrolyte and is mainly detected as carbon dioxide,
11,12,15
the absence of oxygen evolution in case of the SC material does not at all imply that there is no lattice oxygen release. Further insights into the lattice oxygen release can therefore be gained by examining the CO2 signal. During the first two cycles to 4.08 VLi, carbon dioxide is detected at potentials greater than ∼3.8 VLi, as shown in Fig. 4d, and at the end of the first two cycles amounts to ∼9  for the PC material, ∼8
  for the PC-bm material, and ∼5
  for the SC material. As we do not expect any lattice oxygen release from the NCM at this potential or SOC, these relatively low amounts of CO2 must mainly stem from the electrochemical oxidation of trace impurities in the carbonate-based electrolyte (e.g., alcohols such as ethanol or ethylene glycol)
13,62
as well as from the subsequent chemical decomposition of residual lithium salts (e.g., Li2CO3), which remain on the NCM particles due to the slight lithium excess that is typically used in the synthesis of (nickel-rich) active materials
7
and that are decomposed by the protic species originating from the oxidation of the electrolyte.
38
for the SC material. As we do not expect any lattice oxygen release from the NCM at this potential or SOC, these relatively low amounts of CO2 must mainly stem from the electrochemical oxidation of trace impurities in the carbonate-based electrolyte (e.g., alcohols such as ethanol or ethylene glycol)
13,62
as well as from the subsequent chemical decomposition of residual lithium salts (e.g., Li2CO3), which remain on the NCM particles due to the slight lithium excess that is typically used in the synthesis of (nickel-rich) active materials
7
and that are decomposed by the protic species originating from the oxidation of the electrolyte.
38
Simultaneously with the release of oxygen from the PC and PC-bm materials, a significant rise of the carbon dioxide amount is observed for all three materials during the first cycle to 4.73 VLi (or 90 %SOC, respectively), as shown in Fig. 4d. The onset of the strong CO2 evolution at high potentials, however, appears to occur slightly before the onset of the oxygen evolution, which in part can be explained by a rapid reaction of released lattice oxygen with the electrolyte to yield CO2, so that at low oxygen evolution rates no molecular oxygen (or only in the form of CO2) escapes from the electrolyte into the gas phase (a more detailed analysis will be subject to future studies). For the subsequent two cycles to 4.73 VLi, the carbon dioxide amount rises stepwise for all three materials when the NCM is charged above ∼80 %SOC. At the end of the fifth and final cycle, 112  of carbon dioxide are detected for the PC material, 167
  for the PC-bm material, and 56
  for the SC material. Even though the identical CO2 evolution profiles for all three materials suggest that the CO2 evolution of the SC material at high potentials originates from the release of lattice oxygen it is, at first sight, surprising that no molecular oxygen is detected for this material (see green curve in Fig. 4c). This could be rationalized by considering that the SC material shows only a minor increase in specific surface area upon cycling (see green data points in Fig. 3b) and thus insignificant cracking, so that its entire surface area from which the lattice oxygen is released is in contact with the electrolyte, which might facilitate a rapid reaction of released oxygen (e.g., in form of singlet oxygen) with the electrolyte so that no oxygen can escape into the gas phase where it would be detected by OEMS. In case of the PC material, however, lattice oxygen can also be released into tiny pores or cracks in the secondary agglomerates that are not filled with electrolyte, where then the unreactive triplet oxygen can be formed and escape into the gas phase. This is further supported by the lower overall amount of evolved oxygen for the PC-bm material (for which most of its surface area is already exposed) as compared to the PC material, even though it yields the highest total amount of evolved gas, consistent with the expectation that higher specific surface areas lead to more electrolyte decomposition.
14
for the SC material. Even though the identical CO2 evolution profiles for all three materials suggest that the CO2 evolution of the SC material at high potentials originates from the release of lattice oxygen it is, at first sight, surprising that no molecular oxygen is detected for this material (see green curve in Fig. 4c). This could be rationalized by considering that the SC material shows only a minor increase in specific surface area upon cycling (see green data points in Fig. 3b) and thus insignificant cracking, so that its entire surface area from which the lattice oxygen is released is in contact with the electrolyte, which might facilitate a rapid reaction of released oxygen (e.g., in form of singlet oxygen) with the electrolyte so that no oxygen can escape into the gas phase where it would be detected by OEMS. In case of the PC material, however, lattice oxygen can also be released into tiny pores or cracks in the secondary agglomerates that are not filled with electrolyte, where then the unreactive triplet oxygen can be formed and escape into the gas phase. This is further supported by the lower overall amount of evolved oxygen for the PC-bm material (for which most of its surface area is already exposed) as compared to the PC material, even though it yields the highest total amount of evolved gas, consistent with the expectation that higher specific surface areas lead to more electrolyte decomposition.
14
At the end of the five cycles of the OEMS experiment, a total gas amount (i.e., the sum of oxygen and carbon dioxide) of 120  is observed for the PC material, 173
  for the PC-bm material, and 56
  for the SC material, resulting in a ratio of the total gas amounts of 1:1.44:0.47 for PC:PC-bm:SC. This proportion is also reasonably closely reflected in the ratio of the NCM surface areas of 1:1.75:0.31 for PC:PC-bm:SC, which is deduced from the capacitance measurements at 4.7 VLi (see Fig. 3b). The minor differences in these ratios could stem from the fact that the capacitance measurements are performed in the discharged state, while the gas release occurs at high SOC, where additional surface area is exposed (see Fig. 2). Furthermore, the capacitance measurements were performed for compressed PC and SC electrodes, while uncompressed electrodes were used for the OEMS experiments to exclude mechanically induced cracking, as the resulting surface area increase of the NCMs would lead to additional gassing. Despite these minor differences, the here made observation clearly suggest that - apart from the oxidation of electrolyte impurities and the chemical decomposition of residual lithium salts
38
- the gas evolution from the NCMs is not governed by the surface area of the pristine NCM powders but mainly by the surface area of the primary crystallites and, therefore, by their particle size. The here observed reduced gassing of single-crystalline CAMs would be advantageous for the use in commercial cells, as indeed reported previously by Li et al. for single-crystalline NCM523.
63
for the SC material, resulting in a ratio of the total gas amounts of 1:1.44:0.47 for PC:PC-bm:SC. This proportion is also reasonably closely reflected in the ratio of the NCM surface areas of 1:1.75:0.31 for PC:PC-bm:SC, which is deduced from the capacitance measurements at 4.7 VLi (see Fig. 3b). The minor differences in these ratios could stem from the fact that the capacitance measurements are performed in the discharged state, while the gas release occurs at high SOC, where additional surface area is exposed (see Fig. 2). Furthermore, the capacitance measurements were performed for compressed PC and SC electrodes, while uncompressed electrodes were used for the OEMS experiments to exclude mechanically induced cracking, as the resulting surface area increase of the NCMs would lead to additional gassing. Despite these minor differences, the here made observation clearly suggest that - apart from the oxidation of electrolyte impurities and the chemical decomposition of residual lithium salts
38
- the gas evolution from the NCMs is not governed by the surface area of the pristine NCM powders but mainly by the surface area of the primary crystallites and, therefore, by their particle size. The here observed reduced gassing of single-crystalline CAMs would be advantageous for the use in commercial cells, as indeed reported previously by Li et al. for single-crystalline NCM523.
63
Rate capability
The performance of the three NCM materials is investigated regarding their discharge rate capability. To exclude the effect of electrical resistances through the electrode and/or from the electrode to the current collector, the conductive carbon content was increased to 5 wt% for this rate test (as compared to typical values of ∼2 wt%); for the same purpose, the electrodes were additionally compressed at 200 MPa. By this, we expect to better elucidate the morphology-specific performance of the NCMs only.
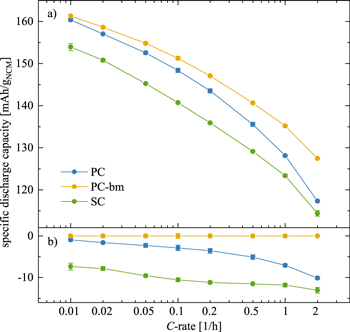
Figure 5. Discharge rate capability of PC (blue), PC-bm (yellow), and SC (green) materials. Cells were assembled with PC, PC-bm, or SC working electrodes in T-cells with 90 μl LP57 electrolyte, a lithium metal reference electrode, and a lithium metal counter electrode (with three glass fiber separators, two placed between working and counter electrode as well as one towards the reference electrode). Controlled by the reference electrode potential, the NCM electrodes were cycled between 3.0 VLi and 4.1 VLi at 25 °C, applying discharge rates of C/100, C/50, C/20, C/10, ..., 2C (all referenced to the theoretical capacity of 276.5 mAh/gNCM). The C-rate applied during the respective charge (in CCCV mode, with a CV step at the upper cutoff potential for 1 h, or until the current dropped below C/20) was either identical to the discharge rate (for C/2 or slower) or set to C/2 (for C/2 or faster). a) Specific discharge capacity as a function C-rate, while latter is plotted on a logarithmic scale. The data are extracted from the cycling data shown in Fig. A·6, depicting the third data point of each set of three cycles at the respective C-rate. b) Deviation of the discharge capacity of the respective NCM material to the one of the PC-bm material. The error bars correspond to the minimum/maximum value of two measurements.
Download figure:
Standard image High-resolution imageThe specific discharge capacity as a function of cycle number is depicted in Fig. A·6: during the first 33 cycles of the procedure, a discharge rate test is performed, cycling the NCM cathode potential between 3.0 and 4.1 VLi and increasing the discharge rate every third cycle from C/100 to 20C. Up to 2C, the PC-bm (yellow) material shows the best performance, followed by the PC (blue) material, and then by the SC (green) material. The fact that the discharge capacity of the three NCMs becomes quasi-identical for C-rates of 5C and higher suggests that at such high rates cell-related resistances become dominant (e.g., the ohmic resistance of the separator and concentration overpotentials), so that we limit our analysis of the rate capability in Fig. 5 to rates up to only 2C. During each set of three cycles, the discharge capacity remains constant (see Fig. A·6), indicating stable cycling of the three materials. This is further supported by the subsequent 14 cycles at 1C, during which the discharge capacity does not decrease (see Fig. A·6), which is expected since the upper cutoff potential of 4.1 VLi (or 61 %SOC) is still below the onset potential for the release of lattice oxygen.
To better compare the rate capabilities of the different NCM materials, the specific discharge capacities (taken from the third cycle of each set of three cycles with the same discharge rate) are evaluated in Fig. 5a as a function of the applied C-rate, which is plotted on a logarithmic scale. At C/100, the PC-bm and PC material deliver a similar capacity of 161 mAh/gNCM and 160 mAh/gNCM, respectively, while the SC material provides only 154 mAh/gNCM, even at this very low rate (note that the error values of the specific capacities correspond to the minimum/maximum values determined from the measurement of two cells and are always below ±2.3 mAh/gNCM, and even below ±0.9 mAh/gNCM when excluding the cycles at C-rates of 5C or higher. If an error value is below ±0.5 mAh/gNCM, it is omitted). At C/10, the discharge capacity provided by the PC-bm material is diminished to 151 mAh/gNCM, while that of the PC material amounts to 148 ± 1 mAh/gNCM, followed by that of the SC material with 141 mAh/gNCM. When the applied rate is increased to 1C, the PC-bm delivers 135 mAh/gNCM, the PC material delivers 128 mAh/gNCM, and the SC material delivers 123 mAh/gNCM. The data in Fig. 5b thus show that the difference of the discharge capacity of the PC and the PC-bm materials grows with increasing C-rate, while the discharge capacity between the PC and SC materials shrinks continuously, until a difference of only 3 mAh/gNCM remains at 2C. The here observed dependence of the rate capability on the particle morphology can be explained as follows:
- Small and deagglomerated primary crystallites: The highest rate performance is determined for PC-bm, which consists of small and separated primary crystallites, having a high specific surface area (at any SOC) already in its pristine state (see Fig. 2). As each primary crystallite is in contact with electrolyte as well as with the conductive carbon (assured by the higher carbon content of 5 wt%), the particle and electrode morphology ensure optimal ionic and electrical connectivity, so that the area specific current density (referenced to the total NCM surface area) is lowest at any given C-rate for the PC-bm material, leading to the lowest charge-transfer overpotential. Furthermore, due to the relatively small NCM particle size, overpotentials due to solid-state diffusion of lithium through the NCM must also be the lowest of the three materials.
- Polycrystalline secondary agglomerates: In contrast, the smaller specific surface area of the secondary agglomerates of PC material (in its pristine state) should give rise to significant kinetic limitations. However, due to the volume change upon (de)lithiation 17 and the resulting crack formation between the primary crystallites during the first charge (see Fig. 2), 19 the fast lithium-ion diffusion through the liquid electrolyte penetrating the formed cracks allows for discharge capacities similar to the ones of the PC-bm material, analogous to the effect previously reported by Trevisanello et al. on the basis of galvanostatic polarization and relaxation experiments. 20 Note that this effect is only advantageous with liquid electrolytes, as solid electrolytes do not penetrate into the formed cracks and as the cracks additionally hinder the solid-state diffusion of lithium through the NCM particle. 64 In contrast, as the conductive carbon is only located on the exterior surface of the secondary agglomerates and not in its interior, as all the pores are still closed during ink preparation, the PC material suffers at high C-rates from a reduced electrical connection of the primary crystallites in the center of the secondary agglomerates - in particular in the charged state, where some primary particles are expected to be (partially) electrically isolated. This is expected to result in an heterogeneity of SOC over the radius of the secondary particles, as previously observed by Kim et al. by atomic force microscopy, 22 leading to a loss in rate capability, as suggested by Friedrich et al. 23 As the formation of cracks grows continuously during extended cycling, 19 these opposing effects with regards to rate capability are expected to become more pronounced after long-term charge/discharge cycling: (i) the favorable increase of the interfacial area between electrolyte and CAM (lowering the area specific current density and thus the charge-transfer resistance) and of the faster lithium ion diffusion through the electrolyte phase within the secondary particle agglomerate (effectively lowering the solid-state lithium diffusion overpotential); (ii) the unfavorable increase of the electrical connectivity across the secondary particle agglomerate, leading to an apparent decrease in rate capability.
- Single-crystals with μm-scale dimensions: In case of the SC material, the individual SC particles are expected to be well connected both ionically and electrically, similar to the PC-bm material. As the SC particles do not form cracks (see Fig. 2) into which electrolyte can penetrate and thereby increase the apparent lithium diffusion coefficient, 20 the kinetics of (de)lithiation rely on the solid-state diffusion of the lithium through the NCM. Since the lithium has to diffuse over comparatively long distances for the larger primary crystallites of the SC material, the (de)lithiation rates are diminished. 65 Additionally, the ∼4.5-fold lower specific surface area of the SC compared to the PC-bm materials (see right y-axis in Fig. 2a) increases the area specific current density and, consequently, the charge-transport overpotentials by the same factor. This is in reasonably good agreement with the difference in rate capability at low C-rates: the discharge capacity of the SC material at C/100 (154 mAh/gNCM; see Fig. 5a) is already reached by the PC-bm material at a ∼6-fold higher C-rate (i.e., at ∼0.06C). Furthermore, the kinetic limitation is also reflected in the higher first-cycle irreversible capacity of the SC compared to the PC-bm material, i.e., for the material with the larger primary crystallites (see Fig. A·6), as it was observed similarly by Riewald et al. for LNO. 66 Therefore, the discharge capacity of the SC material is diminished as compared to the one of the PC-bm material at all C-rates.
Thermal stability in the charged state
In a final experiment, the thermal stability of the NCM materials in the charged state is evaluated by thermogravimetric analysis (TGA), which is often used as an indicator for the safety of electrode active materials in large cells. Delithiated NCMs are prone to the thermally induced decomposition of the layered transition metal oxide to a spinel- or rock-salt-type structure 67 at much lower temperatures (around 200–350 °C, depending on transition metal ratio and degree of delithiation) 7,67,68 as compared to the fully lithiated materials (with decomposition temperatures ≫500 °C), which is accompanied by heat evolution and the release of lattice oxygen, 7,67–69 initiating the combustion of the organic electrolyte and eventually a thermal runaway in larger battery packs. 70
In the following, the onset and the extent of the thermal decomposition of delithiated NCM electrodes were evaluated by their relative mass loss upon heating under argon flow, as depicted in Fig. 6. For this, the electrodes were charged once to 4.1 VLi, what resulted in a degree of delithiation of ∼62 %SOC for the three NCM622 materials. To exclude any influence of the decomposition of the conductive carbon and/or the binder in the electrode, an electrode solely consisting of C65 and PVDF (see black curve in Fig. 6) was investigated using the same procedure: up to 325 °C, however, the C65/PVDF electrode exhibits a mass loss of only ∼0.70 wt%, what would correspond to a negligible mass loss of not more than ∼0.03 wt% in the NCM electrodes, when taking into account the relative contribution of C65 and PVDF of 4 wt%. The observed thermal stability of the C65/PVDF electrode is consistent with the previously observed onset temperatures of the thermal oxidation reaction of C65 38 as well as of PVDF 71 since neither of the two decomposes at temperatures below 350 °C (even in oxygen-containing atmosphere).

Figure 6. Relative electrode mass change during thermogravimetric analysis of a C65/PVDF electrode (1:1 w/w, black line) as well as of charged PC (blue), PC-bm (yellow), and SC (green) electrodes (96:2:2 w/w) as a function of experiment time (lower x-axis) and temperature (upper x-axis), performed under argon flow of 60 ml/min while ramping the temperature at 5 K/min from 25 °C to 325 °C. Beforehand, the electrodes were charged in coin half-cells at 25 °C to 4.1 VLi (corresponding to ∼62 %SOC, as determined from Fig. A·4) in CCCV mode (see Fig. A·2), then harvested from the cells, washed in three steps using carbonate-based solvents, and finally dried at 120 °C under dynamic vacuum. The signal of the C65/PVDF electrode is scaled according to the mass contribution (of 4 wt%) in the charged and heated NCM electrodes.
Download figure:
Standard image High-resolution imageUp to 140 °C, the mass changes observed for the three NCM electrodes are within ±0.07 wt%, corresponding to ±15 μg for the used electrodes with a mass of ∼20 mg; therefore, we assign the observed variations of the sample mass (under argon flow) to the fluctuation of the background signal between the different measurements. Starting at temperatures of 140–160 °C, however, a significant mass loss of all three NCM electrodes initiates, with the rate of the mass loss increasing with increasing temperatures. This temperature range for the onset of a significant mass loss from the NCM electrodes coincides well with the reported onset temperatures of the thermal runaway in heating experiments for commercial graphite/NCM full-cells. 70,72 At the final temperature of 325 °C, the total mass loss of the PC-bm and the PC electrodes amounts to 2.38 wt% and 1.59 wt%, respectively, while the total mass loss of the SC electrode is only 1.11 wt%.
Based on the results of previous studies, 7,67 we assume that the mass loss of the delithiated NCM electrodes is mainly driven by its thermal decomposition which is accompanied by the release of lattice oxygen. For the full transformation from the layered and partially delithiated MO2 to the rock-salt-type MO phase which is expected to occur for the complete decomposition of NCM622 at temperatures of ∼550 °C (measured for 75 %SOC), 67 a mass loss of the NCM material of 17.8 wt% would be expected; this value corresponds to a maximum mass loss of the electrode of 17.1 wt% when considering the NCM content of 96 wt% in the electrode. The measured mass loss of 2.38 wt% for the PC-bm electrode thus suggests that only ∼14 wt% of the layered phase of the PC-bm material are decomposed up to 325 °C in the performed TGA experiment (and even less for PC and SC). Due to this minor part, we suggest that, from the onset temperature of the transformation of the layered oxide structure up to 325 °C, mainly oxygen from the surface region of the primary crystallites is evolved, while the bulk of the delithiated NCM requires higher temperatures to decompose, possibly due to the limited solid-state diffusion of oxygen through the NCM lattice. This is further expressed in the ratio of the respective mass loss of 1:1.5:0.7 up to 325 °C for the PC:PC-bm:SC electrodes, which shows a similar trend as the ratio of the surface areas of 1:1.94:0.39 for the electrodes charged to 3.9 VLi (see Fig. 2). The investigation of the proposed mechanism, however, needs to be subject of future studies using temperature-resolved diffraction and/or spectroscopic techniques. In summary, larger NCM primary crystallites (with a smaller specific surface area) exhibit a diminished mass loss upon heating and, therefore, are expected to release less oxygen improving their thermal stability as well as the safety of large-format battery cells and packs.
Conclusions
We investigated the effect of three different NCM622 particle morphologies on the electrochemically active surface area, the discharge capacity as a function of the upper cutoff potential, the gassing during the initial cycles, the rate capability, and the thermal stability. These properties were evaluated for: (i) a polycrystalline NCM622 composed of secondary agglomerates with a size of ∼5–10 μm ("PC"), (ii) the same material almost completely separated by ball milling into its primary crystallites with a final particle size of ∼0.2–1.0 μm ("PC-bm"), and (iii) a single-crystalline NCM622 material composed of monolithic particles with a size of ∼2–8 μm. For the pristine powders, the specific surface area determined by krypton physisorption (Kr-BET) was ∼0.3 m2 NCM/gNCM for the PC and SC materials, while it was ∼8-fold larger for the PC-bm material. This allowed to independently examine the effect of specific surface area for the same morphology (SC vs. PC-bm materials) and the effect of poly- vs. single-crystalline morphologies for a similar specific surface area (PC vs. SC materials).
Even though the specific surface area of the PC and SC materials was similar for the pristine CAM powders, Kr-BET measurements revealed a ∼3-fold higher specific surface area of the PC material in the charged state of the first cycle, while that of the SC material remained essentially unaffected. Similar observations were made by in situ monitoring the NCM electrode capacitance via impedance spectroscopy, showing that the capacitance of SC electrodes remained essentially constant, both upon compression and even after full delithiation, highlighting the (chemo)mechanical stability of single-crystalline CAMs, while the capacitance of the PC electrodes changed by 240 % upon mechanical compression and by 650 % when cycled to 5.0 VLi. Here, the specific surface area and the capacitance of the PC material reached ∼70 % of the values obtained for the PC-bm material (for which most primary crystallites of the PC material had been separated into individual particles). This finding demonstrates that most of the surface area of the primary crystallites which compose the secondary agglomerates of the polycrystalline NCM is accessible to the electrolyte after the material has been delithiated to a high state of charge (SOC), elucidating the fragile integrity for the polycrystalline morphology. This observation also explains the more than 2-fold higher gassing of the PC material when charged to 4.7 VLi (∼90 %SOC) as compared to the SC material; as the gassing is found to be roughly proportional to the electrochemically active surface area, the highest amount of gas was evolved by the PC-bm material.
Discharge rate tests in half-cells revealed the impact of the NCM particle morphology and the electrochemically active surface area on the rate capability: (i) the highest rate capability was found for the PC-bm material, owing both to its very high specific surface area that lowers the charge-transfer overpotentials and to its small particle size that allows for efficient solid-state lithium diffusion; (ii) the SC material showed the lowest rate capability, as it maintained a low specific surface area, leading to large charge-transport resistances; (iii) the rate capability of the PC material was inferior to that of the PC-bm material, presumably due to the poor electrical connection of primary crystallites within the secondary agglomerates upon particle cracking. This illustrates the dependence of the delivered capacity on the lithium diffusion in the solid and the liquid phase (poor for the large SC primary crystallites) as well as on electrical resistances inside the NCM particles (affecting the PC particles negatively).
Additionally, it was found that the morphology does not affect the decomposition temperature of the NCM materials for the same degree of delithiation, investigated up to 325 °C by TGA; however, the relative mass loss (expected to be induced by the decomposition of the delithiated layered structure and the release of surface-near lattice oxygen) as a function of temperature is more pronounced for an NCM with a higher surface area.
In addition to this safety aspect, the observed stable surface area of single-crystalline CAMs is expected to have a positive impact on the gas evolution and on surface-area-dependent side reactions with the electrolyte, on the cathode impedance, and, therefore, on the capacity retention in full-cells. However, as a larger particle size is also accompanied by disadvantages such as a decreased rate capability as well as an increased sensitivity to the formation of a resistive rock-salt-type surface layer, the optimal particle size of single-crystalline NCMs needs to be determined in future studies.
CRediT Authorship Contribution Statement
Stefan Oswald: Methodology, Supervision, Investigation, Writing—Original Draft. Moritz Bock: Investigation, Writing—Review & Editing. Hubert A. Gasteiger: Conceptualization, Writing—Review & Editing.
Acknowledgments
Financial support by the BASF SE through its Research Network on Electrochemistry and Batteries is gratefully acknowledged. BASF SE (Germany) and Xiaohang Liu (BASF SE, Shanghai, China) are kindly acknowledged for providing the active materials. The authors also kindly thank Felix Riewald (TUM/BASF SE) for fruitful discussions.
Appendix
Appendix. Magnified SEM image of PC-bm
For a better visual investigation, the magnified SEM image of the pristine PC-bm (obtained by ball milling of the polycrystalline NCM622) is shown in Fig. A·1. It is observed that most of the secondary agglomerates of the polycrystalline NCM622 have been completely separated into their primary particles, showing individual crystallites with a size of 0.2–1.0 μm, while only a few agglomerates with a size of ∼2 μm remain.
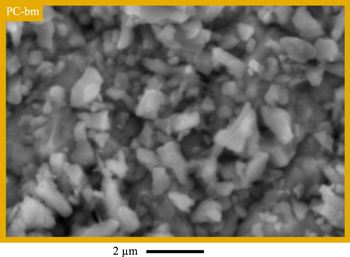
Figure A·1. Magnified representation of the SEM image shown in Fig. 1b illuminating the particle morphology of the pristine PC-bm powder by top-view SEM in secondary electron mode at 15 kV.
Download figure:
Standard image High-resolution imageAppendix. Cycling procedures for Kr-BET and TGA measurements
Prior to the SOC-dependent surface area determination via Kr-BΕT and the evaluation of the thermal stability in TGA experiments, the NCM electrodes were either stored for 24 h or cycled galvanostatically to the respective potentials of 3.9, 4.1, or 4.4 VLi, or to fully discharged state at 2.55 VLi after one charge/discharge cycle to an upper cutoff potential of 4.4 VLi. The potential profiles of the respective cycling procedures are depicted in Fig. A·2.
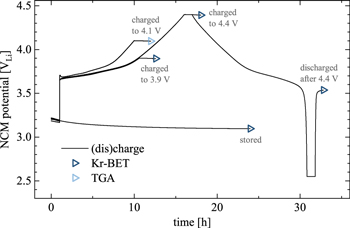
Figure A·2. Potential curves (black lines) of the PC electrodes stored or (dis)charged for Kr-BET (dark blue triangles) and TGA measurements (light blue triangles). Coin-half cells were assembled using uncompressed PC electrodes, lithium metal as counter electrode, 100 μl LP57 electrolyte, and two glass fiber separators as well as one Celgard separator facing the NCM electrode. At 25 °C, they were either stored for 24 h or cycled galvanostatically at a C-rate of C/20 for the Kr-BET measurements and C/15 for the TGA experiments (when referenced to the theoretical capacity of 276.5 mAh/gNCM of NCM622), all including a CV step of 1 h at the respective approached potential (CCCV mode) and an OCV period of 1 h, prior to being harvested.
Download figure:
Standard image High-resolution imageAppendix. Capacitance measurements as a function of cycle number
The data of specific discharge capacity and specific capacitance obtained in the electrochemical cycling experiments in pseudo-full cells are depicted here as a function of cycle number, for which the upper cutoff potential is increased every three cycles by 0.1 V. Here, the discharge capacity (in Fig. A·3a) increases with increasing upper cutoff potential but stays constant within each set of three cycles up to an upper cutoff potential of 4.3 VLi. Up to cycle #16 (or 4.3 VLi), the specific discharge capacity of SC is lower by ∼10 mAh/gNCM as compared to PC, what is in accordance with the observed discharge capacities in the rate capability test C/10, as depicted in Figs. 5 and A·6. Starting at cycle #17 (or 4.4 VLi), the discharge capacities stagnate even though the upper cutoff potential is increased, what is more pronounced for SC than for PC. The specific electrode capacitance (in Fig. A·3b) increases for the compressed PC electrodes as compared to the uncompressed ones, while the one of SC remains unchanged upon compression. The capacitance upon cycling remains almost constant for SC, however, increases significantly for PC, especially above 4.3 VLi. This data is discussed in detail as a function of SOC in Fig. 3.
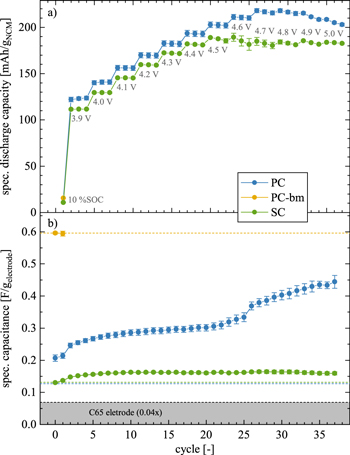
Figure A·3. Electrochemical cycling data as a function of cycle number for PC (blue), PC-bm (yellow), and SC (green) electrodes, as described in detail in Fig. 3. a) Specific discharge capacity. The gray labels indicate the applied upper cutoff potential vs. Li+/Li. b) Specific electrode capacitance. The gray area marks the specific capacitance of the C65 electrode multiplied by its relative mass contribution (of 4 wt%, or 0.04x) in the NCM electrodes. The horizontal dashed lines correspond to the respective specific electrode capacitance in pristine state (uncompressed for PC and SC, compressed at 100 MPa for PC-bm). The error bars correspond to the minimum/maximum value of two measurements.
Download figure:
Standard image High-resolution imageAppendix. Potential curves of the first charge
To allow for a better interpretation of the cycling data in Fig. A·3, showing the specific discharge capacity and the specific capacitance as a function of cycle number with increasing upper cutoff potentials of the NCM electrode, the latter were converted into the respective degree of delithiation (x in Li1-x MO2, with M = Ni, Co, and Mn) or SOC, with the resulting plot being depicted in Fig. 3. For this conversion, the required relation between upper cutoff potential (i.e., 3.9, 4.0, ..., 5.0 VLi) and the SOC was extracted from the potential curves of the first charge for each of the three NCMs under the essentially identical charging current, which are shown in Fig. A·4. The morphology-dependent overpotentials observed <20 %SOC and >80 %SOC are particularly pronounced in these SOC regions due to the well-known increase in charge-transfer resistance at low/high degree of delithiation 23 as well as due to the formation of a resistive oxygen-depleted surface layer caused by the oxygen release at >80 %SOC. 15
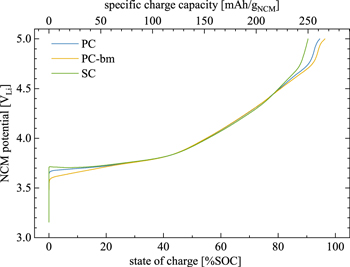
Figure A·4. Potential curves of the first charge of the three NCMs as a function of the specific capacity (top x-axis, in units of mAh/gNCM) or SOC (bottom x-axis, in %SOC), respectively. PC (blue), PC-bm (yellow), or SC (green) as working electrodes in T-cells with 90 μl of LP57 electrolyte and lithium metal as counter electrode and reference electrode (with three glass fiber separators, two placed between working and counter electrode as well as one facing the reference electrode). Controlled by the reference electrode potential, the NCM electrodes were charged at 25 °C to 5.0 VLi at C/20 (corresponding to a current of 13.8 mA/gNCM when referenced to the theoretical capacity of 276.5 mAh/gNCM).
Download figure:
Standard image High-resolution imageAppendix. Effect of EMC fragmentation on MS signals
In the OEMS experiment depicted in Fig. 4, an apparent fluctuation of the oxygen signal at m/z = 32 is observed, changing repeatedly with the direction and the extent of the applied electrical current. To prove that this fluctuation originates from the contribution of EMC on the mass trace of oxygen due to its fragmentation, the signals of m/z = 32, 44, and 77 are depicted in Fig. A·5. Here, the signal at m/z = 77 is multiplied by 0.2 since the contribution of EMC to the other two signals is only ∼20 % (see main text). From the data, it can be observed that all three signals repeatedly show a small, but visible decrease and increase (see Fig. A·5a). In particular, the drop of the ion current appearing after the switch from discharge to charge, or from NCM lithiation to delithiation, respectively, occurs simultaneously for all three mass traces in the magnified representation (see Fig. A·5b). Since EMC is expected to be the only contribution from the electrochemical system to the signal at m/z = 77, the apparent fluctuation of the O2 and the CO2 signals is owed to a change in the concentration of EMC vapor in the OEMS cell.
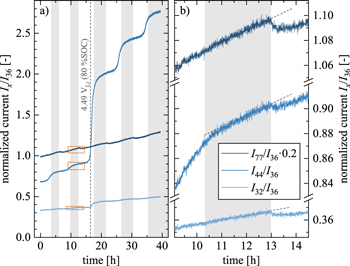
Figure A·5. Gas evolution data as a function of time from the OEMS experiment with the PC material, as presented in Fig. 4. a) Ion currents Ix /I36 of the mass traces at m/z = 32, 44, and 77, all normalized to the signal at m/z = 36 of the 36Ar isotope. The signal at m/z = 77 is multiplied by 0.2 since the contribution of EMC to the other two signals is only ∼20 % (see main text). The vertical light gray areas accentuate each NCM discharge/lithiation period. The vertical gray dashed line marks the onset of the O2 evolution at a potential of 4.49 VLi, corresponding to a degree of delithiation of ∼80 %SOC. b) Magnification of the areas marked by the dotted orange frame in Fig. A·5a. The gray dashed lines are extrapolated from the ion current data of the NCM discharge/lithiation period and serve as a guide to the eye.
Download figure:
Standard image High-resolution image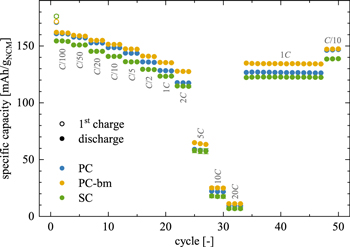
Figure A·6. Specific capacity of the discharge rate test as a function of cycle number for PC (blue), PC-bm (yellow), and SC (green) in half-cells, applying an upper cutoff potential of 4.1 VLi, as described in detail in Fig. 5. The empty circles mark the charge capacity of the first cycle while the filled circles represent the discharge capacity of each cycle. The gray labels indicate the applied discharge C-rate. After the rate test, another 14 cycles with a charge rate of C/2 and a discharge rate of 1C as well as three cycles at C/10 for both charge and discharge were appended. The error bars correspond to the minimum/maximum value of two measurements.
Download figure:
Standard image High-resolution image
Appendix. Discharge capacities from rate test as a function of cycle number
To evaluate the rate capability of the three NCMs, a discharge rate test with C-rates between C/100 and 20C was performed in half-cells to an upper cutoff potential of 4.1 VLi. For all three NCMs, stable cycling is observed within each set of three cycles at the respective C-rate as well as during the 14 cycles at 1C, as depicted in Fig. A·6. This data is discussed in detail as a function of C-rate in Fig. 5.