
Abstract
Open circuit voltage tests were conducted on sixteen 3M Ionomer and eight Nafion™ NR211 membranes. Lifetime distributions were determined, and ion chromatography (IC) techniques were used to measure fluoride, sulfate, trifluoro acetate, and oxalate ions. Combustion Ion Chromatography (CIC) was used to determine the total organic fluoride (TOF) associated with water soluble membrane degradation fragments. The ratio of these products relative to the fluoride release rates were used to infer the likely degradation mechanism for each membrane. Peroxide attack at the sulfonic acid side chain was determined to be the least relevant reaction pathway while the long-proposed polymer chain end unzipping appears to be the dominant mechanism. Abstraction of the tertiary fluorine in the NR211 backbone and side chain is evident by organic fluoride release rates higher than can be explained by unzipping alone.
Export citation and abstract BibTeX RIS
Perfluoroalkylsulfonic acid (PFSA) based proton exchange membrane (PEM) fuel cells are growing in importance for light- and heavy-duty transportation applications. Key to the success of this technology is extended durability up to 30,000 h (∼1 million miles), or nearly three years of continuous operation under normal drive cycle conditions. 1 Due to these long lifetimes, accelerated stress testing is critical for assessing fuel cell membrane durability. One of the more commonly used tests is the open circuit voltage (OCV) hold as defined by the U. S. Department of Energy (DOE). 2 These conditions are regarded as especially harsh, favoring chemical degradation of the fully fluorinated perfluorosulfonic acid (PFSA) ionomer in the membrane. The reactive species most often associated with these conditions are hydrogen peroxide (H2O2) or hydroxyl radicals (HO·) thought to form on the anode due to oxygen crossover. 3,4 Another likely reactive species is a hydrogen atom (H·) which may form on the anode from the platinum-catalyzed dissociation of molecular hydrogen or from the reaction of hydroxyl radicals or radical intermediates with molecular hydrogen. 5,6 Several excellent papers and review articles outline the proposed mechanisms for these reactions as well as a growing body of density functional theory (DFT) calculations probing the reaction energetics. 7–16
One of the most useful measures of membrane degradation is the fluoride release rate (FRR). Fluorine atoms comprise over 65 weight percent of typical PFSA ionomers and the most frequently invoked "unzipping" mechanism proposed by Curtin and others suggests much of the polymer will be degraded to fluoride and carbon dioxide in the presence of hydroxyl radicals. 6,17,18 Analyzing for trace amounts of fluoride in cell product water is relatively easy using techniques such as an ion selective electrode or ion chromatography and can be accurate to the part per billion level or lower. These methods have become invaluable tools for assessing membrane degradation rates and thus the potential for extended durability. For example, strategies to stabilize PFSA membranes through the addition of peroxide-scavenging additives such as cerium or manganese ions often result in orders of magnitude lower fluoride release rates in accelerated testing. 19,20 However, these approaches have drawbacks due to the migration of the additive species. 21–23
If the membrane degradation process was to go to completion, only fluoride (F−), sulfate (SO4 −2) and carbon dioxide (CO2) would be formed. Yet, water soluble fluorinated organic fragments have been reported in cell product water. 24–28 Ion chromatography techniques can detect sulfate ions and, in some cases, small molecule fragments such as trifluoroacetic acid. Liquid chromatography/mass spectrometry (LC/MS) has been very useful in identifying a wide array of membrane degradation products but lacks the ability to quantify concentrations in the absence of known standards. 27,28 One approach that can bridge this gap is to measure all the water-soluble organic fluorine compounds in the effluent water at one time. Bodner described a technique to combust water effluent samples in a crucible at 500 °C, converting the organic fluorine into fluoride ions and carbon dioxide. The redissolved fluoride was measured by an ion selective electrode to give the combination of inorganic and organic fluoride. 29 The same concept can be applied using a combustion ion chromatography method for measuring total organic fluoride (TOF) by splitting the sample into two analysis streams. The first stream detects inorganic fluoride ions by conventional IC methods, and the second stream combusts the sample thereby converting any organic carbon-fluorine bonds to carbon dioxide and fluoride ions. The total fluoride ions, which contains both total organic fluoride (TOF) and inorganic fluoride (IF), are subsequently quantified by another IC measurement. The difference between the total fluoride and the original inorganic fluoride can be attributed to water soluble organic fluorine compounds in the sample. While this technique lacks specific structural information, the amount of organic fluorine from polymer degradation products can be determined. Digging deeper into the available data from effluent water analysis can help advance the understanding of these processes and, hopefully, lead to even more stable ionomers.
This work aims to combine ion chromatography for fluoride, sulfate, trifluoroacetate, and oxalate ions with the total organic fluoride to quantify the degradation products from several fuel cells run at OCV conditions. Multiple samples of both 3M Ionomer membrane and Nafion™ NR211 membrane were run and statistical analyses of lifetimes and FRR were conducted. Furthermore, examination of the ratio of sulfate to fluoride or total organic fluoride to inorganic fluoride can be used to infer the relative importance of some of the more commonly proposed degradation mechanisms.
Experimental
Sample fabrication
Membrane electrode assemblies (MEAs) were fabricated with either 3M Ionomer or Nafion™ NR211 membranes. The 3M membranes were 30 microns thick and made on a pilot scale coating line using 3M 800EW ionomer cast from an alcohol/water dispersion with no cerium or mechanical support. The 25-micron thick NR211 membranes were obtained from Ion Power and do not contain additive or support. The anode and cathode electrodes were fabricated at 3M by first making an ink in a nitrogen-inerted enclosure followed by coating onto a 25-micron polyethylene terephthalate (PET) film with a silicone release surface using a notch bar and dried in a four-zone oven with a final temperature of 145 °C. The anode ink consisted of 10VA20E (TKK) and 800 equivalent weight 3M Ionomer with an ionomer to carbon ratio of 0.8 and a final loading of 0.05 mg Pt cm−2. Similarly, the cathode ink consisted of 10EA50E (TKK) and 800 equivalent weight 3M Ionomer at an ionomer to carbon ratio of 1.0 and a final loading of 0.30 mg Pt cm−2. Catalyst coated membranes (CCMs) were prepared by laminating the anode and cathode layers to the membrane using steel-to-steel rollers heated to 163 °C. A 25-micron subgasket made from polyethylene naphthalate (PEN) with a pressure sensitive adhesive was attached to the perimeter of the CCM to provide edge protection during the OCV test. Gas diffusion layers (GDLs) were made using carbon paper from Mitsubishi Chemical Carbon Fiber Composites that was treated with poly(tetrafluoroethylene) (PTFE) and coated with an acetylene black microlayer containing PTFE and fluorinated ethylene propylene (FEP) polymer. The MEAs were assembled by loose-laying GDLs onto the CCMs and mounting into a 50 cm2 test cell with quad serpentine graphite flow fields. Compression was fixed at 20% using fiberglass/Teflon™ composite gaskets.
OCV testing
MEAs for OCV testing were started up by running 20 potentiodynamic scans (PDS) alternating with potentiostatic scans (PSS) at 0.4 V for 5 min at 75 °C with hydrogen and air dew points of 70 °C. This was followed by 6 "thermocycles"—defined as a 45 min OCV hold at room temperature followed by a set of 4 PDS/PSS steps at the previously described conditions. The sample was then characterized using a variety of galvanodynamic scans and cyclic voltammetry techniques. The cell was transferred to a dedicated 10-cell durability test stand where it was run at 90 °C with 60 °C hydrogen and air dew points (30% RH). Every 12 h, the cell was run at 0.2 A cm−2 for 10 min where the potential was measured and the cell high frequency resistance (HFR) was measured using an IM6 modular electrochemical workstation (ZAHNER-Elektrik GmbH & CoKG, Kronach, Germany). Cathode effluent water was collected approximately every other day by routing the exit gas through a chilled stainless-steel vessel and condensing the exhaust vapor to liquid water. The water was analyzed without further concentration by ion chromatography.
Ion chromatography (IC)
Two ion chromatograph methods were employed in this work. The first was routinely used to measure fluoride, sulfate, trifluoroacetate, and oxalate ions in the effluent water of each cell. These samples were analyzed without additional concentration using an ICS-2000 ion chromatography system (Dionex, Sunnyvale, CA). The second method was used to measure the total organic fluoride in a selected number of samples through combustion ion chromatography. Briefly, the total fluoride, which is comprised of both inorganic fluoride and total organic fluoride, was measured using a 3M Patented, Metrohm Inc. Combustion Ion Chromatography (CIC) custom set up. 30 Initially the samples are passed through an in-line chloride removal module then combusted using a combustion chamber. The analytes are then separated by isocratic separation using sodium carbonate/sodium bicarbonate buffer and analyzed using a conductivity detector with a Metrohm IC system. The fluoride ion measured after combustion provides the total fluoride content in a sample. Inorganic fluoride is measured in parallel using a portion of the chloride free sample and a second Metrohm IC unit without combustion. The water soluble total organic fluoride (TOF) is obtained by subtracting measured inorganic fluoride from the total fluoride (TOF in a sample = TFmeasured—IFmeasured). In the instances where IF is present at significant levels compared to TOF, the TOF results are reported as <TOF-LOQ. The TOF-Limit of Quantitation (TOF-LOQ) is defined as the level of TOF that can be measured reliably above the level of IF in a sample. It is important to note that TOF-LOQ will depend on the amount of endogenous inorganic fluoride present in a sample. Based on the validation experiments conducted at 3M's Environmental Health and Safety (EHS) laboratory, TOF-LOQ is reported as <20%IF levels in the sample.
Since the same samples were evaluated for inorganic fluoride using traditional IC and CIC, the inorganic fluoride data was compared for consistency. Plotting the data from both methods against each other resulted in a high degree of correlation (R2 = 0.99) with the CIC method resulting in slightly lower values of about 85% those of the traditional IC.
The ion release rate (IRR) was determined for fluoride (FRR), sulfate (SO4RR), trifluoroacetate (TFARR), and oxalate (OARR) using the following formula where "I" represents the ion of interest, gI·gH2O −1 is the ion concentration, and gH2O·h−1 is the effluent water collection rate.
A subscript is added when discussing data to designate traditional IC (IRRIC) or CIC (IRRCIC). The analyses in this study only include the data prior to the end-of-life to avoid complications that may arise due to direct crossover of gases after a membrane breach.
Results
The OCV potential and ion release rate results of sixteen cells containing 3M 800EW ionomer membrane operated at OCV are shown in Fig. 1. All cell potentials and ion release rates are grouped by color for clarity. In addition to the expected inorganic fluoride and sulfate ions, several unidentified peaks are often observed in the ion chromatograms. These peaks are suspected to be small molecule organic ions associated with membrane degradation but typically cannot be identified due to a lack of known standards. Two notable exceptions are trifluoroacetate (TFA) and oxalate (OA) which are easily obtained allowing for quantification. Like the 3M Ionomer, eight Nafion™ NR211 membranes were run in the same way with the data shown in Fig. 2.
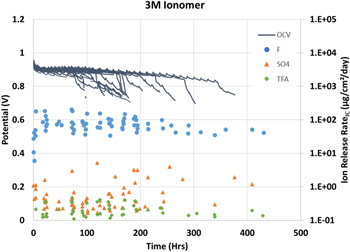
Figure 1. OCV potential for sixteen 3M 800EW ionomer membranes (solid lines) with fluoride (●), sulfate (▲) and trifluoroacetate (♦) ion release rates.
Download figure:
Standard image High-resolution image
Figure 2. OCV potential for eight NR211 membranes (solid lines) with fluoride (●), sulfate (▲) and trifluoroacetate (♦) ion release rates.
Download figure:
Standard image High-resolution imageThe end of life for the OCV test is defined as the time at which the potential goes below 0.8 V. In most cases, this is immediately after an inflection in the OCV vs time curves and is a reliable indication of a breach in the membrane associated with end of life. Given the relatively large number of repeated tests for both membranes, the lifetime distribution can be fit using Minitab™ statistical software. Several distributions were evaluated for these data with normal, lognormal, and Weibull distributions all having high correlation coefficients. The best fit was the lognormal distribution with correlations of 0.987 and 0.984 for the 3M and NR211 samples, respectively. Figure 3 shows the overlaying histograms for each ionomer along with the distribution curves. The lifetime mean, median, and standard deviation are summarized in Table I. These distributions are determined to have different means as judged by a two sample T-Test P-value of 0.008, with the 3M Ionomer membranes lasting about 75 h longer than the NR211 counterparts. It should be noted that the lifetime is potentially influenced by the somewhat thicker 30 μm 3M Ionomer membrane compared to the 25 μm Nafion NR211 sample.
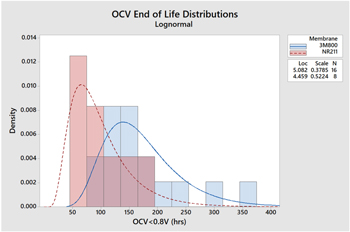
Figure 3. OCV lifetime distributions for 3M Ionomer membrane (blue) and Nafion NR211 (red).
Download figure:
Standard image High-resolution imageTable I. Average lifetimes in hours for 3M Ionomer and Nafion NR211 membranes fit to lognormal distribution.
| Membrane | Samples | Mean OCV | Median OCV | Stdev |
|---|---|---|---|---|
| 3M800EW | 16 | 172 | 161 | 65 |
| NR211 | 8 | 97 | 86 | 51 |
The ion release rates for the quantifiable ions are summarized in Table II. Effluent water is collected for about one hour at intervals of one to three days for each cell. Only the data from samples prior to end of life are included in the averages. Interestingly, the NR211 samples showed statistically significant lower FRRs compared to the longer-lasting 3M ionomer samples (P-value 0.00). The sulfate release and oxalate release rates are very low and effectively the same for both membranes. In the sulfate case, trace amounts are often detected in periodic blanks, however, the OCV samples were typically about 10 times higher than those values (see Table SI (available online at stacks.iop.org/JES/169/034526/mmedia)). The trifluoroacetate ions are notably higher for the NR211 membranes owing to fragments that can be traced back to the -CF3 group in the side chain. 31
Table II. Average Ion Release Rate for 3M Ionomer and Nafion NR211 membranes.
| Ion Release RateIC (μg cm−2/day) | ||||||||
|---|---|---|---|---|---|---|---|---|
| Membrane | F− | Stdev | SO4 −2 | Stdev | TFA | Stdev | OA | Stdev |
| 3M800EW | 87 | 46 | 0.47 | 0.49 | 0.20 | 0.11 | 0.15 | 0.07 |
| NR211 | 43 | 37 | 0.53 | 0.56 | 3.1 | 2.7 | 0.12 | 0.04 |
Next, selected samples of effluent water were analyzed for total organic fluoride (TOF) using combustion ion chromatography. This technique is based on the difference between the inorganic fluoride (F−) routinely measured by IC and the total fluoride of a combusted sample. Since the fluoride analysis was replicated as part of the TOF measurement, both values are reported. Figure 4 shows these data along with the TOF (open squares) for three representative 3M ionomer membranes. The inorganic FRR of both methods agree very well with the values from the traditional IC being slightly higher than those measured as using the CIC method.
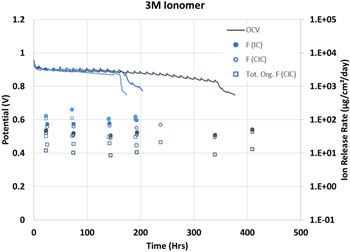
Figure 4. Selected OCV, fluoride (● or ○), and total organic fluoride (□) data for three 3M 800EW ionomer membranes.
Download figure:
Standard image High-resolution imageSimilarly, two Nafion NR211 samples were selected for the same analysis (Fig. 5). As with the 3M samples, there is good agreement between both IC methods with the IC method being slightly higher than the CIC method.
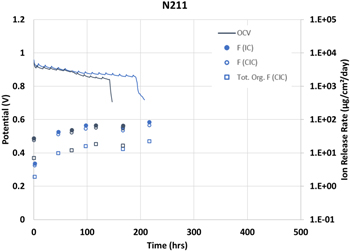
Figure 5. Selected OCV, fluoride (● or ○), and total organic fluoride (□) data for two Nafion™ NR211 membranes.
Download figure:
Standard image High-resolution imageDiscussion
Open circuit voltage testing has been a longtime standard in accelerated life testing of fuel cell membranes. Coupled with fluoride release rates, this method has been an invaluable tool in developing modern membranes comprising mechanical support and radical scavenging additives. This study, however, was conducted without the use of support or additives to allow for maximum membrane degradation rates. The choice of catalyst also has an impact on membrane degradation, 32 for this reason simple platinum on carbon electrodes were chosen rather than alloys that are typically used in advance cathodes. These factors have the potential to alter the relative rates of membrane degradation reactions and caution is advised when generalizing the results of this study to other materials sets or operating conditions.
In general, there are four proposed membrane degradation pathways: (1) polymer chain end unzipping, (2) peroxide attack at the sulfonic acid side chain, (3) abstraction of the backbone tertiary fluorine, and (4) radical attack at the sidechain ether linkage. Since the products from the last two pathways are expected to be the same, and there is more experimental evidence suggesting t-fluorine abstraction occurs in a fuel cell, 6,27,33 the subsequent discussions will refer to the t-fluorine path while recognizing cleavage of the ether linkage is also a possibility. Details of these mechanisms for PFSA membranes are outlined in many excellent papers and reviews. 6–10,12 These reactions have been demonstrated in various controlled conditions: missing is an assessment of the relative importance of each pathway in operating fuel cells. For this discussion, the specific reactions steps will not be explicitly written out but rather only the expected products at the conclusion of the process.
Perhaps the most frequently invoked degradation pathway is polymer chain end unzipping. This mechanism was proposed by Curtin and later refined by Coms and others.
6,17,18
It is also a well-documented reaction for the oxidative degradation of small molecule perfluorocarboxylic acids.
34–36
Schemes
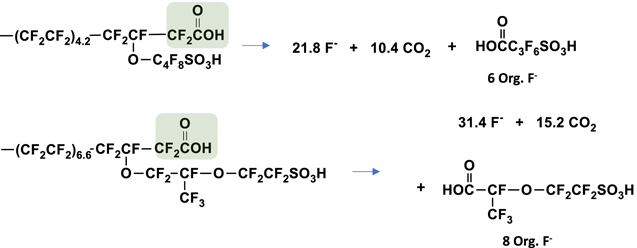
Scheme 1. Expected products for end group unzipping reaction originating at the carboxylic acid. 3M Ionomer shown above (1a) and NR211 shown below (1b).
Download figure:
Standard image High-resolution imageAnother proposed degradation mechanism is the attack of hydroxyl radicals (HO·) or other species on the sulfonate or sulfonic acid.
6,9,37–39
Once the carbon sulfur bond of the sulfonate group is cleaved, the remaining unstable radical intermediate is expected to undergo a series of reactions to ultimately form a carboxylic acid. Assuming this carboxylic acid is less stable than the original sulfonic acid, it should proceed to unzip up the sidechain, cleave the backbone, and continue with the unzipping mechanism. In essence, the entire polymer would degrade to simple inorganic ions with no fluorinated organic compounds. Alternatively, backbone unzipping, followed by continued unzipping of the side chain fragment would also result in only simple ions. For the 3M Ionomer, one sulfate ion would accompany 27.8 fluoride ions resulting in a mole ratio of 0.037 or mass ratio of 0.182 (Scheme
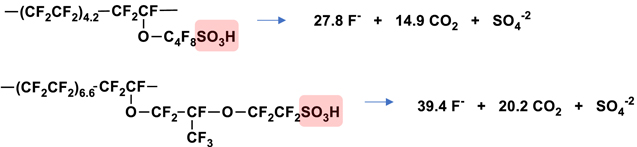
Scheme 2. Expected products for degradation reaction originating at the sidechain sulfonic acid. 3M Ionomer shown above (2a) and NR211 shown below (2b).
Download figure:
Standard image High-resolution imageThe last mechanisms of interest are abstraction of a tertiary fluorine (t-fluorine) by a hydrogen atom (H·)
6,33
or cleavage of a carbon-oxygen ether bond from peroxide attack.
9,40
In either case, the fragments would be expected to be identical. In this scenario, only the side chain would be liberated, and new chain ends formed due to backbone cleavage. Inorganic fluoride ions accompany this process even in the absence of the traditional unzipping mechanism. For 3M Ionomer shown in Scheme

Scheme 3. Expected products for degradation reaction originating at the tertiary fluorine or ether link. 3M Ionomer shown above (3a), NR211 backbone linkage only shown in the middle (3b), and both NR211 linkages shown below (3c).
Download figure:
Standard image High-resolution imageThroughout this discussion, the reaction products are represented as carboxylic acids, however, the partially hydrogenated counterparts of these fragments have been reported where the –CO2H group is a reduced to a –CH3 group and may be the predominant species in some reactions.
24,27,28
Nevertheless, the same organic to inorganic fluoride ratios are expected for Schemes
Table III. Organic fluorine, fluoride, and sulfate expected for each reaction scheme.
| Scheme | Membrane | Org. F- (mol) | Inorg. F- (mol) | SO4 −2 (mol) | Org. F:F− (mol:mol) (wt:wt) | SO4 −2:F− (mol:mol) | SO4 −2:F− (wt:wt) |
|---|---|---|---|---|---|---|---|
|
| 3M | 6 | 21.8 | 0 | 0.275 | 0 | 0 |
|
| NR211 | 8 | 31.4 | 0 | 0.255 | 0 | 0 |
|
| 3M | 0 | 27.8 | 1 | 0 | 0.037 | 0.182 |
|
| NR211 | 0 | 39.4 | 1 | 0 | 0.024 | 0.128 |
|
| 3M | 6 | 5 | 0 | 1.20 | 0 | 0 |
|
| NR211 | 8 | 5 | 0 | 1.60 | 0 | 0 |
|
| NR211 | 5 | 8 | 0 | 0.625 | 0 | 0 |
Before discussing the experimental data, it should be noted that this analysis is predicated on the assumption that all ions and fragments exit the cell in the relative amounts in which they were generated. It is possible that some more volatile fragments may be lost to evaporation, or certain ions or fragments may be preferentially retained in the membrane or other components of the MEA. The conclusions of this analysis must, therefore, be viewed with the understanding that the collection efficiency for each ion or fragment was not quantitatively determined.
Considering the sulfate ion data first, a plot of the sulfate release rate vs fluoride ion release rate is shown in Fig. 6. Accompanying each plot is a line representing the expected mass ratio of sulfate to fluoride for the case where the ionomer degrades completely to simple ions depicted in Scheme
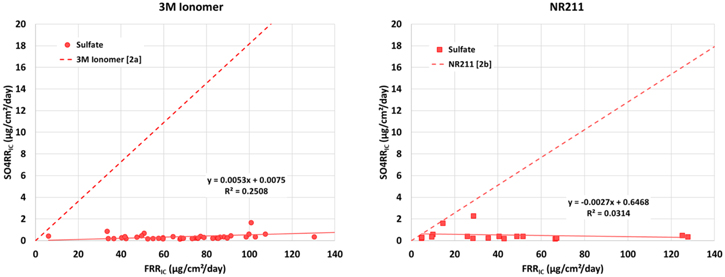
Figure 6. Sulfate release rate vs fluoride release rate for 3M Ionomer samples (left) and NR211 (right). Expected ratio of sulfate to fluoride ion for Scheme
Download figure:
Standard image High-resolution imageThe relationship between organic fluoride and fluoride ions offers more insight into the degradation process. The fact that organic fluoride is detected suggests that Scheme
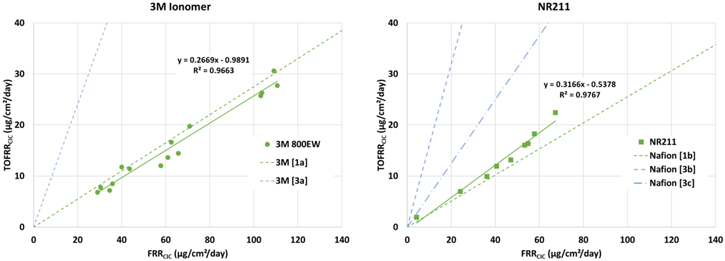
Figure 7. Organic fluoride vs inorganic fluoride ions for 3M Ionomer (left) and NR211 (right). Expected ratio of organic to inorganic fluoride form Schemes
Download figure:
Standard image High-resolution imageThe NR211 effluent water offers additional analysis possibilities through the trifluoroacetate (TFA) release rate. Figure 8 shows the organic fluoride attributed to the measured amount of TFA. In other words, this plot does not represent the actual TFA release rate but rather the organic fluoride attributed to the TFA allowing for a consistent basis of comparison to previous data. Like the total organic fluoride, there is a reasonable correlation between TFA release rates and FRR (R2 = 0.71 and 0.87 for 3M and NR211). The most likely source of TFA is from the reaction outlined in Scheme

Figure 8. Fluoride ions associated with TFA vs fluoride ions. Expected ratio for Scheme
Download figure:
Standard image High-resolution imageThe level of TFA detected in the 3M Ionomer samples is substantially less than that of NR211 as shown in Fig. 8 (left). Interestingly, despite the lack of -CF3 functionality in the 3M ionomer, there is still a moderate correlation between the overall fluoride release rate and the TFA values (R2 = 0.71). The origin of TFA in these samples is unclear and will be the subject of future investigations.
The conclusion from the fluoride, sulfate, TFA, and organic fluoride data in total suggests that the dominant degradation mechanism for both the 3M ionomer and NR211 is backbone unzipping that liberates small molecule side chains (Scheme
Like the t-fluorine reaction process (Scheme
So far, this analysis has only considered cases where the entire backbone degrades (Schemes
Another issue to address is the apparent coexistence of hydroxyl radicals (HO·) and hydrogen radicals (H·) that are responsible for ionomer degradation. Clearly, if these two species where in proximity to each other they would preferentially combine to form water rather than react with the ionomer. One explanation for this apparent paradox might be the existence of different reactive species in different locations of the membrane or electrodes. Such a hypothesis is supported by reports of localized degradation in the membrane. 33 Perhaps this could be a focus of future studies.
Given the measured fluoride and organic fluoride release rates, an inventory of the membrane lost at end of life can be calculated using Eq. 2. The lifetime of the cell is designated in hours (h), and ratio of the molecular mass of the parent ionomer fragment (frag.) to the fluoride ion (F) mass is gfrag·gF −1.

In the case of the fluoride release rate, it is assumed that most of the F− ions are coming from the –(CF2)– backbone with a gfrag·gF −1 ratio of 1.32. These assumptions are surely overly simple as fluoride ions are released in the absence of –(CF2)– unzipping and do not account for side chain/backbone juncture points. For the total organic fluoride, only side chain fragments were considered with gfraf·gF −1 values of 2.30 for the 3M Ionomer and 2.16 for NR211. Again, this may be an oversimplification as some fragments may undergo degradation after cleavage from the backbone. Nevertheless, this analysis provides an approximate inventory of the membrane lost in this experiment. Individual lifetimes, FRR, and percent membrane loss calculated from traditional IC are shown in Table SII for the 3M Ionomer and S4 for NR211 membranes. Similarly, membrane loss calculated from FRR and TOF from CIC are shown in Tables IIIS and VS for each membrane. The averages of each data set are summarized in Table IV.
Table IV. Fluoride and organic fluoride release rate membrane inventory.
| Unit | 3M Ionomer | NR211 | |
|---|---|---|---|
| IC Method | |||
| Sample size | 18 | 8 | |
| Average FRRIC a) | (μg cm−2/day) | 95 ± 46 | 49 ± 33 |
| Membrane loss FRRIC a) | (%) | 12.6 ± 4.0 | 5.5 ± 4.6 |
| CIC Method | |||
| Sample size | 3 | 2 | |
| Ave. FRRCIC a) | (μg cm−2/day) | 68 ± 37 | 38 ± 4 |
| Ave. TOFRRCIC a) | (μg cm−2/day) | 20 ± 11 | 11.3 ± 1.5 |
| Membrane loss FRRCIC a) | (%) | 12.6 ± 3.1 | 7.0 ± 0.8 |
| Membrane loss TOFCIC a) | (%) | 6.6 ± 1.6 | 3.4 ± 0.3 |
| Membrane loss TotalCIC a) | (%) | 19.2 ± 4.7 | 10.4 ± 1.0 |
In this experiment, at least 12.6% of the 3M Ionomer mass is lost as determined by the FRR using either IC or CIC method. However, the more complete assessment including the TOF from the CIC adds another 6.6% mass loss attributed to water soluble organic fragments for a total mass loss of around 19%. A similar situation exists for the NR211 samples where fluoride ions account for 5.5%–7% of the membrane mass and organic fragments another 3.5% for a total estimated mass loss of at least 10%. It is unclear why the 3M Ionomer loses more membrane mass yet lasts longer than the NR211 membranes. This may be an artifact of the slightly thicker 3M Ionomer membranes (30 vs 25 μm) or may be influenced by mechanical properties of the membranes. It must be emphasized that these data are from the cathode effluent water only. It is reasonable to assume fluoride ions or water soluble fluorinated organic fluoride will diffuse within the membrane and exit in both the cathode and anode streams. 42,43 Therefore, the values calculated almost certainly underestimate the true membrane loss, which could be up to twice these values if fluoride and fragments exit either side of the cell at the same rate.
Yet to be discussed is the detection of oxalate ions in the effluent water of both the 3M Ionomer and NR211 samples (see Table II). Even though oxalate is detected, its role in degradation reactions is unclear. The levels of this ion are also extremely low and show no correlation to FRR (R2 = 0.017 and 0.003 for 3M and NR211). One possibility was suggested by Yu where a hydroxyl radical (HO·) attacks the sulfonate sidechain end to remove HSO4
− leaving a carbon centered radical that further eliminates tetrafluoroethylene oxide (Scheme
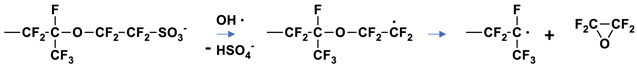
Scheme 4. Proposed degradation reaction from reference 13 resulting in tetrafluoroethylene oxide.
Download figure:
Standard image High-resolution image
Scheme 5. Anticipated reactions for tetrafluoroethylene oxide resulting in oxalic acid.
Download figure:
Standard image High-resolution image
The lack of correlation of the sulfate and oxalate ions to the fluoride release rate remains an unresolved question. These ions are detected at very low levels (<0.05 ∼ 0.5 μg ml−1) but are still above the deionized water blanks. The lack of correlation to fluoride release rates might suggest that whatever the mechanism, it is slow compared to primary degradation reactions.
Finally, there may be a desire to capture membrane decomposition products from fuel cells and other electrochemical cells. Strategies including filters with ion exchange resins or high surface area adsorbents such as activated carbon could be employed in commercial systems. Additionally, separating the liquid water from water vapor may aid in the efficient removal of water-soluble membrane fragments.
Conclusions
A series of 3M Ionomer and NR211 membranes without radical scavenging additives or mechanical support were evaluated for durability using the DOE OCV test. Lifetimes were fit to a lognormal distribution as is typical for durability testing, with 3M Ionomer membranes having longer lifetimes despite higher fluoride release rates. Ion chromatography and combustion ion chromatography analysis of cathode effluent water was used to infer relative significance of three proposed degradation schemes. Sulfate ion release rates were used to rule out meaningful degradation originating at the terminal end of the sulfonic acid side chain. Total organic fluoride methods were used to determine the amount of fluorine containing, water soluble, membrane fragments. The ratio of organic fluorine to inorganic fluoride is consistent with backbone unzipping as the primary degradation pathway. The NR211 membranes, however, have a higher ratio implying degradation at the backbone or side chain tertiary fluorine to be an important secondary degradation pathway. This conclusion is supported by the detection of trifluoro acetate in the NR211 membrane effluent water. Interestingly, low levels of oxalate are detected in both the 3M Ionomer and NR211 samples. The levels of this ion have no correlation to the fluoride, or other ion, release rates and no conclusions can be drawn from these data yet.
The combination of fluoride and organic fluorine values were used to estimate membrane mass loss for both types of membrane. The 3M Ionomer membranes lose at least 20% of their mass while NR211 is closer to 10%. These values represent inventories based on cathode water only and therefore are likely to be underestimates as degradation products are also apt to escape through the anode effluent stream.
Lastly, it is well known that the conditions used in this study are especially harsh favoring rapid membrane degradation. Cells under normal operating conditions have orders of magnitude lower degradation rates resulting in very low levels of fluoride ion release and organic fluorine compounds. 21,24,44 The techniques described in this work can be applied to these non-accelerated operating conditions to better capture normal use degradation mechanisms and validate the OCV or other accelerated methods.
Acknowledgments
This work was supported by Department of Energy grant DE-EE000924.