
Abstract
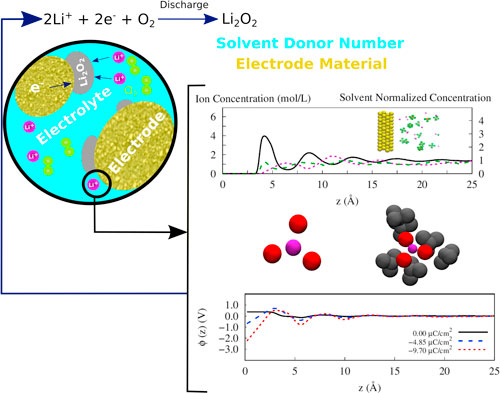
The lithium-air battery is getting attention as a good technology for energy storage. Nevertheless, the design of such a device still faces some crucial limitations. The most challenging one concerns the selection of electrodes and solvents to provide good performance during the cell operation. Based on literature evidence, we have selected three system configurations of electrode/electrolyte to be evaluated via molecular dynamics simulation: gold/DMSO (dimethyl sulfoxide), graphene/DMSO, and graphene/TEGDME (tetraethylene glycol dimethyl ether) using lithium hexafluorophosphate—LiPF6. We show that the local concentration distributions for DMSO and Li+ are highly influenced by the electrode material. Furthermore, the Li+ solvation shell presents a more complex arrangement when in composition with TEGDME. Additionally, the electrical double layer capacitance in this solvent shows high impedance to the electrode surface. This investigation noticed that the electric field plays a role over the system, contributing to the solvent organization and the electrical double layer formation. Overall, this study strengthens the idea that theoretical findings may contribute to a complementary investigation, leading some light over experimental Li-air battery data reported in the literature.
Export citation and abstract BibTeX RIS
Lithium-air or Li-O2 batteries entail a promising energy storage technology, achieving energy density levels comparable to those from fossil fuels. A typical aprotic battery is composed of a lithium anode, an air-breathing cathode, and a solvent/lithium salt-based electrolyte solution. The energy is stored through oxidized species from lithium-oxygen reaction. 1,2 In recent years Li-air batteries are receiving considerable attention and the development of electrodes, electrolytes, and the understanding of their impact over the reaction pathways are an important step on the project of devices with good capacity and cyclability. 1–5
In respect to the electrode assembly, two important features that must be considered to achieve these goals are adequate porosity and morphology. The Li-air battery electrode needs to accommodate the discharge products, promote O2 diffusivity, and contribute to the recharging process. 2,6 Carbon-based electrodes are widely used as porous media for Li-air batteries due to their good conductivity and low production cost. Nevertheless, these materials suffer from oxidation at high voltages and chemical instability. 2,7,8,9 Metal electrodes, such as gold, have good electron transport and high oxidation stability, therefore appearing as alternatives to carbon materials. 7 Gold also leads to good cyclability (over 100 cycles) with a small number of by-products formation. 10 Nevertheless, the high potentials required to keep the cell reversibility causes solvent degradation and the high cost narrows its use. 11
Likewise, the electrolyte must exhibit low volatility, high lithium conductivity, and good O2 solubility and diffusivity. 2,12,4 High donor-number (DN) solvents such as DMSO (dimethyl sulfoxide) 13,14 are a popular choice for lithium-air battery applications. Several authors have shown that DMSO has a positive impact on battery operation (reversibility, reaction pathway, Li+ conductivity). 12,15,16,4 However, some disadvantages of this solvent concern deterioration at high potentials, 11 side products formation which ultimately jeopardize the cyclability. 17,18 Another important solvent used in Li-air batteries is the TEGDME (tetraethylene glycol dimethyl ether). Even though TEGDME is a low DN solvent, 13,14 and exhibits higher volatility and lower Li+ conductivity, it is known to have higher chemical stability and good O2 solubility. 4,12,9 Generally speaking, DMSO has a better performance in charge capacity and TEGDME increases the stability of cycling at long-life operation. 18,17
Despite the selection of suitable electrodes and electrolytes, the impact of their synergy over reaction mechanisms plays a crucial role in a rational selection for this application. 19,20 Once the electrochemical process takes place at the interface region, a closer look at the interfacial phenomena during battery operation may help to elucidate fundamental issues that govern the device performance. 21,22 The Li+ solvation shell 23–25 and the dynamics of Li+ close to the surface 26,27 are examples of important information that are useful to understand reactions pathways in lithium-based batteries.
The majority of literature regarding the effect of electrode materials and solvents DN over reaction routes and battery performance relies on experimental findings. Concerning the electrode-electrolyte interface, scarce literature approaches the typical Li-air solvents and electrodes when compared to the extensive literature to understand the interfacial phenomena in Li-ion batteries 21 and others electrochemical systems. 28 Several authors reported findings based on molecular dynamics simulation (MD) of systems subjected to electric potentials, 27,29–32,33 temperature, 30 and solvent composition. 34,35 Evidencing the flexibility of the MD technique to predict interfacial dynamics and structural data of electrochemical systems.
In the current work, we evaluate the local concentration, the Li+ solvation shell arrangement, the electric double layers of systems composed of two electrode materials, gold and graphene, and two solvents with different DN (DMSO and TEGDME) under three electrical potentials through molecular dynamics simulations. These simulations are representing a piece of the electrolyte/electrode interface region under polarizable conditions (therefore away from the original equilibrium) but the results are indeed a description of a new equilibrium condition that is formed at those conditions.
The aim of this work is to understand the ordering of the system when external potentials are applied thus mimicking an operational condition even though the simulation could not account for an actual reaction system. A deeper look at those variables and their effect at a molecular scale helps to better understand and to elaborate upon reaction mechanisms behind the macroscopic experimental findings for the oxygen reduction reaction (ORR). This data is fundamental to help in the project of better Li-air devices.
Simulation Details
Equilibrium molecular dynamics simulations were carried out considering electrodes composed of gold (111) and graphene ABAB (Bernal) stacking sequence (Fig. 1e). Each electrode (anode or cathode) was simulated with a flat wall made of four layers of gold or graphene, and each layer contains 120 gold or 336 carbon atoms, respectively. The walls were prepared with the aid of the tools Avogadro 1.2.0 36 for gold, and VMD 1.9.3 37 for graphene.
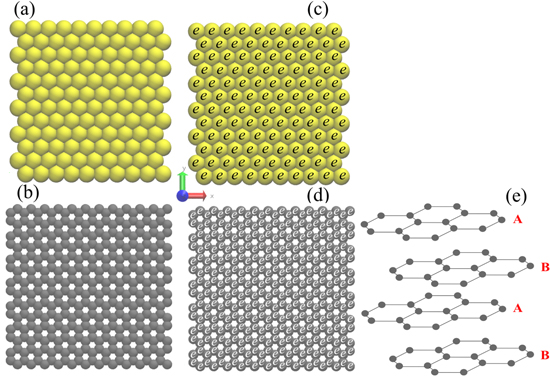
Figure 1. Representation of electrode surface in contact to the electrolyte for: (a) gold (111) and (b) graphene (ABAB) at neutral charge condition; (c) gold (111) and (d) graphene (ABAB) at charged condition, and (e) the detail of the ABAB (Bernal) graphene stacking sequence. The letter e represents the fixed charge added to each atom that composes the surface in contact with the electrolyte. Atom color code: gold (yellow) and carbon (gray).
Download figure:
Standard image High-resolution imageFigures 1a and 1b show the electrode surface structure of gold and graphene in contact with the electrolyte at zero charges. The implementation of the electric field was performed by the inclusion of a small charge in each atom that composes the interfacial layer, as exemplified in Fig. 1c and 1d. Table I presents the atomic charges (e) applied to the surface to obtain the electric fields used on the interface simulations.
Table I. Atomic charges assigned to gold and graphene electrodes atoms.
| e | ||
|---|---|---|
| Surface charge | ||
| μC·cm−2 | Gold | Graphene |
| −4.85 | 0.0225 | 0.008 665 |
| −9.70 | 0.0450 | 0.017 330 |
Two electrolyte compositions were evaluated, 1 mol·kg−1 of lithium hexafluorophosphate (LiPF6) in DMSO, and 1 mol·kg−1 of LiPF6 in TEGDME. The solutions were composed of 512 DMSO and 40 LiPF6 molecules, and 180 TEGDME and 40 LiPF6 molecules, respectively. The structure of DMSO and TEGDME molecules and each ion of (LiPF6) were prepared and optimized at the B3LYP/6-311++g(d,p) level using the Gaussian 09 package. 38 The initial configurations boxes were assembled using Packmol package. 39 A sequence of simulations were carried out to ensure appropriate densities and equilibration of the interface system settings, described as follows:
- 1.
- 2.Then, rectangular boxes were built fixing the density reached in the previous step (Fig. 2b). Ensuring the same volume of cubic and rectangular boxes for both electrolyte systems. Similar to the first stage, the rectangular boxes were equilibrated for 10 ns in the NVT ensemble.
- 3.Thereafter, the electrode slabs and vacuum regions were added to the rectangular box sides (Fig. 2 c). For all cases, the inner layer of each electrode was set 80 Å apart to achieve a bulk-like behavior in the center region of the system. 27 It was characterized by the achievement of NPT density (cubic box) in a region of 20 Å thickness in the center of the system as presented in Table S3 and Fig. S2.

Figure 2. Schematic representation of the simulated box stages: (a) cubic box (DMSO/LiPF6), (b) rectangular box (DMSO/LiPF6), and (c) interface box (graphene/DMSO/LiPF6). Atom color code: oxygen (red), hydrogen (white), carbon (cyan), sulfur (yellow), lithium (magenta), phosphorus (orange), fluorine (green), and carbon—graphene (gray).
Download figure:
Standard image High-resolution imageAll simulations were performed using LAMMPS package 40 employing a classical force field setting. The selection of the force field was motivated due to a lack in the development of force fields that considers reactions and the polarization, 41 in particular for the systems evaluated in this work. Additionally, these force fields lead to a computational cost that limits their applicability. 42 Classical force fields are still in use to perform interface simulation, even though leading to a limited representation of the phenomena occurring in the system. 32,33,43 Force field parameters for electrodes and electrolytes were taken from the literature, 44–49 and are presented in Tables S1 and S2. The charges designated for TEGDME atom are shown in Fig. S1, 45 Lennard-Jones parameters for cross interactions were obtained using the Lorentz-Berthelot combining rules. Periodic boundary conditions were applied in the x and y directions. A vacuum space of 220 Å was added to each side of the rectangular box (z direction) to prevent any spurious interaction. Long-range electrostatic interactions were calculated by particle-particle particle-mesh scheme (PPPM), 50 and the unwanted slab-slab interactions in z direction were corrected. 51,52 The setup of the interface boxes is demonstrated in Fig. 3. Electrode atoms were kept fixed in order to solely analyze the electrolyte behavior close to the interface. In the cases of the charged electrode, a small charge was added to each atom of the inner layers (Figs. 1c and 1d; Table I). Negative charges were balanced by positive charges on the opposite wall to guarantee the electroneutrality of the system. All simulations were carried out in the canonical ensemble (NVT) at 298 K, applying Nosé-Hoover thermostat. 53,54 The simulations were run for 90 ns for TEGDME system, and 50 ns for DMSO systems. The first 50 ns for TEGDME system and 40 ns for the DMSO systems were discarded as equilibration steps. Block and trajectory averaging were applied at the production stage, fixing blocks of 4 ns and 2 ns for each of the 5 trajectories for TEGDME and DMSO systems, respectively.
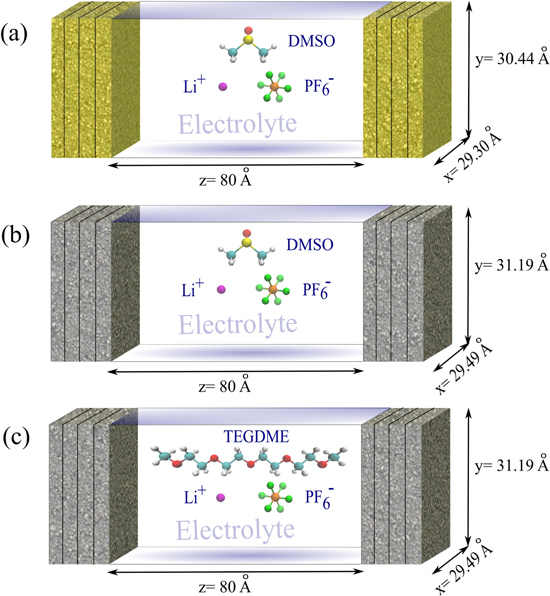
Figure 3. Schematic representation of the simulated systems: (a) gold electrodes and DMSO/LiPF6 electrolyte, (b) graphene electrodes and DMSO/LiPF6 electrolyte, and (c) graphene electrodes and TEGDME/LiPF6 electrolyte. Electrolyte atom color code: oxygen (red), hydrogen (white), carbon (cyan), sulfur (yellow), lithium (magenta), phosphorus (orange), and fluorine (green).
Download figure:
Standard image High-resolution imageResults and Discussion
Figures 4, 5, and 6 show the local concentration profiles according to the center-of-mass position of each molecule along z direction for the following electrode/electrolyte compositions: gold/LiPF6 in DMSO, graphene/LiPF6 in DMSO, and graphene/LiPF6 in TEGDME, respectively. The solvent concentration was normalized by its bulk value. Concentrations above 1.5 are considered peaks, exceptionally for the TEGDME system, which suffers from statistical uncertainties. The TEGDME statistics limitation is related to the force field overprediction of TEGDME dynamic properties. 45 Additionally, the center mass of this molecule is difficult to be computed, one TEGDME is composed of 37 atoms. To provide more reliability to the data presented in this work, a statistical analysis of all concentrations distributions is shown in Fig. S3, S4, and S5 of the available at stacks.iop.org/JES/169/030521/mmedia Supplementary Information. The calculations presented in the Supplementary Information were developed using a combination of multi-blocking and multi-trajectories methods. It is possible to see that higher standard deviations are observed for TEGDME results in comparison with those from DMSO simulations. However, the average measure can capture the behavior of this system. Additionally, the errors are lower in particular below 10~Å~where lies the region of interest in this study.

Figure 4. Local concentration profiles of: ions (left y axis) and DMSO solvent (right y axis). DMSO—black solid line; Li+—magenta dotted line; PF6 −—green dashed line. Surface charges applied: (a) zero, (b) −4.85 μC·cm−2, and (c) −9.7 μC·cm−2. The insets show the visualization of ions and the negative electrode. Atom color code: gold (yellow), lithium (magenta), phosphorus (orange), and fluorine (green).
Download figure:
Standard image High-resolution imageConsidering the composition LiPF6 in DMSO, at neutral gold and graphene electrodes, it is possible to observe that only two layers of DMSO are adsorbed at their surface (Figs. 4 and 5a). Similar behavior was also reported by other researchers for solvents at solid/liquid interface. 29,34,27 The concentration of the first DMSO peak in the graphene electrode is twice as high as the one on the gold surface. Additionally, the first layer is also sharper in graphene than in gold. Those differences evidence the effect of electrode material in solvent/electrode interaction. The behavior of Li+ and PF6 − is quite similar at both electrodes at zero charge. Adding a charge of −4.85 μC·cm−2 at the left electrode (balanced with the opposite charge on the right electrode) (Fig. 4 and 5b), we see the formation of a Li+ peak at a position of 6 Å with roughly the same concentration in both materials. An early shoulder structure appears in DMSO first layer which is caused by the electrostatic interaction between electrode-solvent/solvent-Li+. This shoulder is composed of two divisions in graphene. The side position of them are opposites, being in gold left and in graphene right, suggesting a stronger interaction between DMSO/Li+ in gold electrode and between DMSO/graphene in graphene composition.

Figure 5. Local concentration profiles of: ions (left y axis) and DMSO solvent (right y axis). DMSO—black solid line; Li+—magenta dotted line; PF6 −—green dashed line. Surface charges applied: (a) zero, (b) −4.85 μC ·cm−2, and (c) −9.7 μC ·cm−2. The insets show the visualization of ions and the negative electrode. Atom color code: graphene (gray), lithium (magenta), phosphorus (orange), and fluorine (green).
Download figure:
Standard image High-resolution imageIncreasing the charge to −9.7 μC·cm−2 (Figs. 4 and 5c), it is noticed in the gold electrode a decrease in the Li+ first peak to a smaller concentration and a thinner shape, a second and a third peaks are also formed, which corroborates the idea of a stronger interaction between solvent and Li+ when gold is used. On the other hand, in the graphene system, an increase in Li+ first peak concentration is observed, indicating a higher affinity of the cation with the electrode surface. For DMSO the first adsorbed layer concentration increases, as well as the formation of a third peak, is noticed for both scenarios. For all charges is possible to see PF6 − intercalated with Li+. It is worth mentioning that PF6 − achieves higher concentrations at the positive electrode. The insets of Figs. 4 and 5–5c show the distribution of the ions in each electric environment.
Experimental findings 55 of the oxygen reduction reaction in Li-air battery correlates electrolyte composition with reaction route. In the presence of DMSO solvent and gold electrode, the indirect pathway was observed. In this reaction path, the intermediate superoxide is formed in solution and it undergoes disproportionation to lithium peroxide at the surface. 55 Considering gold electrode subjected to higher charges, our calculations showed that Li+ distribution along the system is strongly attached to the DMSO peaks formation, indicating a connected dynamics of DMSO and Li+. Alongside this, the amount of Li+ approaching the electrode decreases with charge increasing which can help to understand the two steps reaction mechanism observed through experimental measurements. The formation of Li+ peaks at 6 and 11 Å, supplies a considerable amount of Li+ at the solution (where the disproportionation takes place) and at the surface (where the second reduction happens). Hence, contributing to a solution-mediated reaction which explains the increase in capacity per area when the experiments were performed with the gold electrode. 10 The reaction mechanism in carbon structures is driven by direct and indirect paths occurring in parallel which limits the surface availability to accommodate discharge products. 55 However, the battery capacity in this electrode material is considerably higher, 56 which can be a result of two main factors: the larger number of pores and overall area in this material 57 and the high concentration of Li+ adsorbed on the electrode surface (Fig. 3c). The combination of high Li+ mass flux and free space to store lithium oxidized species may contribute to higher capacities than those in other electrode materials.
In respect to solvents with different donor numbers (DN), considering the neutral graphene electrode scenario, we can see that in TEGDME (low DN) only one layer is adsorbed in the electrode surface (Fig. 6a). However, peaks formed in DMSO (high DN) and TEGDME present similar shapes (Figs. 5 and 6a). One we can infer that electrode material is a key factor in solvent behavior close to the electrode surface. Concerning Li+ and PF6 − a uniform distribution is observed. It is important to note that standard deviations in TEGDME are higher than in DMSO. On the other hand, errors associated with the interface region (bellow 7 Å) are lower than those for the bulk zone (Fig. S3). Applying a charge of −4.85 μC·cm−2 at the electrode we note that the TEGDME surface peak decomposes in a wider layer (Fig. 6b). The presence of a large Li+ peak is also observed. Increasing the charge to −9.7 μC·cm−2 (Fig. 6c) a sharper TEGDME and Li+ layers are seen, despite the different shapes of Li+ peaks, the overall concentration is almost constant with charge increase from −4.85 to −9.7 μC·cm−2. This behavior diverges from that observed for Li+ in DMSO/graphene composition.

Figure 6. Local concentration profiles of: ions (left y axis) and TEGDME solvent (right y axis). TEGDME—black solid line; Li+—magenta dotted line; PF6 −—green dashed line. Surface charges applied: (a) zero, (b) −4.85 μC·cm−2, and (c) −9.7 μC·cm−2. The insets show the visualization of ions and electrodes (left-negative and right-positive). Atom color code: graphene (gray), lithium (magenta), phosphorus (orange), and fluorine (green).
Download figure:
Standard image High-resolution imageThe transport of Li+ and O2 in high and low DN solvents is the main bottleneck for Li-air battery operation. The diffusivity of Li+ and O2 in TEGDME are in general two orders of magnitude lower than in DMSO. 4 Our simulations showed that the concentration of Li+ close to the surface in TEGDME is half of that in DMSO solvent. The experimental and simulation data evidence the limited supply of Li+ when TEGDME is the solvent. Furthermore, the lower diffusion of Li+ in TEGDME can contribute to the presence of concentration gradients in the electrolyte which decreases the flux of reactants in the electrode, jeopardizing the ORR rate. The indirect (solution) and direct (surface) reaction pathways are also a function of the solvent's DN. Experimental findings from Johnson et al. 16 highlighted that the earlier failure in battery operation with low DN solvents is related to the surface reaction route preference in this class of solvents which creates an insulating Li2O2 thin film over the conductive electrode surface. Based on our calculations this preference may also be due to mass transport limitations caused by the poor dynamics of Li+ in this media.
Apart from the dynamics of Li+ in those solvents, the Li+ solvation shell structure is also a key aspect to a deep understanding of the impact of solvent and electrode choice over the reaction mechanisms. It is important to say that despite the uncertainties in dynamics calculations for TEGDME, the model is robust enough to predict solvation shells with good precision. The dielectric constant for TEGDME based on the MD model is in excellent agreement with experimental measures (ε ∼ 8 for exp./sim. at 298 K). Allowing the utilization of MD calculations to infer information about Li+ solvation. The coordination number (nij ) was evaluated by the running integral of the radial distribution function (RDF—gij ) as shown in Eqs. 1 and 2. 58 For the RDF calculation, the data from atoms position were sampled into an interface layer with 10 Å of thickness.


where gij is the RDF between atoms types i and j, V is the volume, Ni and Nj are the numbers of i and j atoms, respectively, rij is the Euclidean distance between these atoms, δ equals 0 or 1 according to the absence or the presence of atoms within the analyzed shell, nij is the number of coordinated j atoms around i atom, and rmin is the cutoff distance to evaluate the coordination number. In the current study, the first minimum between the first two peaks in gij was established as the cutoff distance. Table II shows the calculated coordination numbers in each solvent/electrode system. According to the literature, 59 in a bulk system composed by LiPF6 in DMSO at 1 mol·kg−1 and 298 K, the Li+ solvation shell is composed of four molecules of DMSO. Based on this, we notice that the electrode presence close to the electrolyte decreases the capacity of DMSO to solvate Li+ in gold and graphene. Regarding the electric field, only the DMSO/graphene composition at the charge of −9.7 μC ·cm−2 seems to be affected. Comparing graphene and gold, we note a higher overall ability of DMSO to solvate Li+ in graphene.
Table II. Coordination number calculated from running integrals of the radial distribution functions of Li+ and O (from the solvent) a).
| Solvent | |||
|---|---|---|---|
| DMSO | DMSO | TEGDME | |
| Electrode | |||
| Charge μC ·cm−2 | Gold | Graphene | Graphene |
| 0.00 | 3.39 | 3.55 | 5.00 |
| −4.85 | 3.34 | 3.55 | 4.92 |
| −9.70 | 3.34 | 3.69 | 4.93 |
One hypothesis for the spurious behavior of the Li+ solvation shell in presence of a high electric field and graphene is the organization of DMSO close to the surface. To elucidate this hypothesis the calculation of the DMSO ordering parameter was evaluated by:

where θ is the angle between S-O bond and the surface normal to the electrode (z). The order parameter ranges from −0.5 to 1. A value of -0.5 means that S-O is parallel to the electrode (Fig. 7d), whereas 1 means S-O is perpendicular to the surface (Fig. 7e), and a value of 0 indicates a uniform distribution.
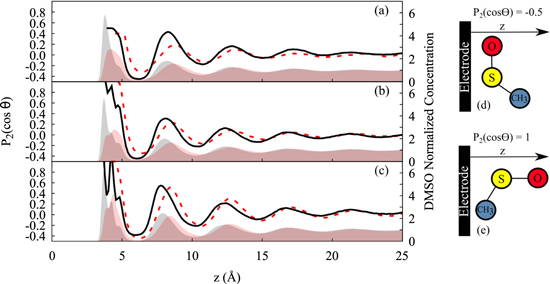
Figure 7. Order parameter ( ) for DMSO in gold (red dashed line) and graphene (black solid line) electrode systems subjected to different surface charges: (a) zero, (b) −4.85 μC·cm−2, (c) −9.7 μC·cm−2, (d) and (e) illustrate the DMSO orientation. The shaded area represents the solvent normalized concentration: DMSO in gold—red, DMSO in graphene—gray.
Download figure:
Standard image High-resolution imageFigure 7 presents the order parameter calculated for DMSO confined in gold and graphene electrode systems under different electric fields (a) at zero charge, (b) at −4.85 μC·cm−2, and (c) at −9.7 μC·cm−2. Figure 7 (a) indicates that DMSO has no preferential orientation, from which one we can infer that the sole presence of an uncharged wall is insufficient to impose any specific orientation arrangement of DMSO molecules. With imposing electric fields (Figs. 7b and 7c), however, some ordering of DMSO molecules close to the electrode is observed. Charging the surface with −4.85 μC·cm−2 and −9.7 μC·cm−2, the S-O vector predominantly points toward the electrolyte solution (perpendicular to the electrode surface). The DMSO orientation perpendicular to the electrode surface is mainly driven by Coulombic forces between solvent positive atoms and the electrified electrode. 27 Regarding the DMSO/graphene system the first layer shows a slight reordering at the charge of −4.85 μC·cm−2 which increases in magnitude at the charge of −9.7 μC·cm−2. This behavior may be a consequence of the shoulders presented in the concentration profiles (Figs. 5b and 5c). The changes in the first DMSO adsorbed layer in presence of an electric field may be the main reason to explain the increase of Li+ solvation by DMSO in graphene. On the other hand, in gold, the DMSO order unaffected the Li+ shell composition even increasing the surface charge what evidences the influence of the electrode nature.
Considering TEGDME with graphene electrode, as such in DMSO/gold system, the electric field was unable to change significantly the Li+ solvation structure as shown in Table I. Comparing TEGDME/graphene and DMSO/graphene systems, Li+ is solvated by five and three atoms of oxygen in TEGDME and DMSO, respectively. Figure 8 shows some snapshots of both solvation structures considering only the oxygens ((a) and (b)) and the molecules of solvent that are part of the solvation sphere ((c) and (d)).
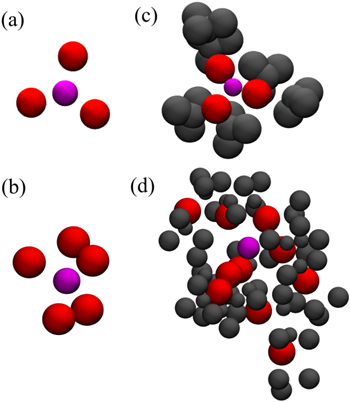
Figure 8. The solvation of Li+ by oxygens and molecules of the solvent: (a) Oxygens from DMSO, (b) Oxygens from TEGDME, (c) Three different DMSO molecules, and (d) Two different TEGDME molecules. Atom color code: lithium—magenta, oxygen—red, and others solvent atoms—gray.
Download figure:
Standard image High-resolution imageExperimental findings
20
show that the complex formed by [Li+(solvent)n
-O![${}_{2}^{-}]$](https://content.cld.iop.org/journals/1945-7111/169/3/030521/revision2/jesac59f6ieqn2.gif) is more stable in high DN solvents (such as DMSO) than in low DN solvents (like TEGDME). This means that in DMSO the high complex stability leads to a reversible oxygen reduction (O2/O2
−), whereas in TEGDME it reduces from O2 to
is more stable in high DN solvents (such as DMSO) than in low DN solvents (like TEGDME). This means that in DMSO the high complex stability leads to a reversible oxygen reduction (O2/O2
−), whereas in TEGDME it reduces from O2 to  .
20
Our calculations presented different solvation shells close to the electrode surface in DMSO and TEGDME solvents. A closer look at Table II and Fig. 8 shows the higher complexity of the Li+-TEGDME solvation structure in comparison to Li+-DMSO. Corroborating the idea of a reduced [Li+(solvent)n
-O
.
20
Our calculations presented different solvation shells close to the electrode surface in DMSO and TEGDME solvents. A closer look at Table II and Fig. 8 shows the higher complexity of the Li+-TEGDME solvation structure in comparison to Li+-DMSO. Corroborating the idea of a reduced [Li+(solvent)n
-O![${}_{2}^{-}]$](https://content.cld.iop.org/journals/1945-7111/169/3/030521/revision2/jesac59f6ieqn4.gif) stability in low DN solvents which may be caused by the clogged arrangement around the Li+ ion (Fig. 8d). Additionally, the TEGDME also creates a steric impediment for the approach of O2, thus the formation of LiO2
− (solution-mediated route) intermediate is hampered. One advantage of the Li+-TEGDME solvation structure is the protection of Li+ from suffering undesirable side reactions. It agrees with experimental observations where a small number of by-products were noticed after ORR using TEGDME as the solvent.
18
stability in low DN solvents which may be caused by the clogged arrangement around the Li+ ion (Fig. 8d). Additionally, the TEGDME also creates a steric impediment for the approach of O2, thus the formation of LiO2
− (solution-mediated route) intermediate is hampered. One advantage of the Li+-TEGDME solvation structure is the protection of Li+ from suffering undesirable side reactions. It agrees with experimental observations where a small number of by-products were noticed after ORR using TEGDME as the solvent.
18
In high DN solvents, a dominant presence of Li2O2 species is attributed to the high solubility of LiO2 intermediate. 16 This reaction route may be associated with the good diffusion of Li-DMSO4-O2 intermediate which may be a consequence of its smaller solvation shell volume, thus increasing the intermediate diffusion rate. 4 Regarding TEGDME, the reaction on the surface leads to premature cell failure. The formation of a thin Li2O2 layer at electrode surface 16 seems to be caused by the limited diffusion of the complex Li-TEGDME-O2 intermediate in solution which also reduces the diffusion of O2. 4 Furthermore, some experimental data shows that the high stability of the Li-TEGDME solvation sphere reduces the mobility of the Li+ in systems composed for this solvent. 60
An important benefit from using TEGDME solvent is the battery cycling performance, which can be explained by the large size of the Li+ solvation shell contributing to a slow disproportionation of LiO2 to Li2O2. 61 Additionally, the formation of fewer products as a consequence of the large Li+ shell and the higher stability of TEGDME in presence of an electric field leads to a good recovery of electrode increasing the round trip performance and life cycle. Whereas in DMSO the Li+ solvation shell propitiates parasitic reactions (especially when the O2 supply is not pure) and a large number of deposited products leading to a lower number of cycles and poor performance in the battery long-term run. 18
The ORR route in high DN solvents is also impacted by the electric double-layer (EDL) composition. 16 Thus, to simulate the electric potential distribution in the pore mimicking the battery discharge process, the Fixed Charge Method (FCM) was employed. Although the Constant Potential Method (CPM) is more precise when simulating interface behavior under electrical charge, the computational cost associated with its simulation is relatively high 62 . Moreover, Wang et al. 62 extensively compared both methods and they concluded that similar results can be obtained with both of them at low potentials (≤2 V). However, these authors claim that significant differences were noticed above 4 V. Li-O2 experiments are typically run at low potentials (<3 V 63,16 ) which enables the use of FCM to simulate this type of system. Furthermore, in our simulations the electrodes structure is flat. According to Vatamanu et al. 30 the FCM leads to good results on the simulation of flat electrodes. The EDL electrostatic potential was calculated by integrating the 1-D Poisson equation of the charge density along z-direction: 64

where ϕ is the electrostatic potential,  0 is the vacuum permittivity, and ρq
(z) is the charge density perpendicular to the electrode (z-cross section).
0 is the vacuum permittivity, and ρq
(z) is the charge density perpendicular to the electrode (z-cross section).
Figure 9 presents the potential profiles close to the negative electrode relative to the bulk potential, which was set to 0 V. The response of each system to the electric field resulted in different potentials, however, all of them are below the limit value where the fixed charge method gives reliable data (≤4 V). 62 The details of the charge density (ρq (z)) and the electric field (E(z)) profile are provided in Fig. S6, S7, and S8 of the Supporting Information.

Figure 9. Potential profiles near the left electrode (negative) increasing the charge density (the bulk was set to 0 V): (a) at DMSO solvent and gold electrode, (b) at DMSO solvent and graphene electrode, and (c) at TEGDME solvent and graphene electrode. (d) Voltage drop (ϕ − ϕz ) between electrode and electrolyte as a function of the electrode surface charge density (σ). Red square—DMSO solvent and gold electrode; blue circle—DMSO solvent and graphene electrode; black triangle—TEGDME solvent and graphene electrode.
Download figure:
Standard image High-resolution image
Figures 9–9c show the oscillatory potential across the EDL (≤15 Å) for gold/DMSO, graphene/DMSO, and graphene/TEGDME systems, respectively (the standard deviations are presented in Fig. S9 of the Supporting Information). The oscillation near the electrode surface is due to electrolyte/electrode Van der Waals interactions in the case of the uncharged electrode and Coulombic when the electrolyte is in contact with the charged electrode. Similar potential profiles are observed for systems where DMSO is the solvent regardless of the electrode material (Figs. 9a and 9b). Concerning TEGDME, higher potentials are noticed (Fig. 9c). These results indicate that solvent has a major role in the potential profile. Experimental data showed that either at low or high potentials the prevalence of surface reaction pathway is observed in low DN solvents. 16 The simulated profiles show higher variations in the EDL region bellow 10 Å in TEGDME (Fig. 9c) compared to those in DMSO (Figs. 9a and 9b). The oscillations in the TEGDME system may lead to a specific composition of products which can limit the oxygen diffusion through this media. It may be a hypothesis to explain why the surface pathway is independent of the battery discharge potential in low DN solvents.
From results of electrostatic potential profiles, we calculated the voltage drop variation (ϕ − ϕz ) as a function of surface charge (σ), considering neutral surface as the reference (the potential of zero charges or PZC (ϕz )). Figure 9e displays the voltage drop as a function of surface charge density. The PZC for DMSO/gold, DMSO/graphene, and TEGDME/graphene is 0.29 V, 0.27 V, and 0.44 V, respectively. These results express the higher affinity of the surface with positively charged atoms of solvents and with Li+. As comparison, the PZC of LiPF6 in carbonated solvents using graphene electrode ranges from −0.28 to −0.10 V. 46,65,66 The analogous potential drop of DMSO systems corroborates the idea that electrostatic potential is only impacted by solvent characteristics.
The results showed in Fig. 9e were fitted to Equation 5 to obtain the differential capacitance of the electrical double layer formed at the interface:

where CEDL is differential capacitance, σ is the surface charge density, and (ϕ − ϕz ) is the voltage drop.
Even though the capacitance is a measure of the storage capacity of the EDL in a non-Faradaic system and the Li-air battery presenting redox reactions, the analysis of EDL capacitance without considering the redox reactions may still enhance the understanding of impedance caused by the electrolyte at the electrode surface. 66,28 The results of capacitance are presented in Table III. Similar capacitance is observed for DMSO in gold electrode and graphene electrode systems. The slight difference noticed between them can be explained by DMSO reordering in graphene (Fig. 7c). TEGDME system presents the lower capacitance, indicating that the electrode surface is overcrowded and saturated by the solvent. As a comparison for LiPF6 in composition with EC/DMC in graphite electrode, the CEDL ranges from 4–7 μF·cm−2. 65,66
Table III. The differential capacitance of each electrical double layer a)).
| Solvent | ||
|---|---|---|
| DMSO | DMSO | TEGDME |
| Electrode | ||
| Gold | Graphene | Graphene |
| CEDL (μ F ·cm −2) | ||
| 3.41 | 3.74 | 2.57 |
Conclusions
Molecular dynamics simulations were used to investigate the behavior of the electrode/electrolyte interface of three systems subjected to different surface charge densities. The studied electrode/electrolyte pairs were: gold electrode with LiPF6 in DMSO, graphene electrode with LiPF6 in DMSO, and graphene electrode with LiPF6 in TEGDME. All electrolyte solutions are 1 mol·kg−1 for the salt. From the interfacial electrolyte structure concerning the surface charge, we evaluated the local molecule/ion number density distributions, the Li+ solvation shell and its relation with DMSO ordering, the voltage drop across the system, and the electrical double layer capacitance.
Taken together, our theoretical data implies that DMSO and Li+ local concentration distributions at the interface depend not only from the applied potential but also on the electrode material. The Li+ solvation shell, in the case of DMSO, is mainly influenced by the electrode type. Furthermore, it is better solvated in graphene which in turn is related to DMSO ordering and concentration profile in the first adsorbed peak. These findings give molecular details that contribute to understanding experimental data related to the good cyclability of DMSO-gold batteries as well as to the higher capacities observed for DMSO-carbon-based devices. When TEGDME was the solvent, a more complex Li+ solvation shell was seen. Moreover, a high shield effect over the electrode was noticed, characterized by the low capacitance of the electrical double layer. Contributing to elucidate the experimental stability and long life cycle of TEGDME-based batteries.
These findings suggest that in general, the electrode material plays a significant role in the dynamics of solvents and Li+ ions as well as in the formation of the Li+ solvation sphere. Moreover, the presence of the electric field impacts the solvent orientation and the electrical double layer formation. The comparison of our results with experimental data from the literature for Li-air systems shows that a deeper understanding of interfacial structures at the molecular level may provide auxiliary information to elucidate the oxygen reduction reaction pathways and system behavior thus helping to elucidate the discharging process of typical Li-air cells.
Thus, the results obtained using a classical force field were able to improve the understanding of the molecular phenomena on those devices. Even knowing the limitations of classical force fields to perform electrochemical simulations. Moreover, the absence of an actual Faradaic reaction simulation is due to restrictions from the used tools and the actual scope of the study. A further analysis employing more complex tools with the ab-initio type of simulations may contribute to a deeper comprehension of the reactions occurring during battery operation.
Acknowledgments
The authors gratefully acknowledge Dr. Edward J. Maginn for the availability of the computational resources from the Center for Research Computing (CRC) at the University of Notre Dame. We thank the Brazilian agencies CNPq (Reference Number 203 393/2018-0) and CAPES (Finance Code 001) for financial support. This work was also supported by FAPESP grant 2017/11958-1, and Shell, and the strategic importance of the support given by ANP (Brazil's National Oil, Natural Gas, and Biofuels Agency) through the R&D levy regulations. We also thank Dr. Luís F. M. Franco, Dr. Yong Zhang, and Dr. Edward J. Maginn for fruitful discussions which collaborate for the development of this work.