
Abstract
The electrochemical reaction mechanism on the electrode surface for the activation of Cu electrodeposition in a sulfate-based Cu plating solution containing poly ethylene glycol (PEG) and supercritical CO2 (Sc-CO2) was studied by hydrodynamic voltammetry experiments and electrochemical impedance spectroscopy performed using a rotating disk electrode system specially designed for high pressure environment. The experimental results demonstrated that the mixed Sc-CO2 had a significant inhibitory effect on Cu electrodeposition. In addition, a kinetics model was attempted to be constructed for the Sc-CO2 mixed system based on the conventional model for the system with suppressor. As a result, the same mechanism as in the conventional model can be used to explain the Sc-CO2 mixed system, Sc-CO2 micelles in the solution were suggested to adsorb on the electrode surface in the same manner as the PEG molecules, which affected the reaction mechanism and was expected to inhibit the reduction reaction of Cu ions. Furthermore, the mixed Sc-CO2 was presumed to reduce the transition coefficient by suppressing the reduction reaction of Cu2+ ions to the Cu+ complex by adsorption on the electrode surface.

This is an open access article distributed under the terms of the Creative Commons Attribution 4.0 License (CC BY, http://creativecommons.org/licenses/by/4.0/), which permits unrestricted reuse of the work in any medium, provided the original work is properly cited.
Cu electrodeposition has been used in the electronics industry for printed circuit wiring processes. In recent years, it has also become an important deposition technology in the back end of line (BEOL) process for semiconductor wafers in LSI manufacturing and in the through-silicon via (TSV) manufacturing process used for inter-chip wiring in 3D LSI chip stack. 1,2 In these applications, Cu electrodeposition plating baths with mixtures of organic and inorganic additives are used to provide uniform deposition rates, surface planarization of deposits, and bottom-up deposition of TSVs. 3–7 Especially, organic additives, such as poly ethylene glycol (PEG), could couple with chloride ions in the solution to adsorb on the electrode surface and inhibit the reduction reaction of Cu ions. Furthermore, these mechanisms are used in many cases and reports on electrodeposition, because the amount of adsorption is affected by the condition of the electrode surface, and as a result, the rate of deposition is changed according to the shape of the electrode surface. 8–15 In contrast, supercritical CO2 (Sc-CO2) emulsion plating, in which Sc-CO2 is mixed with a plating solution and emulsified after addition of organic additives, is reported to realize not only the effects of the above-mentioned additives but also various functions that have not been available to the conventional plating process. 16–27
Supercritical CO2, which has a critical point at a temperature of 31.2 °C and a pressure of 7.38 MPa, has the unique properties of zero surface tension, high density like a liquid, and low viscosity close to that of a gas. It is difficult to use supercritical CO2 as a plating solution because CO2 cannot dissolve metal salts due to its low polarity, and supercritical CO2 itself does not dissolve in water. Sone et al. have proposed that multifunctional metal electrodeposition is possible by using a plating solution in which supercritical CO2 is dispersed and emulsified in an plating solution containing metal ions and surfactants. 16–27 For example, this method can form a dense metal film by refining the grain size of the resulting deposit, making it less prone to defects such as pinholes. 20,21 Furthermore, it has been experimentally explained that this method improves throwing power and leveling and can form voidless embedded films in a fine concave region. 23–26
The properties of supercritical fluids are also expected to change the lower dynamic viscosity of the solution, which is closely associated with ion transport. To elucidate the electrochemical reaction details in supercritical fluids, we have developed a rotating disk electrode in high pressure and suggested that Sc-CO2 emulsion plating can reduce the kinematic viscosity of the plating solution and increase the diffusion constant of Cu ions, resulting in a drastic improvement of ion transport. 27 Thus, the effect of Sc-CO2 on the ion transport process has been elucidated. However, the effect on the activation mechanism at the electrode surface is still not well clarified. In this report, we will attempt to construct a kinetic model and study the reaction mechanism of Cu electrodeposition on the electrode surface in a plating solution mixed with Sc-CO2 based on the results acquired from voltammetry and electrochemical impedance spectroscopy (EIS) with controlled hydrodynamic steady-state conditions by a rotating disk electrode (RDE).
Experimental
Electrochemical measuring apparatus
In this report, we discuss the electrodeposition reaction mechanism on the electrode surface on the premise that the measurement system is maintained in a steady state. It is necessary to maintain the temperature, pressure, ion supply state in solution, and potential during the measurement to be constant to ensure a steady state of the reaction system. In strictly meaning, it is a pseudo-steady state in which the potential is changed slowly over time or the potential change is limited to a small amount. In this experiment, RDE that can operate under high pressure was utilized in order to maintain the ion supply state in the solution mixed with Sc-CO2 hydrodynamically constant.
Figure 1 shows an overall schematic diagram of the electrochemical measuring apparatus for Sc-CO2 mixed electrodeposition used in the experiment. Considering the critical point of CO2, the design specification pressure and temperature of the whole measurement system were 15 MPa and 50 °C, respectively. Since the pressure of the CO2 cylinder is about 6 MPa at room temperature, it was maintained above the critical point by means of a booster pump and a thermostatic device that could heat the entire system. A magnetic coupling type rotation introducing terminal was installed in a pressure vessel that has an internal volume of 1.85 l, and a Cu disk of 20 mm in diameter embedded in a poly ether ether ketone (PEEK) material was attached to the tip of the terminal as a working electrode (W. E.). The rotation speed was controlled by a servomotor installed outside the pressure vessel. In addition, a counter electrode (C. E.) composed of Ti whose surface was coated with IrO2 was placed at a position facing the W.E. with a distance of 10 mm. Though it was desirable to use a saturated calomel electrode (SCE) or Ag/AgCl electrode with excellent potential reproducibility and accuracy for the reference electrode, in this work, because the difficulties in using them under high pressure, a reference electrode consist of the same material as the counter electrode, which has high corrosion resistance, was applied. The potential of this electrode to the plating solution in the next section was relatively noble, 0.5 V vs SCE at 50 °C, which is associated with the redox reaction of Ir. It should be noted that the discussion that follows is based on the relative potential difference to the rest potential, not the absolute potential.
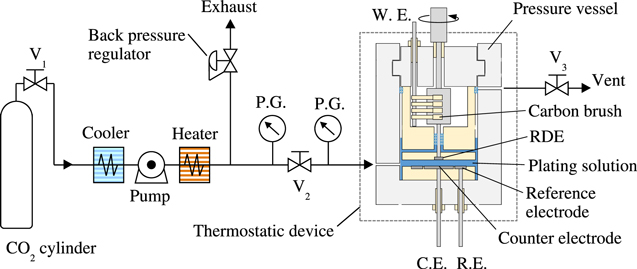
Figure 1. Schematic diagram of the electrochemical measurement apparatus used for the experiment. V and P.G. indicate a valve and a pressure gauge, respectively.
Download figure:
Standard image High-resolution imageReagents
For electrochemical measurements, a relatively concentrated CuSO4 solution, which could minimized influences from mass transfer, was purposely prepared to obtain the current response related to the activation reaction on the electrode. An aqueous solution containing CuSO4: 1.0 mol l−1, H2SO4: 0.5 mol l−1, chloride ion Cl−: 60 mg l−1, and polyethylene glycol (PEG) (1000 MW): 2–100 μmol l−1 was used as the test solution. All reagents were products of Kanto Chemical Co., Inc., and CuSO4·5H2O and PEG were of special grade, and the others were of EL grade of purity. For mixing Sc-CO2 with this solution, the solution obtained by subtracting the target Sc-CO2 ratio from the internal volume of the pressure vessel was injected into the pressure vessel, and then pressurized with CO2. For example, in order to set the mixing ratio of Sc-CO2 to 10 vol. %, 1.67 l of solution, which is 90 vol. % of 1.85 l, was injected into the pressure vessel. In this experiment, 10, 30, and 50 vol. % were mainly used as the Sc-CO2 ratio. Although PEG is different from a surfactant, it is soluble in both CO2 and water, so in a system consisting of CO2 and water, it has the same effect of reducing interfacial tension as a surfactant, 28 so no surfactant was specifically added to emulsify Sc-CO2.
Electrochemical measurement
Prior to the electrochemical measurement, Sc-CO2 was mixed with the solution and stabilized. For mixing Sc-CO2 with the test solution, the valve connected to the CO2 cylinder was opened, the entire system was replaced with CO2 gas, and then the pressure inside the pressure vessel was raised to 10 MPa by the boost pump. In this situation, CO2 in the vessel heated to 50 °C reached the supercritical state, and Sc-CO2 micelles were dispersed in the solution to form an emulsion by rotating the RDE to agitate the solution. Furthermore, before the measurement, it was confirmed that the pressure and temperature in the pressure vessel and rotation speed of the rotating electrode were constant and stable.
Voltammetry experiments were conducted as follows. At first, the working electrode (W. E.), counter electrode (C. E.) and reference electrode (R. E.) presented in Fig. 1 were connected to each terminal of a potentiostat (VSP-300, Bio-Logic Sciences Instruments), and W. E. was maintained at the natural potential for a certain period of time. Subsequently, the potential was swept from the natural potential to −0.25 V at a sweep rate of −2 mV s−1, which was slow enough to maintain a pseudo-steady state, and the current flowing into the working electrode was recorded at intervals of 100 ms. Furthermore, in order to suppress the influence of fluctuations that occur at the contact points between the RDE rotation axis and the carbon brush, a moving average of 20 points of the sampled current value data were taken depending on the situation.
EIS experiments were conducted using a potentiostat with a built-in computer-controlled frequency response analyzer (VSP-300, Bio-Logic Sciences Instruments) at a constant potential applied voltage of −0.1 V, and its perturbation amplitude was 10 mV. In addition, its frequency was swept from the high frequency side of 100 kHz to the low frequency side of 50 mHz. In addition to the magnitude and phase of the impedance, the real (Zre) and imaginary (Zim) components of the impedance that enable the Nyquist plot were recorded as the impedance characteristics for the frequency obtained by the EIS measurement.
Results and Discussion
Polarization characteristics
Figure 2 shows the hydrodynamic voltammograms measured with PEG concentration as a parameter. This figure typically shows the results when the RDE rotation speed is at 100 rpm. Figure 2a shows the voltammograms of the plating solution at atmospheric pressure where supercritical CO2 is not mixed. Figures 2b–2d show voltammograms with a pressure of 10 MPa and CO2 concentrations in the solution of 10 vol. %, 30 vol. %, and 50 vol. %, respectively. Note that the horizontal axis represents the deviation from the natural potential measured before potential sweeping. Further, the negative current density indicates that the working electrode is the cathode into which the current flows.
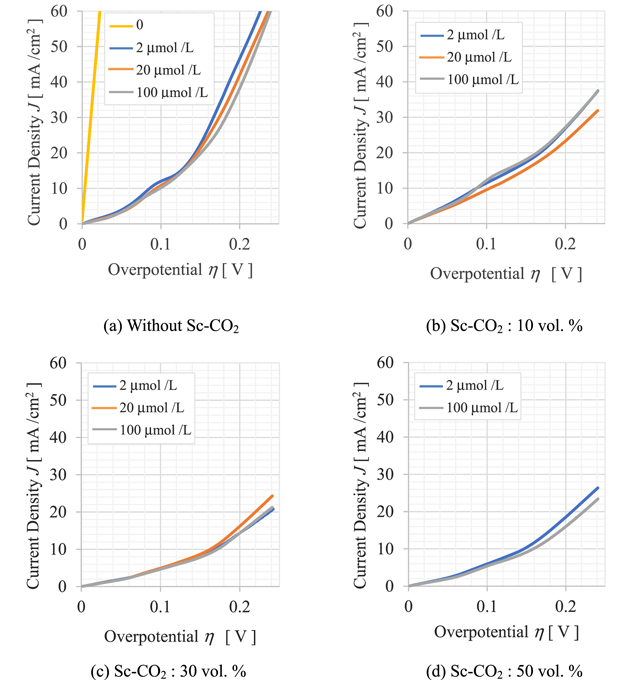
Figure 2. Hydrodynamic voltamograms measured at an RDE rotation speed of 100 rpm with PEG concentration as a parameter. (a) Sc-CO2 is not mixed, (b)–(d) Sc-CO2 is mixed.
Download figure:
Standard image High-resolution imageAs shown in Fig. 2a, when the CO2 concentration is 0, the polarization curve changes with the PEG concentration. As the concentration increases, the current density flowing into the working electrode decreases overall, and the polarization resistance, expressed as the reciprocal of the slope of the curve, increases overall. In the experiment, it was also confirmed that the polarization curve changed depending on the rotation speed of the RDE, and the polarization resistance increased as the rotation speed increased. These results suggest that PEG acts as a suppressor of Cu electrodeposition and its supply to the electrode surface is the diffusion-limited.
On the other hand, as shown in Fig. 2b, when 10 vol. % Sc-CO2 was mixed with the test solution, the gradient of the polarization curve became smaller and the polarization resistance increased at any PEG concentration compared to Fig. 2a. The change in the gradient of the polarization curve with respect to the PEG concentration was small, and there was no dependence on the RDE rotation speed within the experimental conditions. When the Sc-CO2 concentration was increased to 30 vol. %, the gradient of the polarization curve became even smaller and the overall current density flowing into the working electrode decreased, as shown in Fig. 2c. The concentration of SC-CO2 was further increased to 50 vol. %, but as shown in Fig. 2d, the polarization curve was almost the same as that in Fig. 2c. PEG is a suppressor in Cu electrodeposition, while Sc-CO2 in solution will provide additional suppressors in addition to the effects of PEG.
In the voltammogram shown in Fig. 2, it should be noted that the potential includes the iR drop due to the bulk resistance of the plating solution. In particular, it is expected that the bulk resistance increases due to the mixing of Sc-CO2, so the relationship between CO2 concentration and polarization resistance should be corrected. Figure 3 shows a hydrodynamic voltammogram with iR drop corrected using the bulk solution resistance obtained from the results of the EIS experiment described later. The dashed line in the figure shows the Tafel curve fitted to each measurement data. Where, these Tafel curves were fitted as follows. All the voltammograms in Fig. 3 are classified into three potential regions based on the rate of change of current density against overvoltage. The low potential region below 0.05 V is a non-Tafel region where the current density is proportional to the overvoltage. On the other hand, Tafel approximation was possible in the range of 0.05–0.14 V and 0.14–0.2 V, and the correlation coefficients of the approximated Tafel curves to the measured values were high (>0.9) in both cases. However, since the correlation coefficient of the approximate curve approximated in the region of 0.14–0.2 V is more than 0.99, the Tafel curve approximated in this region is considered to be more appropriate. As shown in Fig. 3, while the gradient of the polarization curve slightly increased due to the iR correction, the decrease in this gradient due to the mixing of Sc-CO2, that is the increase in polarization resistance, is obvious.
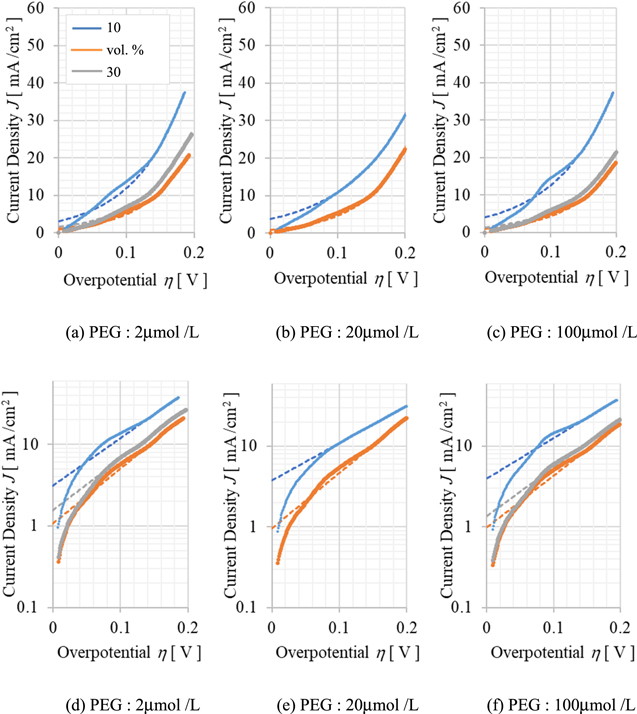
Figure 3. Hydrodynamic voltamograms measured at an RDE rotation speed of 100 rpm with the Sc-CO2 concentration as a parameter. The iR drop due to solution resistance was corrected using the resistance values identified by EIS measurements. The dashed lines in the figure show the fitted tafel curves. The vertical axes in (a)–(c) in the figures are in normal notation, while (d)–(e) are in exponential notation.
Download figure:
Standard image High-resolution imageWhen the volume ratio of Sc-CO2 mixed in the plating solution is 50% or less, Sc-CO2 micelles could be dispersed in the aqueous phase of the plating solution. These micelles could repletely adsorb and desorb from the surface of the electrode or deposits, and can inhibit the electrodeposition of metals. 21 In other words, the increase in polarization resistance that accompanies the increase in CO2 concentration is assumed to be due to the adsorption/desorption of these micelles on the electrode surface. It is thought that the reason why the change in polarization resistance is not seen when the CO2 concentration is 30 vol. % or higher is that the average coverage of the electrode surface by micelles is saturated at this concentration region.
Figure 4 shows the Sc-CO2 concentration dependence of the transition coefficient and exchange current density obtained from the Tafel curve in Fig. 3. The Tafel curve is expressed by the following equation.

where, i0, α, and F are the exchange current density, the transition coefficient, and the Faraday constant, respectively. Figure 4a shows the transfer coefficient when Sc-CO2 was not mixed is 0.45–0.50, which is in good agreement with previous reports about the electrodeposition from an aqueous solution of copper sulfate, in which the transfer coefficient takes a value near 0.5. 10,29 In contrast, when Sc-CO2 was mixed, the transfer coefficient decreased into a value of 0.32–0.40. The transition coefficient is a parameter that indicates the degree of contribution of the overpotential to the charge transfer process, and a smaller transition coefficient means that the reduction reaction is more difficult to occur because the decrease in the energy barrier to the applied potential is smaller. This phenomenon is a characteristic feature of Sc-CO2 mixing.

Figure 4. Sc-CO2 concentration dependence of charge transfer coefficient and exchange current density obtained from tafel curve in Fig. 3 with PEG concentration as a parameter.
Download figure:
Standard image High-resolution imageFigure 4b shows the exchange current density was significantly reduced by the addition of PEG when Sc-CO2 was not mixed. Assuming that the exchange current density in the absence of PEG and Sc-CO2 was 100%, the addition of PEG 100 μmol l−1 resulted in about 0.8%. Kelly et al. reported the effect of PEG addition in copper sulfate plating solutions and concluded that in the presence of chloride ions, PEG molecules adsorb on the electrode surface and block surface sites available for charge transfer. 9,10 On the other hand, the exchange current density when 10 vol. % of Sc-CO2 was mixed at 100 μmol l−1 of PEG was 1.9% as compared with the case without PEG, and decreased to less than 0.6% when 30 vol.% was mixed.
EIS analysis
Figure 5 shows Nyquist plots measured by the EIS method as a parameter of the PEG concentration. These EIS spectra were measured with the rotation speed of the RDE at 100 rpm. Figures 5a and 5b show Nyquist plots of the test solution at atmospheric pressure where Sc-CO2 is not mixed. Figures 5c–5e show Nyquist plots with a pressure of 10 MPa and Sc-CO2 concentrations in the solution of 10 vol. %, 30 vol. %, and 50 vol. %, respectively. The horizontal and vertical axes of these figures show the real and imaginary parts of the measured impedance Z, respectively. As shown in Fig. 5, the resulting spectra have two continuous capacitive loops in the high frequency range and the low frequency range starting from a certain real part. The capacitive loop on the complex plane shows that the capacitive and resistive components are connected in parallel. Therefore, these spectra mean that the two reactions represented by the capacitive and resistive components are connected. In the case where metal ions are reduced to metal through reaction intermediates by sequential reactions, the reaction intermediates are adsorbed on the electrode surface and their adsorption state is modulated depending on the applied potential, resulting in another impedance, i.e., Faraday impedance trace, as the modulation becomes a time constant. Consequently, the two capacitive loops, as shown in Fig. 5, suggest that a fast reaction with a small time constant and a slow reaction with a large time constant, such as Faraday impedance, are occurring simultaneously. This behavior was observed whether on the presence of Sc-CO2 or absence, and also when the Sc-CO2 concentration varies. These two loops in Cu electrodeposition containing PEG and Cl− have already been investigated in detail by other researchers. 10,15 That is, one capacitive loop is associated with the reduction of Cu2+ complexes to Cu+ complexes by charge transfer reactions, represented by Eq. 2, and the other loop is associated with the formation of Cu atoms on the Cu surface by the reaction of adsorbed Cu+ complexes with electrons, represented by Eq. 3.


Figure 5. Nyquist plots measured at RDE rotation speed of 100 rpm with PEG concentration as a parameter. (a) PEG and Sc-CO2 are not mixed, (a) Sc-CO2 is not mixed, (b)–(d) Sc-CO2 is mixed.
Download figure:
Standard image High-resolution imageAs shown in Figs. 5a and 5b, when Sc-CO2 was not mixed, the diameter of the capacitive loop was an extremely small value of 0.1 Ω cm2 or less in solutions without PEG; in solutions with PEG, it was 5–6 Ω cm2. As shown in Figs. 5c–5e, when Sc-CO2 is mixed with the test solution, the diameter of the loop becomes smaller once the CO2 concentration is 10 vol. %. As the CO2 concentration increases to 30 vol. %, the diameter of the loop also increases, and the change tends to be smaller at higher concentrations. These trends were the same for both the high and low frequency capacitive loops. Here, the starting point of the capacitive loop on the high frequency side indicates the bulk resistance Rsol of the test solution, and the ending point of the loop on the low frequency side indicates the sum of the resistance components that contribute to the total reaction. Therefore, since the sum of the diameters of the two loops corresponds to the polarization resistance, the polarization resistance could also increase as the Sc-CO2 concentration increases. This is also consistent with the behavior of the polarization characteristics shown in Fig. 3.
It is useful for understanding the reaction mechanism to estimate the equivalent circuit of the electrode reaction from the EIS spectrum. Figure 6 is the results obtained by fitting and deriving each element value of the equivalent circuit for the measured EIS spectrum, using the case of PEG concentration of 2.0 μmol l−1 and Sc-CO2 concentration of 50 vol. %. Figure 6a shows the measured Nyquist plot and the fitted results, and (b) shows the estimated equivalent circuit and the values of each element. The values of each element were identified for other EIS spectra in the same way. In particular, the capacitive loops in Fig. 5 deviate from a perfect circle and draw a collapsed trajectory in the direction of the real number axis. Thus, in the equivalent circuit, instead of capacitance, it is represented by CPE (Constant Phase Element) as shown below.

where, ZCPE is the impedance of CPE, ω is the angular frequency, p is the CPE index, and Q is the CPE constant. For the parallel circuit of CPE and resistor only, assuming that the top of the collapsed loop is determined by the time constant RC, the apparent capacitance C' can be obtained as follows.


Figure 6. The equivalent circuit and the value of each element obtained by fitting to the measured Nyquist plot. In this figure, as an example, a case where the PEG concentration is 2 μmol l−1 and the Sc-CO2 concentration is 50 vol. % is shown.
Download figure:
Standard image High-resolution imageFigure 7 shows a graph of the resistance components R1, R2, and R3 of the equivalent circuit and the capacitance components C'1 and C'2 plotted against the Sc-CO2 concentration, obtained by fitting from the Nyquist plot of PEG concentration 100 μmol l−1 in Fig. 5. As for the primary physical quantities, R1 R2, and C'1 represent the bulk resistance of the solution, the charge transfer resistance, and the double layer capacitance, respectively. R3 and C'2 correspond to the resistive and capacitive components associated with the Faraday impedance. As shown in Fig. 7a, the bulk resistance R1 of the solution increased with the increase in Sc-CO2 concentration, and at concentrations of 30 vol. % or higher, it increased three times compared to the case without Sc-CO2. This is thought to be due to the Sc-CO2 micelles dispersed in the solution being the cause of the increased resistance, as already reported. 16,17 These obtained resistance values were used for potential correction by the iR drop in Fig. 3. On the other hand, the charge transfer resistance R2 decreased once by mixing Sc-CO2, but increased significantly at 30 vol. % or more. R2 + R3 corresponds to the polarization resistance that is inversely proportional to the exchange current density, and thus is obviously in agreement with the changes of Sc-CO2 concentration with the behavior of the exchange current density shown in Fig. 4b.

Figure 7. Sc-CO2 concentration dependence of each element value obtained by applying the spectrum of Fig. 5 to the equivalent circuit shown in Fig. 6. In this figure, as an example, a case where RDE rotation speed of 100 rpm with PEG concentration of 100 μmol l−1.
Download figure:
Standard image High-resolution imageAs mentioned above, PEG molecules adsorb on the electrode surface and block the surface sites for charge transfer. The above results suggest that, in addition to PEG, the mixing with Sc-CO2 not only increases the solution resistance but also adsorbs on the electrode surface like PEG, reducing the effective electrode surface area and consequently suppressing Cu deposition. As shown in Fig. 7b, the double layer capacity C'1 decreases slightly with increasing Sc-CO2 concentration and becomes about 1/5 at 50 vol.%. This result clearly exhibits that the Sc-CO2 emulsion adsorbed on the electrode surface reduces the effective electrode surface area, similar to the above. In contrast, C'2 is about four orders of magnitude larger than C'1. This phenomenon can be attributed to the fact that C'1 is the double layer capacitance consisting of the polymer-containing Cl−-Cu+-PEG complex and hydrated Cu2+ ions, whereas C'2 corresponds to the capacitance formed between the Cl−-Cu+-PEG complex layer directly adsorbed on the electrode surface and the electrode.
Formulation of electrodeposition with Sc-CO2
Based on the results of the electrochemical measurement described in the previous section, a kinetic formulation of the Cu electrodeposition reaction with Sc-CO2 was considered. More specifically, kinetic modeling was attempted in a system with a mixture of Sc-CO2, assuming that Sc-CO2 suppresses electrodeposition by the same mechanism as the model in a system with a conventional inhibitor. The theoretical calculation was performed as follows. It is known that the reduction reaction process of Cu ions on an electrode in Cu electrodeposition does not combine Cu2+ ions and two electrons at one time, but goes through the processes of the above Eqs. 2 and 3.
Ki, which correspond to the kinetic expression of the molar rates shown in Eqs. 2 and 3, are respectively given as a function of the electrode potential Ei as follows.


where ki, bi and cCu are the rate constant, the activation coefficient (i. e. tafel coefficient) and Cu ion concentration on electrode surface respectively. E0 is arbitrarily selected with respect to the origin potential. Further, the current flowing and the balance of Cu ions on the electrode surface by the sequential reaction represented by the Eqs. 2 and 3 are given by


where θCu is the coverage of the electrode surface of Cu+(ad), and θ' is the coverage of the PEG molecules, Sc-CO2 or a mixture thereof. There is relationship of 0 ≦ θCu + θ' ≦ 1 between θCu and θ'. β is the maximal surface concentration of Cu atoms (5.9 × 10⁻⁸ mol cm−2). Since dθ/dt = 0 in the steady state, the steady state coverage Θ is given by

By Taylor-expanding both sides of Eqs. 8 and 9 and substituting Eq. 10,


The theoretical voltage-current characteristics of the electrodeposition reaction expressed in Eqs. 2 and 3 are obtained from Eqs. 8 and 10, and the impedance Z of the electrode at any potential is obtained by synthesizing the Faraday impedance ZF obtained from Eqs. 10 and 11–16, the double layer capacitance Cdl, and the bulk resistance Rsol of the solution. Figure 8 shows a steady-state voltammograms calculated using these equations, and Fig. 9 shows the Nyquist plots of electrode impedance. Though these results vary greatly depending on the selection of parameters, they were adjusted appropriately to fit the experimental results. Those determined parameters are shown in Table I.

Figure 8. Comparison of calculated steady-state voltammograms and experimental data. The open circle represents the experimental data, and the dashed line represents the calculated results. (a) Sc-CO2 is not mixed, (b) Sc-CO2 is mixed and the PEG concentration is 100 μmol l−1.
Download figure:
Standard image High-resolution image
Figure 9. Comparison of calculated Nyquist plots and experimental data. The open circle represents the experimental data, and the dashed line represents the calculated results. In this figure, a case where the PEG concentration is 100 μmol l−1 and RDE rotation speed is 100 rpm is shown. (a) Sc-CO2 concentration is 10 vol. %, (b) Sc-CO2 concentration is 30 vol. %.
Download figure:
Standard image High-resolution image
Table I. Parameters used in the theoretical calculations of the voltammogram and Nyquist plot.
| Parameter | Without Sc-CO2 (1 atm) | With Sc-CO2 (10 MPa) | |
|---|---|---|---|
| Activation coefficient | b1 [V−1] | 16.5 | 12.1 |
| b2 [V−1] | 34.0 | 34.0 | |
| Rate constant | k1 [cm s−1] | 1.1 × 10⁻⁸ | 5.5 × 10⁻⁷ |
| k2 [mol cm−2 s−1] | 1.0 × 10⁻⁶ | 1.0 × 10⁻¹⁶ |
Figure 8a shows the case where only PEG was added under atmospheric pressure. In Fig. 8a, first, the calculation parameters were obtained by fitting with the measurement data under the condition that the coverage Θ' by PEG was set to 0 in the case where PEG is absence. Then, for the case of PEG presence, Θ' for any given PEG concentration was determined by fitting these to the experimental results. As a result, as shown in Fig. 8a, Θ' = 0.99 is suitable when 100 μmol l−1 of PEG is added in this study. These results can also be interpreted in the same way as the results of other experimental studies on conventional PEG-only added.
Figure 8b shows the case where 10 and 30 vol.% of Sc-CO2 was mixed with the solution with PEG of 100 μmol l−1 under high pressure of 10 MPa. Although the same results can be expected for the case where Sc-CO2 is mixed, the parameters obtained above cannot be applied as is because a change in the transition coefficient is observed for the case of no Sc-CO2 mixing under atmospheric pressure. Therefore, the activation coefficient bi and the rate coefficient ki, which particularly affect the transition coefficient, were again determined by fitting them with an arbitrary Θ' greater than 0.99. As a result, as shown in Table I, the curves approximated the measured data with lower values of b1 and k2 and higher values of k1 compared to the case without mixing Sc-CO2. In particular, the decrease in b1 suggests that the reason for the decrease in the transition coefficient when Sc-CO2 is mixed is because of the difficulty in the reduction reaction of the elementary process expressed in Eq. 2. This is expected to be because the adsorption of Sc-CO2 micelles on Cl− and PEG on the substrate surface inhibits the access of Cu2+ ions in the solution, resulting in difficulty in the formation of the Cl−-Cu+-PEG complex. The estimated model suggests that the decrease in the double layer capacity C'1 due to Sc-CO2 mixing is partly due to the increase in the thickness of the double layer as well as the decrease in the electrode area due to the adsorption of Sc-CO2 micelles as described above. Comparing the calculated curve with the measured data to obtain Θ', the values of Θ' for 10 and 30 vol. % Sc-CO2 were 0.992 and 0.997, respectively, as shown in Fig. 8b. In other words, the suppression of electrodeposition by the Sc-CO2 mixture can be explained by the fact that the Sc-CO2 micelles cover the electrode surface and prevent Cu2+ ions from approaching the electrode, similar to PEG. Note that the coverage Θ' when Sc-CO2 is mixed in this estimation is the total coverage by both PEG and Sc-CO2, and each the coverage cannot be separated.
Figures 9a and 9b are Nyquist plots of electrode impedance for solutions containing 100 μmol l−1 PEG mixed with 10 and 30 vol. % Sc-CO2, respectively. The calculated values were fitted to the measured data by adjusting the rate constant ki, the double layer capacitance Cdl, and the bulk resistance of the solution Rsol, with Θ' = 0.992 in Fig. 9a and Θ' = 0.997 in (b). As a result, regardless of the concentration of Sc-CO2, there are two capacitive loops in the calculated results as well as the measured data, and especially the real axial diameter of the loop in the high frequency region corresponding to the charge transfer resistance R2 almost reproduces the measured one. On the other hand, for the imaginary axis, the calculated results showed larger values than the measured data. This deviation can be explained by the CPE device characteristics which show a collapsed capacitance loop in the imaginary axial direction due to the capacitance dispersion associated with the surface condition of the electrodes. 30 Where, Cdl was about one order of magnitude smaller than the measured value C'1, which was 1 × 10⁻⁵ F cm−2 for 10 vol. % Sc-CO2 concentration and 3 × 10⁻⁶ F cm−2 for 30 vol. %. The reason for the above is considered to be that C'1 is larger than the original capacitance value due to the larger roughness of the actual electrode surface and the conversion error from the CPE parameters caused by the difference between the ideal and actual surface conditions.
Conclusions
The reaction mechanism of Cu electrodeposition on the electrode surface when Sc-CO2 is mixed with a sulfate-based plating solution was studied based on the electrochemical measurement results using the hydrodynamic voltammetry and EIS method. It was confirmed that Sc-CO2 mixed in the plating solution suppressed the deposition by reduction of Cu ions as well as PEG. In addition, a kinetic model was constructed and the calculated results were compared with the measured one. As a result, it was found that the suppression mechanism of Cu deposition with Sc-CO2 can be explained by the limitation of the effective electrode area by the electrode surface coverage as in the case of PEG. It was also estimated that Sc-CO2 decreases the transition coefficient by inhibiting the reduction of Cu2+ ions in solution to Cu+ complexes on the electrode. Electrodeposition mechanism of Sc-CO2 mixed with the plating solution obtained in this study can be used for simulating the shape transition of the electrodeposits, which will be useful for the applications of Sc-CO2 mixed plating in the future.
Acknowledgments
This work was supported by the Grant-in-Aid for Scientific Research (B) (JSPS KAKENHI Grant number 21H01668).