
Abstract
Carbon nanotube yarn microelectrodes (CNTYMEs) have micron-scale surface crevices that momentarily trap molecules. CNTYMEs improve selectivity among cationic catecholamines because secondary reactions are enhanced, but no anions have been studied. Here, we compared fast-scan cyclic voltammetry (FSCV) of dopamine and anionic interferents 3,4 dihydroxyphenylacetic acid (DOPAC) and L-ascorbic acid (AA) at CNTYMEs and carbon fiber microelectrodes (CFMEs). At CFMEs, dopamine current decreases with increasing FSCV repetition frequency at pH 7.4, whereas DOPAC and AA have increasing currents with increasing frequency, because of less repulsion at the negative holding potential. Both DOPAC and AA have side reactions after being oxidized, which are enhanced by trapping. At pH 4, the current increases for DOPAC and AA because they are not repelled. In addition, AA has a different oxidation pathway at pH 4, and an extra peak in the CV is enhanced by trapping effects at CNTYMEs. At pH 8.5, co-detection of dopamine in the presence of DOPAC and AA is enhanced at 100 Hz frequency because of differences in secondary peaks. Thus, the trapping effects at CNTYMEs affects anions differently than cations and secondary peaks can be used to identify dopamine in mixture of AA and DOPAC with FSCV.
Export citation and abstract BibTeX RIS

This is an open access article distributed under the terms of the Creative Commons Attribution Non-Commercial No Derivatives 4.0 License (CC BY-NC-ND, http://creativecommons.org/licenses/by-nc-nd/4.0/), which permits non-commercial reuse, distribution, and reproduction in any medium, provided the original work is not changed in any way and is properly cited. For permission for commercial reuse, please email: permissions@ioppublishing.org.
Initial experiments to probe dopamine in the brain encountered ascorbic acid and 3,4-dihydroxyphenylacetic acid (DOPAC) as interferents, and thus discrimination of dopamine, ascorbic acid, and DOPAC is an old question in electrochemistry. 1,2 Dopamine (DA) is associated with the reward system in the brain and the decreased level of dopamine results in motor symptoms resembling Parkinson's disease. 3–5 Ascorbic acid is an antioxidant that combats oxidative stress, is present in high concentrations in the brain (over 200 μM), and has a similar oxidation potential to dopamine. 6,7 DOPAC is a major metabolite of dopamine that has a similar structure to dopamine, and therefore similar electrochemistry, and can build up to higher concentrations in the extracellular space. 1 Substantial efforts have been devoted to discriminate dopamine in the presence of AA and DOPAC using differential pulse voltammetry (DPV) by showing slight potential shifts in the voltammograms with different electrode materials. 8,9 However, the measurements with DPV take several minutes, which is not suitable for tracking rapid neurotransmitter release. Fast-scan cyclic voltammetry (FSCV) is used for rapid neurotransmitter measurements with subsecond temporal resolution, 10 and it is often paired with Nafion-coated carbon-fiber microelectrodes (CFMEs) to repel the anions DOPAC and ascorbic acid from the electrode surface. 11–13 Recently, Mao's group developed laccase/multi-walled carbon nanotube-based biosensors for selective determination of dopamine in the presence of ascorbic acid and DOPAC. 14 However, coatings slow the time response, and new approaches to manipulate selectivity without coatings would be welcome.
Carbon nanotube-yarn microelectrodes (CNTYMEs) are a potential alternative to conventional carbon fiber microelectrodes with unique electrochemical properties due to the micron-sized surface roughness, which leads to thin layer electrochemistry with FSCV. 15 They have improved sensitivity and electron transfer kinetics for neurotransmitter detection. 16–20 Our previous study demonstrated that CNTYMEs trap compounds in the crevices of CNT forests, leading to thin layer cell-like electrochemical behavior. 15,16,21 Unlike CFMEs, which experience a dramatic signal loss at high repetition frequencies in FSCV, the trapping effect of CNTYMEs result in high signals for catecholamine neurotransmitters at high repetition frequencies. Thus, the temporal resolution is higher than CFMEs. 18,21,22 In addition, the secondary oxidation peak, due to cyclization of the reduced species, is enhanced at CNTYMEs. 21 These peaks are not typically observed at CFMEs, because they would diffuse away from the surface, but in a structure that promotes trapping, they are easily detected. Epinephrine is the easiest compound to be cyclized among three catecholamines and has a much larger secondary peak current at CNTYMEs, which increases in intensity with increasing FSCV repetition frequency. The different CV shapes enable the selective determination of catecholamines. The trapping effect of CNTYMEs are improved when the surface is treated with an anti-static gun or laser to increase the surface roughness. 17,23 Thus, CNTYMEs have trapping effects that lead to unique electrochemistry, improving sensitivity and selectivity, but the trapping effect has only been studied for cationic catecholamines.
The goal of this study was to understand how trapping effects at CNTYMEs influence the electrochemistry of anions and the extent to which secondary peaks could be exploited to improve selectivity. With a FSCV waveform that holds at a negative voltage, the adsorption of cationic dopamine is favored at low frequencies but with the trapping effect at CNTYMEs, the current decays less for dopamine with increasing frequencies. The effects are opposite for anions, where the signal increases with frequency at CFMEs because of repulsion during the holding potential. Current decreases with frequency for AA at CNTYMEs due to the continuous consumption of trapped products in the irreversible electrochemistry. CV shapes change with pH, which facilitates dopamine determination in the presence of DOPAC or ascorbic acid with FSCV. These experiments show that trapping effects, as well as electrostatic effects, play a large role in the detection of anions and facilitate designing conditions for identifying dopamine with interference of other neurochemicals.
Experimental
Electrode fabrication
CFMEs were fabricated by inserting a single T650 carbon fiber into a glass capillary (0.68 mm ID × 1.2 mm OD), and were then pulled to form a sharp tip with fiber exposed. The exposed fiber was then cut to be 100 μm, and sealed with Epoxy Resin 828 (Miller-Stephenson, Danbury, CT). The insulated electrodes were left overnight, and then were placed in 100 °C oven for 2 h and then 150 °C for 12 h to cure.
CNTYMEs are disk electrodes made with commercial carbon nanotube yarns with diameter of 50 μm (Nanoworld Lab, Department of Chemical and Environmental Engineering, University of Cincinnati). A glass capillary was pulled by a glass puller (model PE-21, Narishige, Tokyo, Japan) to form a cylinder tip, which was then cut to form an open-tip with diameter of approximately 70 μm. A piece of yarn with 2 cm length was soaked in isopropanol, and inserted into the glass capillary from the open tip carefully during soaking. With the assistance of surface tension, the CNT yarn was placed at the glass tip without structure deformation. After insulation with Epon epoxy Resin 828, the electrode was then polished to a 45° angle with a fine diamond abrasive plate (Sutter Instruments model BV-10, Novato, CA). The polishing process for an electrode was control to be less than 3 min and the electrode was then soaked in isopropanol to remove surface impurities. The whole structure of the disk electrode is shown in Fig. S1 (available online at stacks.iop.org/JES/169/026506/mmedia).
Electrochemical methods
Dopamine hydrochloride, L-ascorbic acid and 3,4-Dihydroxyphenylacetic acid (DOPAC) were purchased from Sigma-Aldrich (St. Louis, MO). Compounds were dissolved in 0.1 M HClO4 to make 10 mM stock solution, and were diluted with PBS buffer (131.25 mM NaCl, 3.00 mM KCl, 10 mM NaH2PO4, 1.2 mM MgCl2, 2.0 mM Na2SO4, and 1.2 mM CaCl2) to corresponding concentration (dopamine 1 μM, DOPAC 20 μM and L-ascorbic acid 20 μM). Solutions were further adjusted to different pH (pH 4, pH 7.4 and pH 8.5) for FSCV detection.
Fast-scan cyclic voltammetry was performed in a flow cell with dual syringe pump pumping buffer and dopamine into a cell with a six-port switching valve (Valco Instruments Co. Inc. Houston, TX). The potentiostat was a Dagan with a 10 MΩ headstage (Dagan, Minnesota). Electrodes were filled with KCl solution to be connected to Ag/AgCl reference electrode, and dopamine waveform (−0.4 V to 1.3 V at a scan rate of 400 V/s from frequencies from 10 Hz to 100 Hz) was applied. The data was analyzed with HDCV software developed at University of North Carolina, Chapel Hill.
Surface characterization
SEM images (spot size 2, accelerating voltage 2 kV) of CFMEs and CNTYMEs was performed on ZEISS Merlin High- Resolution Scanning electron microscope (Oberkochen, Germany), provided by Center for Nanophase Materials Science (CNMS), Oak Ridge National Laboratory.
Simulation of electrostatic effect
The simulations of electrostatic effects with analytes with different charges were performed in COMSOL Multiphysics (Burlington, MA). The 2D model of CFMEs was simplified as a line segment, since CFMEs are cylinder electrodes with little surface structure. The model of CNTYMEs was composed of dense CNT arrays standing vertically to show surface roughness of a disk electrode. Further details can be found in support information (Fig. S2). "Electrostatics" and "Transport of Diluted Species" modules were coupled to simulate mass transport and analyte migration in an electric field.
Results and Discussion
Surface characterization
Figure 1 shows SEM images of the electrodes used in this study: a cylindrical CFME (Fig. 1A) with a diameter of 7 μm and a disk CNTYME (Fig. 1B) using a 50 μm diameter CNT yarn., which was made by twisting long CNT arrays into bundles. 19,24 The CFME has smooth striations on the surface, whereas the CNTYME has micron-depth surface roughness with twisted CNT bundles. 19,24 After polishing, a CNT forest is formed of vertically aligned CNT arrays, and crevices are observed between the CNT bundles.
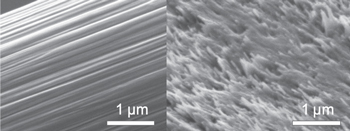
Figure 1. SEM image of (A) CFME and (B) CNTYME.
Download figure:
Standard image High-resolution imageDopamine, ascorbic acid, and DOPAC CVs obtained at CFMEs and CNTYMEs
First, we studied CFMEs by comparing dopamine, DOPAC, and ascorbic acid at different FSCV repetition frequencies. For FSCV flow cell experiments, we run buffer past the electrode for 5 s, then analyte for 5 s, and finally switch back to buffer for 5 s. The CVs shown are collected at the end of the analyte injection, approximately the 50th CV at 10 Hz, and the 500th CV at 100 Hz. Figure 2A shows the CVs of dopamine at 10 Hz and 100 Hz. Dopamine is reversibly oxidized to dopamine-o-quinone (DOQ) via two-electron transfer (Scheme
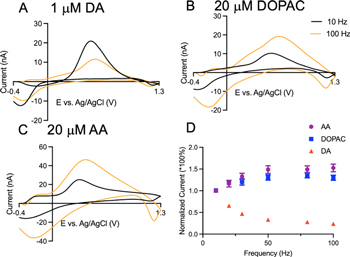
Figure 2. Cyclic voltammograms at CFMEs of (A) 1 μM dopamine, (B) 20 μM DOPAC and (C) 20 μM ascorbic acid at 10 Hz and 100 Hz. (D) Normalized current trends of three analytes with FSCV repetition frequencies from 10 Hz to 100 Hz. n = 5 electrodes, error bars SEM.
Download figure:
Standard image High-resolution image
Scheme 1. Redox pathways of (A) dopamine, (B) DOPAC and (C) ascorbic acid at physiological condition at pH 7.4, and (D) ascorbic acid at pH 8.5.
Download figure:
Standard image High-resolution imageNext, the repetition frequency experiment was performed at CNTYMEs. The primary oxidation current for dopamine (Fig. 3A) at 0.6 V is only slightly smaller at 100 Hz than 10 Hz, and the secondary peak current increases with frequency. DOPAC (Fig. 3B) has a similar CV shape to dopamine, and similar trends, with a small drop in primary peak current (at 0.6 V) and an increase in secondary peak current (at around 0 V) at 100 Hz. Ascorbic acid (Fig. 3C) has an oxidation peak at approximately 0.5 V, and the signal drops dramatically for the 100 Hz repetition frequency. Both DOPAC and ascorbic acid have a peak current at the switching potential 1.3 V, which may be due to changes in the background current after increased adsorption of compounds with more oxide groups. 27 Secondary oxidation peaks of dopamine and DOPAC that appear at a lower potential are enhanced at CNTYMEs and are easier to distinguish at 100 Hz than at CFMEs.

Figure 3. Cyclic voltammograms at CNTYMEs of (A) dopamine, (B) DOPAC and (C) ascorbic acid at 10 Hz and 100 Hz. (D) Normalized primary peak current trends of three analytes with frequencies ranging from 10 Hz to 100 Hz. n = 5 electrodes, error bars SEM.
Download figure:
Standard image High-resolution imageFigure 3D shows that ascorbic acid has a large decrease in primary oxidation current with frequency at CNTYMEs but that the current declines only slightly for DOPAC and dopamine. This pattern is a contrast to CFMEs, where dopamine decreased with FSCV repetition frequency but AA and DOPAC did not. Given the possibility of ascorbic acid fouling, the response at different frequencies was tested for AA, then the electrode was exposed to AA for 25 cycles, and the current responses at different frequencies tested again. Figure S3 shows the currents did not drop after 25 cycles, which indicates that no fouling happens during AA redox cycling at CNTYMEs. The decreasing currents for AA at the CNTYME at high repetition frequencies may be due to restricted diffusion, as the solution may not easily reach into the crevices with rapid repetition frequencies. In contrast, DOPAC redox is adsorption controlled so it has a less current drop and may be less susceptible to effects of restricted diffusion. AA is a diffusion-controlled process and the oxidation is irreversible and products are consumed in the following hydration reaction, whereas DOPAC with a quasi-reversible redox mechanism that partially recycles the primary product back to DA. Thus, restricted diffusion and irreversibility may cause the larger current drop for AA than for DOPAC.
Electrostatic and trapping effects lead to different current responses
To understand the electrostatic effects for different charged molecules, a model of the electric field was built with COMSOL Multiphysics; details can be found in the supporting information. In Fig. 4, an electrode (white rectangle representing half CFME) was placed in an electrochemical cell with zero potential. When applying a potential of −0.4 V to the electrode, an electric field was generated around the microelectrode, as shown in Fig. 4A. Then electroactive species were introduced to the system from the bulk solution on the right side. To simply show the effect of migration in the analyte movements, convection was not considered in the model. The concentration is 1 μM everywhere in the electrochemical cell when there is no migration (arrows represent the solution flux in the electrochemical system). Figure 4C shows the concentration profile of a cationic species, which not only diffuses but also migrates to the electrode. The positively charged molecule is attracted by the negative holding potential applied at the electrode by electrostatic forces; thus, concentrations of cations are enriched near the electrode surface. Figure 4D is the concentration of an anionic species, and the concentration near the electrode is smaller because anions are repelled by the negative potential applied to the electrode. With an opposite direction of migration due to repulsion, fewer molecules approach to the electrode surface so the amount that undergo redox reactions is less. In the real experiment, a flow injection system will introduce convection with molecules continuously flowing to the electrode.
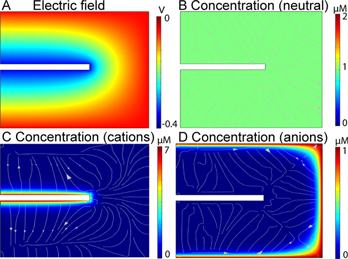
Figure 4. (A) Simulated electric field with CNTYMEs in an electrochemical system at a holding potential of −0.4 V. The concentration profiles of (B) neutral molecules, (C) cations and (D) anions. Red is a high concentration (bulk concentration was 1 μM) and blue is a low concentration. Analyte movements was driven by diffusion and migration in the electric field. The half 2D model of electrode was 50 μm* 6 μm, so the black electrode in the figure is 25 μm long. D = 10−9 m2/s, Cbulk = 1 μM, charge of species zc = +1, za = −1.
Download figure:
Standard image High-resolution imageThe concentration of anions was 20 μM instead of 1 μM, so the real concentration near the electrode is larger than the results in the model. In this study, dopamine (pKa = 9.27) is cationic, whereas DOPAC (pKa = 4.25) and ascorbic acid (pKa = 4.2) are anionic at physiological pH 7.4. 27,45 Thus, dopamine is present at a higher concentration on the surface (such as Fig. 4C), while DOPAC and ascorbic acid are at lower concentrations at the electrode surface (such as Fig. 4D). The electrostatic effect explains the different current trends of dopamine, DOPAC, and ascorbic acid with increasing frequencies. At 10 Hz, the holding time at −0.4 V between each cycle is 91.5 ms, and the time dramatically decreases when repetition frequency increases. With less time at negative potential, there is less attraction of dopamine to the electrode, so the current goes down as the result at CFMEs shows (Fig. 2A). But for DOPAC and ascorbic acid that are repelled by the electrode at holding potential, the shorter time is less time for repulsion, so the current trends higher (Figs. 2C, 2D).
The electrostatic effect is the same at both CFMEs and CNTYMEs, and both electrodes show fast time responses of three compounds based on the current vs time plots (Fig. S4), however, the frequency effects are different at CNTYMEs (Fig. 3D). Dopamine has less primary current decay at CNTYMEs (Fig. 3D) than at CFMEs (Fig. 2D) and DOPAC has a slight decrease at CNTYMEs. AA decreases with frequency at CNTYMEs in contrast to its increasing trend at CFMEs. The reason for the different current response at CNTYMEs is due to the trapping effect introduced by the creviced surface structure as shown in SEM image (Fig. 1B). At CNTYMEs, the crevices on the surface with micron depth act as many thin layer cells that trap molecules in the CNT forests, limiting diffusion on the FSCV time scale.
21,29
Thus, cations such as dopamine are trapped near the surface and can be readily detected after redox cycling at high repetition frequencies. Anions will be repelled by electrostatic forces, but those that are at the surface will also be trapped in the crevices and consumed in the redox reactions. The current for ascorbic acid decreases with frequency at CNTYMEs because it is an irreversible redox reaction (Scheme
At CFMEs only one oxidation peak is typically present for FSCV detection at 10 Hz, but additional peaks can be detected at CNTYMEs, especially at high repetition frequencies (Figs. 2 and 3). For DA and DOPAC, these extra peaks are attributed to the cyclization reactions following an ECE (electron transfer-chemical-electron transfer) mechanism as shown in Scheme
At CNTYMEs, secondary oxidation peaks are enhanced (Fig. 3), because the cyclization products that are made in the crevices are trapped in the crevices on the FSCV time scale and therefore are detected electrochemically. 21 At 100 Hz, there is even less time for molecules to escape (1.5 ms between scans), leading to further enhancement. In addition, there is an increasing number of reactions in a unit time at high frequencies, and more primary products are consumed since the cyclization reaction is irreversible. With 10 times more reactions at 100 Hz, there are more secondary products accumulated in the crevices, thus the secondary peak currents are higher. The different CV responses of CFMEs and CNTYMEs caused by the different surface structure facilitates the discrimination of analytes by different secondary peaks, but it is not enough to provide selectivity among three analytes with FSCV.
pH changes reaction mechanisms and cyclic voltammogram shapes
For in vivo studies, detection of neurochemicals is performed at physiological pH (7.4), but the redox mechanisms are pH dependent and worth understanding for detection ex vivo. Figure 5 shows dopamine, DOPAC, and AA detection at CFMEs at pH 4 and 8.5. For all three molecules, reduction peaks are right shifted in acid and left shifted in base, because the reactions are pH dependent, and more protons in solution favors reduction, while fewer protons favors oxidation. 34,2 Dopamine (pKa = 9.27) is a cation at both pH 4 and 8.5 and is attracted by the electrode at a negative holding potential, so the current is frequency dependent. DOPAC (pKa = 4.25) is cationic at pH 4, so it has a larger current due to migration to the surface, but the current decays at 100 Hz. However, at pH 8.5 DOPAC is an anion that is normally repelled by the electrode at the holding potential, so the overall current is much smaller (due to differences in migration) but the current increases with repetition frequency as there is less time at negative potentials. Ascorbic acid has a pKa of 4.2, and it is positively charged at pH 4, so it has a larger current due to migration and a signal that decays with repetition frequency. Dopamine and DOPAC have enhanced secondary peaks at acidic pH, that become more apparent at 100 Hz. The normalized trends in Figs. 5G, 5H show different electrostatic effect of three analytes at acidic or basic conditions. Cationic dopamine has decreasing currents at both pH values, whereas the currents for DOPAC and AA decrease with frequency at pH 4 but increase at pH 8.5.

Figure 5. CFMEs at different pH. Left column is CVs at pH 4, and right column is at pH 8.5.Cyclic voltammogram comparisons of (A) and (B) 1 μM dopamine, (C) and (D) 20 μM DOPAC and (E) and (F) 20 μM ascorbic acid at 10 Hz and 100 Hz. G, H) Normalized trends of primary peak currents with frequency.
Download figure:
Standard image High-resolution imageFigure 6 shows CVs from CNTYMEs for dopamine, DOPAC, and AA at acidic and basic pH. Similar to CFMEs, even in CNTYMEs, the peaks shift due to the pH dependence of the reactions, as the reduction peaks are right shifted in acid and left shifted in base. For dopamine (Figs. 6A–6B), the primary peak currents at CNTYMEs are smaller at 100 Hz, and secondary peaks are enhanced at both pH values. DOPAC has the same peak positions as dopamine, but a high current at 1.3 V at CNTYMEs because of the background current change introduced by the adsorption of molecules. Secondary peak currents for DOPAC are enhanced at both pH values, especially at pH 4, where the secondary peak dominates at 100 Hz. Secondary peak currents for both dopamine and DOPAC are larger at pH 8.5 than at pH 7.4, because nitrogen and oxygen in the chains become more nucleophilic and cyclization reactions are more facile. 35,36 At pH 4, AA has primary current decreasing at 100 Hz, and secondary peaks are seen in the cyclic voltammogram. At pH 8.5, the primary peak has nearly disappeared at 100 Hz, and only a secondary reaction is observed. The normalized trends of three analytes at CNTYMEs (Figs. 6G, 6H) are mostly the same as those at CFMEs (Figs. 5G, 5H), but the decreasing trends are flatter. However, AA has dramatically decreasing currents at pH 8.5 which is opposite that at CFMEs.
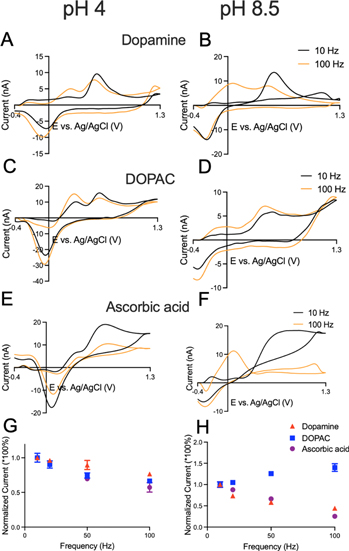
Figure 6. Cyclic voltammograms of at CNTYMEs. Left column is CVs at pH 4, and right column is at pH 8.5. (A) and (B) 1 μM dopamine, C & D) 20 μM DOPAC and (E) and (F) 20 μM ascorbic acid at 10 Hz (black line) and 100 Hz (orange line). G, H) Normalized trends of primary peak currents with frequency.
Download figure:
Standard image High-resolution imageAscorbic acid is interesting because it has a different redox mechanism at different pH values (Scheme
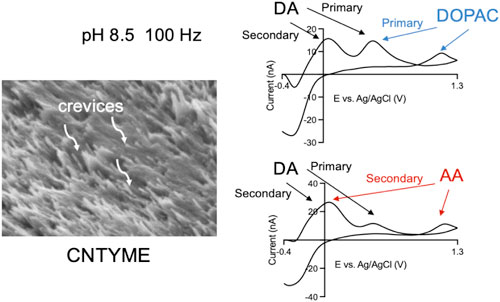
Selective dopamine detection with interference of DOPAC and L-ascorbic acid at CNTYMEs
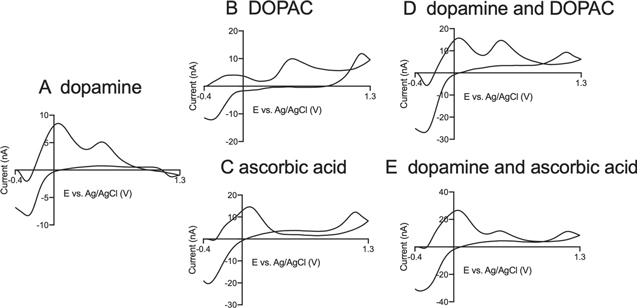
Multiple analyte detection is difficult in FSCV due to the extremely fast voltage ramp that leads to peak broadening or overlapping when analytes have similar formal potentials. Codetection experiments are most often performed with conventional cyclic voltammetry or differential pulse voltammetry, because peak separation is easier at slower scan or step rates. 8,38 Here, our strategy is to use secondary peaks at different pH values to identify dopamine in the mixture solutions. Figure 7 plots CVs of three analytes at CNTYMEs and mixtures solutions at pH 8.5, 100 Hz. In this condition, dopamine (Fig. 7A) has a favored cyclization reaction while DOPAC (Fig. 7B) has similar peak potentials, but a much smaller secondary peak, as well as an extra wave at the switching potential. At pH 8.5, ascorbic acid (Fig. 7C) has a very large secondary peak at 0.1 V as well as a peak at the switching potential, but little primary peak because the product is used up. Figure 7D is a CV obtained in solutions of 1 μM dopamine with 20 μM DOPAC and the while the primary peak is a combination of dopamine and DOPAC, the large secondary peak is attributed to dopamine. The additional peak at switching potential also indicates the existence of DOPAC in the mixture solution. Figure 7E is a CV of 1 μM dopamine with 20 μM ascorbic acid and the primary peak at 0.6 V is evidence of dopamine, while ascorbic acid is identified by the peak at 1.3 V. Thus, at CNYMEs, we can identify the components of the mixture solution, although quantitation might be difficult. To achieve that goal, we would need machine learning 39 or principle component analysis 40 for accurate quantification.
Figure 7. Codetection of dopamine, DOPAC, and ascorbic acid at CNTYMEs at pH 8.5. (A) CVs of pristine 1 μM dopamine, (B) CV of 20 μM DOPAC, and (C) CV of 20 μM ascorbic acid. (D). Mixture of 1 μM dopamine and 20 μM DOPAC. (E). Mixture of 1 μM dopamine and 20 μM AA All the cyclic voltammograms were obtained at 100 Hz, pH 8.5.
Download figure:
Standard image High-resolution image
The codetection of dopamine with DOPAC and ascorbic acid at pH 8.5 indicates the good selectivity of CNTYMEs by showing distinctive CV shapes without losing sensitivity. While animal and brain slice experiments are conducted at physiological pH 7.4, 41,42 ex vivo studies, such as electrochemical detection of neurotransmitters after HPLC separation are not limited to physiological pH. 9 This study shows that manipulating the pH can amplify secondary peaks that are trapped by CNTYMEs, which could be an important tool for tuning selectivity when primary peaks overlap. Thus, the trapping nature of the surface structure at CNTYMEs allows redox reactions to be observed that are not typically detected and these insights are useful for assay development in FSCV.
Conclusions
CNTYMEs are a good alternative to CFMEs, exhibiting a high sensitivity and temporal resolution. With the trapping effect introduced by the thin layer structures on the surface of CNTYMEs, neurotransmitters can be determined by the different CV shapes of dopamine, DOPAC, and ascorbic acid, which provides a better selectivity than CFMEs. Trapping effect at CNTYMEs also allows the detection of secondary oxidation products that would usually diffuse away from the surface. Secondary peak currents are also enhanced at higher repetition frequencies when more reactions occur. Ascorbic acid has pH dependent redox mechanisms, and side reactions are observed clearly with trapping effect amplifying secondary peak currents. At a more basic pH of 8.5, dopamine, DOPAC and ascorbic acid have unique CV shapes at 100 Hz, which enables the determination of dopamine with co-existence of interferences at CNTYMEs. Trapping in the thin layer cell enables the dopamine determination with the presence of DOPAC and AA. Any one of the neurochemicals can be discriminated with the presence of other interference if the proper condition was applied to CNTYMEs.
Acknowledgments
This work was funded by the Owens Family Foundation and the National Institutes of Health: NIH R01EB026497 and NIH R01MH085159. The SEM images of carbon electrodes were conducted at the Center for Nanophase Materials Sciences, which is a DOE Office of Science User Facility. The authors declare no competing financial interest.