
Abstract
Temperature dependence studies of electrochemical parameters provide insight into electron transfer processes. In cases where adding excess electrolyte causes experimental complications, e.g., colloidal systems, organic or biological samples, it is preferable to deal with the high resistivity of the medium. We validate the use of unsupported and weakly-supported solutions in thermoelectrochemical experiments. The temperature dependence of the diffusion coefficient allows calibration of the steady-state current to measure changes when a continuous-wave (CW) ultraviolet laser, λ = 325 nm, illuminates an ultramicroelectrode (UME) from the front. Calibrating the steady-state current ratios, before and after heating with a thermostatic bath, allows temperature measurements within an accuracy of 0.6 K. The solutions are without supporting electrolytes in methanol, a volatile solvent, and we use a model that accurately describes the viscosity and temperature dependence of the solvent. We calculated the temperature and derived an equation to estimate the error in the temperature measurement. A numeric method yields satisfactory results, considering the changes for both diffusion coefficients and viscosity explicitly, and predicts the thermostatic temperature bath, agreeing with the theoretical model's error. In unsupported solutions, the ferrocene diffusion coefficient and the iodide apparent diffusion coefficient follow the expected increase with temperature. Under CW laser illumination, the UME temperature increase is: ΔT = 4 ± 1 K.
Export citation and abstract BibTeX RIS
The study of the solid/liquid interface includes the use of electrochemical methods under illumination, such as in photoelectrochemistry and spectroelectrochemistry. While spectroscopic information complements the electrochemical measurement, 1,2 light sources can heat the electrode surface, which could have a significant effect on electron transfer rates. Indeed, some reports leverage the heating effects to induce temperature jumps to determine kinetic 3 and thermodynamic parameters. 4,5 Our group is interested in accounting for temperature changes for ultramicroelectrodes (UME) under constant illumination. In our previous work, we have investigated single entities under illumination to measure the stochastic photoelectrochemical currents from nanoparticles (NPs) suspended. 6–11 Other studies include single entity photoeletrochemistry of NPs with an emphasis on electron transport properties across a porous TiO2 film. 12,13 In addition, Mirkin et al., have studied two new types of photoelectrochemical nano-impacts in aqueous solutions. The first case involves a TiO2 NP decorated with Pt. The second case is the collisions of IrOx NPs on the surface of a semiconductor electrode (Nb-doped n-type TiO2 crystalline phase (110) rutile single crystal). The primary reaction of interest is water photooxidation. 14 However, in the single entity work, which relies on UMEs, the effect of heating sources on illuminated electrode surfaces has been considered negligible. Here, we estimate the change in temperature on a UME/solution interface when a continuous-wave UV laser illuminates the surface. To the best of our knowledge, this is the first report of unsupported solutions and the effect of temperature on diffusion coefficients in these unsupported systems. In our case, our first aim is to report single entity kinetic constants in unsupported solvents. Our group is interested in an unsupported medium to avoid cross contamination from other hole scavengers coming from the supporting electrolyte. Moreover, under the usual conditions in supported systems, there is a large excess of a strong electrolyte. This may not be possible in biological samples, because the effect of high ionic strength. Also, when studying newly synthesized organic compounds, removing supporting electrolyte may not be straight forward. Finally, in colloidal systems, the high ionic strength could cause nanoparticle aggregation and precipitation, which our group seeks to avoid in single entity experiments.
Early work on laser-induced temperature jumps goes back to Smalley, Feldberg, and co-workers. 3 The authors heated electrodes to increase the local temperature and measure electron transfer rate constants for fast redox couples. The authors estimated temperature jumps of the order of 4 K with a 590 nm, 250 mJ laser, 0.35 μs pulse width. 3 Before the temperature jump measurements, Berg developed the technique of photo-polarography. 15 In time, the light sources included lasers to study the electrode/electrolyte interface, 16–18 such as double-layer relaxation effects. 19 More recently, work with the laser-induced temperature jump method included thermodynamic studies of the solid-liquid interface using single-crystal electrodes. 4,5 The authors calculated increments at the interfacial temperature of up to 40 K within 50 ns using sub-microsecond lasers, i.e., short pulses with high energies. 5
Among the previous studies of temperature and current on a UME are the reports from Compton et al., using microwaves to heat UMEs 20 to enhance the stripping of Cd 21 and electrodehalogenation. 22 Baranski and his group heated UMEs with an AC current. 23,24 Boika applied AC heating to design "hot tips," that is, scanning electrochemical microscopy (SECM) tips that took advantage of locally heating the solution in the tip-sample gap to increase mass transport rates. 25,26 Pan et al. 27 used an SECM tip to measure the dissolution of a heated Cu substrate by Br2 generated at the tip. Finally, Rodriguez-Lopez and his group used SECM to measure local temperature effects in the tip-sample gap for samples modified with plasmonic Au NPs. They found temperature increments of up to 40 K. 28 Meng et al. studied the effect of electroactivity on a boron-doped diamond under laser heating 29 and Yu et al., measured temperature increase near plasmonic samples. 30
This paper measures the temperature increment on a UME under illumination by a continuous-wave laser in the UV region of the electromagnetic spectrum (λ = 325 nm). Nernst-Planck's equation gives the flux (Ji) of a chemical species, the contributions of diffusion, migration, and convection, in general, as in Eq. 1 31 :

Where D is the diffusion coefficient, C is the concentration, ϕ, the potential gradient, and,  the velocity term (commonly used in convection-controlled systems). In Eq. 1, the middle term is the migration contribution of the species. Our goal is to measure single entity kinetic constants in unsupported solvents. However, we also see value in the use of the optical techniques coupled with electrochemical measurements, as described above. Here we cover two cases, an uncharged species in an unsupported solution, and a charged species with an apparent diffusion coefficient; both cases present the same function of temperature, with the calibration data showing that migration effects are negligible in a 20 K range (between 20.5 to 42 °C).
In our work, the medium is unsupported, i.e., the redox couple is the only charged species, in this case, either Fc+ from Fc oxidation or I−/ I3 − in the iodide oxidation, which follows the reactions below. Ferrocene oxidation, as in Eq. 2:

For TBAI, ionic dissociation, Eq. 3, is followed by two oxidation Eqs. 4, and 5, (Ref. 32).


The specific absorbance of the laser has been measured in the specific wavelength of λ = 325 nm for each chemical species, see section S1 in the supporting information. These measurements are done to understand the absorbance of the unreacted species, i.e., the chemical species far from the vicinity of the electrode and in the path between the laser and electrode.
Furthermore, the solvent is neat methanol, a volatile organic solvent. Consequently, the migration term could be significant. However, White and co-workers 33 have shown that the mass transport to a UME in an unsupported medium can be described with the familiar equation for diffusion to a microdisk, Eq. 6:

Where iss, is the steady-state current, a is the electrode radius, n is the number of electrons, F is Faraday's constant, and D the diffusion coefficient. Note that for the case of Fc, an uncharged species, D will be the usual diffusion coefficient, while for I−, D will be an apparent diffusion coefficient, corrected for the effect of migration. 34 Furthermore, convection could be an issue on a heated UME, 20,24 however, we will show that within the temperature range calculated under illumination the convection term is negligible in the thermal bath. Within the temperature range studied here that spans 21.5 K (from 20.5 °C to 42 °C), the change in the diffusion coefficient, or the apparent diffusion coefficient, accounts for the increment in iss. The apparent diffusion coefficient is a function of temperature, T, and the viscosity of the medium, η, according to the Stokes-Einstein equation (Eq. 7) 35 :

where kB is the Boltzmann constant, T is the temperature of the solution, η(T) is the viscosity coefficient that is temperature dependent, and r is the hydrodynamic radius of the species. We substitute D from the Stokes-Einstein expression into Eq. 1
Note that T cancels out in the middle term on the right-hand side ofthe Nernst-Plank equation and that all three terms could depend on T. For the first term, the diffusion term is proportional to T, while the viscosity is also a function of T. In the migration term, the viscosity is dependent of T. Finally, the velocity coefficient in the last term could dependend on T. In this work, we use a thermal bath to calibrate the change in diffusion coefficients as a function of temperature over the range from 293.2 K to 315.2 K. Two redox mediators were selected as thermal tracers: Fc and I−.
Ferrocene is an uncharged species so the migration term will not affect the mass transport towards the polarized working electrode, and Eq. 8 becomes 9:

Our data will show that in the span of 21 K, the diffusion coefficient follows the temperature dependence expected from the viscosity change with temperature. On the other hand, iodide could be affected by migration. However, here again, the diffusion coefficient follows the trend given by the change of viscosity with temperature, therefore, the migration contribution, expected from the charge species, is affected by the temperature of the solution. Thus, the migration term will be constant within the temperature range studied here (ΔT = 21.5 K), Eq. 10.
Because the diffusion coefficient in the thermal bath experiments changes according to the expected change based on the viscosity-temperature dependence, we conclude that within the temperature range studied here (ΔT = 21.5 K), the convection term, Cν is negligible.
We show that the temperature increment due to laser heating is within an error of ±1 K. We provide an error estimate, including possible errors on the viscosity model used to determine the viscosity-temperature dependence. We show that for a 10 μm diam UME, in the temperature range of our study, under constant illumination, the convection contribution is negligible.
Theoretical Model
Baranski and Boika 23,24 have described the temperature dependence of the steady-state region on the voltammograms (by linear sweep voltammetry, LSV) at a UME in supported solution, i.e., no migration effects. In general, increasing the temperature of a reversible electrochemical species in solution should modify the voltammogram. The steady-state current should increase, as discussed above, due to the change in D, which overall increases with rising T. Figure 1 is a simulation (DigiElch) of a voltammogram for a reversible species with a 10 μm disk electrode. The diffusion coefficients for the oxidized and reduced species are: DO = DR = 2 × 10⁻⁵ cm2 s−1 at room temperature and E0 = 0.37 V; for more details of the simulation see section S2 in the supporting information. Figure 1a shows that changing from room temperature (298 K) to 323 K increases the iss by nearly 50%. Another parameter of interest is the position of the half-wave potential, E1/2. Figure 1b shows the normalized current for the same temperature increments where the expected shift in E1/2 is 5 mV for a ΔT of 25 K. On the other hand, the current will change 0.2 nA, and the E1/2 shift would be less than 1 mV for a smaller increment of 3 K (black curve in both Figs. 1a and 1b). Thus, it is impractical to measure such a minor change in potential, see inset Fig. 1b; for example, the reference electrode must be stable, which can be challenging in nonaqueous solvents. Therefore, the change in iss, is more practical experimental value to measure because it is sensitive to temperature changes.
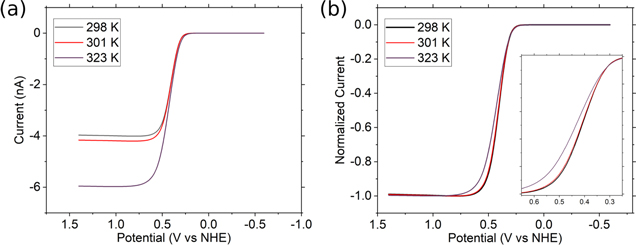
Figure 1. DigiElch® simulations of steady-state curves for a 10-μm diameter disk UME at different temperatures. (a) shows the simulated curves and (b) the normalized currents for the same simulation; the simulation assumes diffusion-limited behavior, with no migration effects. The inset in (b) shows the detail from 0.25 to 0.65 V vs NHE closer to the current onset.
Download figure:
Standard image High-resolution imageWe measure the ratio of iss at different temperatures, iy and ix. Then, substituting Eq. 1 into (6) for each temperature Tx and Ty, and taking the ratio of the two currents, we obtain:
Where ηy and ηx are viscosities at different temperatures. Equation 11 is general and Tx could be any temperature. However, if Tr.t. is room temperature, and Ty is the final temperature after heating the electrode, then Ty > Tr.t. and the ratio in Eq. 11 > 1. Therefore, we measure the steady-state current values before and after illumination, assuming a heating process, and we use the ratio to determine Ty. We solved for Ty to get a temperature function, Eq. 12:

The problem in determining the final temperature, Ty is not straightforward because viscosity ηy is a function of the unknown temperature Ty. In this paper, we eliminate some variables by setting an initial constant point at room temperature (r.t.), i.e., 298.15 K. To solve for temperature, we use a temperature-dependent viscosity model by Andrade, 36 Eq. 13:

Where A and B are fitting parameters; for more details see section S3 in the supporting information, that we obtained by fitting reported viscosity values of methanol 37 to Eq. 13.
Iterative Solution of Ty . First, we estimate a change in temperature using Eq. 11, T1. We either assume the viscosity is constant or that it follows a simpler, linear relationship with temperature:

With the new temperature, we can calculate the viscosity value using Andrade's Eq. 13, and we refine the value by calculating a new viscosity η1 with the temperature T1. With the viscosity value of η1, we then calculate a new temperature, T2 using η1; we repeat the procedure until our answer is within the set tolerance of the numerical method. The iteration procedure is equivalent to substituting ηy in Eq. 11 and solving for Ty numerically after rearrangement:

We used a commercial spreadsheet to numerically solve Eq. 15 using an initial temperature approximation with Eq. 14.
Experimental
Reagents
The solvent for nonaqueous solutions was methanol, MeOH, (HPLC grade, Pharmco-AAPER) purified by incubating in activated alumina (Al2O3, Alumina N-Super 1, MP Biomedicals), for at least one week in an Ar glove box. After transferring the MeOH outside the glovebox into the cell with a septum seal, an Ar blanket is maintained at constant flow over the photoelectrochemical cell. For the temperature-controlled cell, we did not attempt to keep the solution under Ar, although we note that solution volume was much larger (ca. 30 ml). All aqueous solutions were prepared in 18 MΩ·cm (Barnstead Nanopure, Thermo Scientific) Tetrabutylammonium perchlorate, electrochemical grade (Alfa Aesar, Thermo Fischer Scientific) was purchased and recrystallized in absolute ethanol before use. Iodine, ≥ 99.99% trace metal basis (Sigma Aldrich).Tetrabutylammonium iodide (TBAI) ≥ 99% (Sigma Aldrich). Ferrocene (Fc) 99% (Alfa Aesar) was used as received.
Electrochemical measurements
We performed all experiments in a 3-electrode cell. The working electrodes (WE), were a 10-μm diameter gold disk electrode (Goodfellow wire, Devon, PA, 99.99%) sealed in a soda-lime glass with an inner diameter of 1.10 mm and outer diameter of 1.65 mm (Dagan Corporation) and a 10-μm diameter platinum disk electrode (Goodfellow wire, Devon, PA, 99.99%) sealed in a borosilicate capillary tube with 2.0 mm and 1.5 mm of outer and inner diameter (FHC Inc.). The counter electrode (CE) was a platinum spiral wire, 0.5 mm diameter, annealed, 99.95% metal basis (Alfa Aesar, Thermo Fischer Scientific). The reference electrode, RE, was a home-made 38 I−/I3 − reference electrode (RE: Pt/ I− ([TBAI] = 20 mM)/I2(10 mM), TBAP (100 mM), CH3OH//CH3OH//), the reference electrode has a double compartment. Electrochemical measurements were done in a CH Instruments potentiostat (Austin, TX), model 760D.
We calibrated the iss by measuring LSVs and currents at constant temperature in a jacketed cell (j-cell) with an inlet and outlet connected to a Fisher Scientific Isotemp 3016H circulating water bath. The Isotemp water bath recirculation (15 L min−1) ensures a constant temperature in the water reservoir of the j-cell, allowing control of the temperature inside the cell to within 0.5 K. The temperature inside the cell was monitored with a PTFE coated stainless sheath of 1/8 × 6 in, type sensor K (Part No. 12182–20) connected to a VWR dual thermometer amplifier. An hour after the desired temperature was reached (by reading a constant temperature with the thermocouple) the electrochemical measurements were taken to allow thermal equilibration of the cell and electrodes. The iss was measured at room temperature, before heating the solution, at a higher temperature, and again, after cooling back to room temperature. We corrected the iss value after the more elevated temperature measurements to account for changes in concentration due to losses during solution heating. Briefly, the thermal bath is set to r.t. to measure the first set of electrochemical curves: CVs, and CAs. We warm up the cell and measure the second set of curves. Finally, we bring the temperature down of the cell with ice and set the thermal bath back to r.t. to obtain a new CV and iss to recalibrate for possible concentration losses due to heating.
Photoelectrochemical measurements with laser radiation experiments were performed by illuminating through a glass window in a three-branched electrochemical cell, each branch divided by fritted glass. Thus, the reference and counter electrode are far away from the laser path ca. 6 cm, see Fig. 2c schematics of the cell from the top. Figure 2a shows how the laser-illuminated "from the front" of the UME; the beam covered most of the glass around the electrode; this configuration ensures that the Pt UME is under the beam. The laser system is a continuous-wave laser of HeCd ( ) model IK3501R-G with Gaussian beam radius of 1.2 mm (
 ), power of the incident beam 50 mW, transverse mode TEM00, and linear polarization (Kimmon Koha Lasers). Moreover, the laser is a Class 3B laser, which radiation is considered to be an acute hazard to skin and eyes upon direct radiation. UV protective eyewear with OD, optical density, 2.3 has to be used at all times when operating the laser. UV protective gloves have to be used when working near the laser area. Moreover, UV protective gloves must be used when closing/opening the laser shutter. The sampling interval of the chronoamperograms was 5.12 ms and for the cyclic voltammetry 1 ms. Additionally, the experiments, used for the calculations of ratios, were smooth using a rectangle low pass filter with a cutoff frequency of 5 Hz; the reported figures are not filtered.
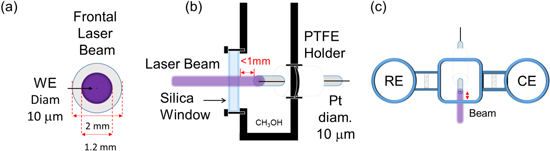
Figure 2. Schematics of the electrode cell used for our photoelectrochemistry experiments. (a) shows how the electrode was illuminated with the laser beam. (b) is the schematic of the cell where the laser illuminates a Pt UME through a window, with a pathlength of ca. 1 mm from the window to the surface of the electrode. The 10 μm diameter wire × 1 cm in length, is connected to a copper wire through silver epoxy (not shown for simplicity), all covered in glass. (c) is the schematics of the cell seeing from the top. The central WE compartment holds 3 ml of solution and the side arms hold two.
Download figure:
Standard image High-resolution imageFigure 2b shows a schematic of the cell where the laser beam illuminates the WE normal to the plane of the disk electrode. The radius of the laser beam is 120 times greater than the radius of the UME. The relation between the borosilicate capillary diameter on the UME and the laser beam is 1.67 (2 mm/1.2 mm). Furthermore, the laser beam is at a path length between the cell window and the working electrode of ˂ 1 mm. The laser was warmed up for 30 min before experiments. The laser is mounted on a Newport optical table, on the top of an anti-vibration table (made in-house). The illumination is controlled by an electronic shutter (custom-built, with a shutter speed of  6 ms). Note that the reference electrode and the counter electrode have different compartments, and they are away from the illumination path (Fig. 2c). The volume of the cell is relatively large: the WE compartment is 10 ml, while the CE and RE compartment contain approximately 2 ml each.
Results
The choice of the redox mediator to study temperature effects should approach the reversible behavior on the electrode surface to facilitate data analysis. Figure 3a shows the results of running the LSV for a 1 mM iodide solution in MeOH. The LSV is a mass transport-limited sigmoidal voltammogram, as expected for a UME. The LSV displays an increase in the steady-state current as the temperature increases from 298 K to 301 K. Moreover, the plateau current for TBAI is not reached; this could be an effect of not using electrolyte, see S4 and S5 for blank control experiments. To measure the current change more accurately; we performed chronoamperometry (CA) experiments under the same conditions (Fig. 3b). The current vs time transients allowed us to measure the average iss value and its standard deviation. This change in temperature corresponds to 3 K, which is the value that we found under laser illumination conditions. Figure 3c shows the LSV for an electrode in our photoelectrochemical cell before illumination (LGC) and under constant illumination by the CW laser after the gate is open (LGO). Figure 3d shows the chronoamperometry experiment. The change in the current is consistent with a temperature increase: the current increases due to an overall lower diffusion coefficient. We took the ratios of these two values, performed the iterative procedure, and found an increment in temperature of 4.5 K, consistent with the results under thermostatic conditions.
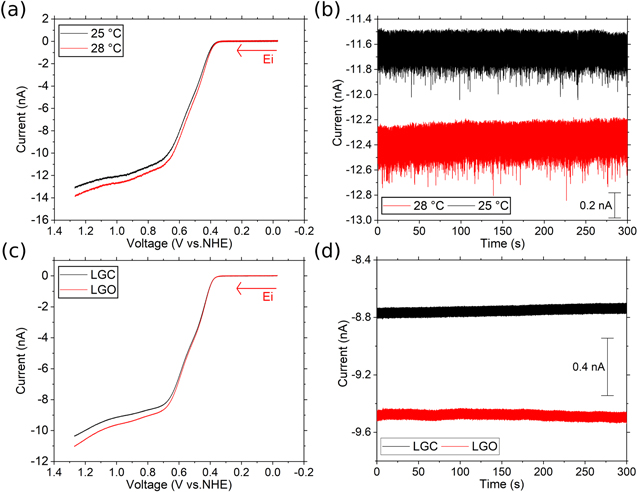
Figure 3. Temperature dependence 1 mM TBAI in MeOH with a 10 μm diam. Pt disk electrode. Curves under temperature control, i.e., jacketed cell (a) LSVs at 100 mV s−1 and (b) chronoamperometry at an applied potential of 0.97 V vs NHE. (c) and (d) correspond to laser radiation studies, started in the dark (LGC) and after opening the laser gate and keeping the electrode under illumination (LGO), same applied potential and scan program as (a) and (b). Data collected with a pyrex cell.
Download figure:
Standard image High-resolution imageFigure 4 shows a similar experiment with a 1 mM ferrocene (Fc) solution in MeOH. Figure 4a shows the LSV under thermostatic conditions, with the expected increase in steady-state current. Interestingly, the shift in the voltammogram is not evident, possibly due to small changes on the nonaqueous reference electrode. Figure 4b shows the current vs time data does show the expected higher anodic current (negative in the instrument convention). The current increment is consistent with the change observed for a UME under laser illumination. Figure 4c shows the LSVs, and Fig. 4d shows the current vs time for the electrode under illumination. The calculated temperature for the solution under irradiation is 7.6 K, 4 degrees higher under the same conditions as for the TBAI (Fig. 3). This increment in temperature could be due to the Fc solution absorbing the laser light (325 nm) more strongly than the TBAI solution.

Figure 4. Temperature dependence 1 mM Fc in MeOH with a 10 μm diam. Pt disk electrode. Curves under temperature control, i.e., jacketed cell (a) LSVs at 100 mV s−1 and (b) chronoamperometry at an applied potential of 0.97 V vs NHE. (c) and (d) correspond to laser radiation studies, showing the current in the dark (LGC) and after opening the laser gate and keeping the electrode under illumination (LGO), same applied potential and scan program as (a) and (b). Data collected with a pyrex cell.
Download figure:
Standard image High-resolution imageInterestingly, the current vs time curves for both sets of experiments, TBAI and Fc have much larger noise levels than the data under laser illumination. In prior reports, we have optimized the photoelectrochemistry set up to minimize the noise. However, for the thermostatic measurements, we did not expect this relatively significant noise level, which probably originates from the thermostatic bath inducing noise in the electrochemical data acquisition. This larger noise increases the uncertainty in the value of the steady-state current, σir.t. and σiy, which translates into a larger error in the temperature measurement.
Figure 5 shows the results obtained for the calibration of the Fc and TBAI solutions in the thermal bath experiments. Again, there is an excellent fit to the equation at lower temperatures, within an interval of 20 K that brackets the room temperature values, taken as reference (note there are no error bars on this value since it was selected as reference point). The fit indicates that the change of temperature and its accompanying change in the solvent's viscosity accounts for the difference in the steady-state current. Therefore, for the redox couples investigated here with a 10 μm electrode, the convection term in Eq. 1 is negligible in the temperature range of Fig. 5. Interestingly, the two redox couples follow the trend expected from the temperature dependence of viscosity. For Fc, there is no migration contribution because it is an uncharged species. On the other hand, for iodide, there is a migration effect but, according to our results, remains a constant contribution through the temperature range of this work, because like the case of Fc, the apparent diffusion coefficient of iodide follows the temperature dependence given by the Stokes-Einstein Eq. 7.
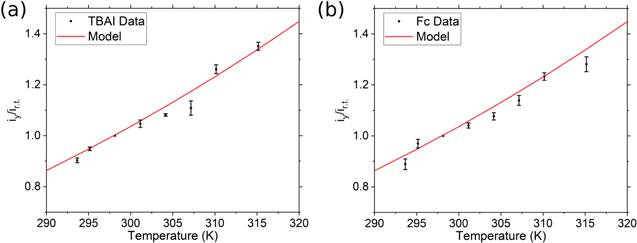
Figure 5. Current relation at higher temperatures with respect to room temperature. (---) fit to Andrade's viscosity model compared with (a) TBAI and (b) ferrocene solutions (1 mM). Data obtained under thermostatic conditions.
Download figure:
Standard image High-resolution imageMoreover, we note that some points fall below the model line, but we expect this to be a problem with electrode passivation. We have noticed that the iss decreases in Fc solutions when the temperature increases, and this is shown in Fig. S8. Note that as the temperature increases, the current increases too, but cooling down do the original r.t. can yield a lower current, which we assign to a change on electroactive area. After polishing, we recover the current, which indicates that Fc or an impurity adsorb and blocked the electroactive area. However, when the method is applied carefully, we can account for most of the changes due to heating: we run a CV after the heating of the solution and another CV after the solution cools down, to account for changes in surface area and changes in the electroactive area. By obtaining the ratio of iss(T)/iss,r.t., we cancel out the electrode radius from the measurement.
Table I summarizes the results for the TBAI solution. We tried to reproduce the iss current ratio of the thermal bath for the electrode under illumination (LGO) with respect to the current in the dark (LGC). During the time where the laser gate is closed (LGC), the cell is at room temperature. Moreover, the data in Table I correspond to our most accurate measurements, while in section S6 we include data from different electrode materials, Au and Pt, and different silica windows. Note that the ratio error is 1% for the thermostatic conditions and 0.4% for the measurements under illumination. Because of the noise in the current measurements (cf. Figs. 3 and 4), there is relatively lower accuracy in reproducing the ratio under illumination with the thermostatic bath. Figure 6 shows the ratios of the current as a function of time. The difference of the average numbers is ca. 2%, but the error of the thermostatic conditions brackets the measurement for the laser under illumination, in the graph and in Table I. It would be tedious to improve the accuracy of the current ratio by refining the thermostatic conditions. Therefore, we estimate the error of the measurement and show that for our experimental conditions, the measurement error is within 1 K.
Table I. Steady-state current ratios and calculated temperature increments. The solution is a 1 mM TBAI solution with the 10-μm-diam electrode under CW illumination and a 5 K temperature increment under thermostatic conditions with a Pyrex cell.
| Under laser illumination | Thermostatic ΔTexp = (3 ± 0.5) K | |
|---|---|---|
| iy/ir.t. ratio | 1.08 ± 0.004 | 1.06 ± 0.01 |
| ΔTcalc (K) (a) | 4.5 ± 0.6 | 2.48 ± 1 |
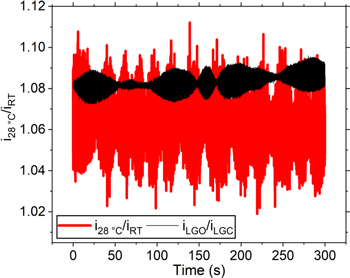
Figure 6. Ratios for the diffusion limited currents at higher temperatures with respect to room temperature for the thermostatic bath (red) and for the electrode under illumination (black). Data obtained by dividing the i(t) curves in Fig. 3(b) and (d).
Download figure:
Standard image High-resolution imageΔTcalc = Ty - Tr.t., using Ty from Eq. 15. The error on ΔTcalc is from the error propagation σTy from Eq. 17, and taking  ± 0.5 K.
  is due to the thermocouple accuracy.
Uncertainty propagation
To estimate the error of Ty, σTy, we apply the usual propagation of error to Eq. 15.

Where xj are the variables in Eq. 15. The operation yields Eq. 17:
Where y = (A + B/Ty) for convenience. The errors in Eq. 17 come from different sources. The error in measuring the initial temperature, σTr.t., is due to the accuracy of the thermocouple (± 0.5 K). Again, we estimated the steady-state current errors, σir.t. and σiy from the standard deviation of the iss measurement; for more detailed information, see SI, section S7. We estimate the uncertainty in the viscosity at room temperature σηr.t., on the reported values, 37 which are accurate to 1 × 10⁻⁵ mPa s. In contrast, the uncertainty in σηy comes from the error of fitting Eq. 13 to experimental data. For the TBAI data, σTy = ±1 K.
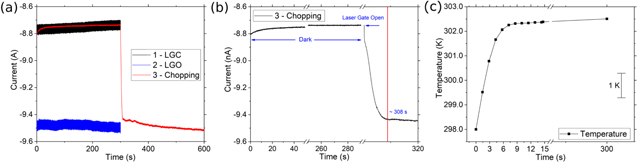
Finally, we performed chopping experiments to understand the heating process, and how long it takes to equilibrate the solution under laser heating, see Fig. 7. In Fig. 7a all curves are labeled sequentially. The black curve in Fig. 7a is a chronoamperogram with the laser shutter closed, thus r.t., or laser gate closed experiment. The transient i–t at room temperature and the LGO are sampled at a different frequency, higher frequency, since the period of the experiment is shorter. We did not attempt to filter these curves in order to point out that the red curve in Fig. 7a has a different sampling rate compared with all the i–t data shown in this work, and this is necessary to obtain the temporal resolution to observe the temperature change at short times after opening the laser gate. In addition, the filtering is only performed to report current ratios. For the chopping experiments, the red curve wasperformed using a shutter with an openning time of  60 ms see Fig. 7b; where after 300 s in the dark, we opened the shutter to illuminate the sample. Immediately after the laser illuminates the electrode, a relatively rapid change in Dapp is observed for TBAI, which continues for ca. 8 s. Finally, a slower heating regime follows, and this achieves a quasi-steady state region after 300 s of illumination (600 s in Fig. 7a). Figure 7b is a zoom of the fast region that shows the rapid change in current in < 1 s that results from the shutter opening, approximately 60 ms. We convert the change in current to a temperature scale (Fig. 7c) within the first 14 s of photon irradiation; the slope of the first 5 s is in the order of 1 K s−1. Taking the mass of a 10 μm Pt wire, 0.5 cm long, (m = 1.65 × 10⁻⁵ g of Pt) and the average heat capacity, Cp = 0.13 kJ kg−1 K−1, ΔT = 3 K, we can estimate the heat rate absorbed by the Pt, Q = mCpΔT = 1 μJ, which corresponds to 1 μW. The heating rate of the Pt wire will be around 1.3 μW and this describes the faster heating regime slope: the first 8 s in Fig. 7b, considering a 48% reflectance of the Pt surface,
39
and the absorbance of the solution and glass wall. The slower regime, after 8 s, could be due to heat dissipation, as the temperature increases the glass and methanol in the vicinity of the Pt electrode are more effective in dissipating heat, because of the higher ΔT; this higher driving force, in turn, slows the Pt heating rate, before the break in the x-axis in Fig. 7c. In the second heating regime, there is a nearly constant change on the temperature. This regime is likely the result of heat transfer from the medium, as it gradually heats up due to the laser, as discussed in more detail below. Although here we propose that convection is negligible, based on the discussion below, it is possible that this regime includes some convection.
11
This would mean that the method overestimates our temperature for the data in Fig. 7. In addition, the change in current from 8 to 300 s is 5% which we assume is due to the change in mass transport by diffusion. However, if this 5% larger current has a convection contribution, this will mean the change in current, which in this case corresponds to an increase of < 0.2 K over the 8 to 300 s, is an error due to convection. Since this <0.2 K error is smaller than the method error (ca. 1 K), we assume the convection error, if present, is negligible in the current state of the method.
60 ms see Fig. 7b; where after 300 s in the dark, we opened the shutter to illuminate the sample. Immediately after the laser illuminates the electrode, a relatively rapid change in Dapp is observed for TBAI, which continues for ca. 8 s. Finally, a slower heating regime follows, and this achieves a quasi-steady state region after 300 s of illumination (600 s in Fig. 7a). Figure 7b is a zoom of the fast region that shows the rapid change in current in < 1 s that results from the shutter opening, approximately 60 ms. We convert the change in current to a temperature scale (Fig. 7c) within the first 14 s of photon irradiation; the slope of the first 5 s is in the order of 1 K s−1. Taking the mass of a 10 μm Pt wire, 0.5 cm long, (m = 1.65 × 10⁻⁵ g of Pt) and the average heat capacity, Cp = 0.13 kJ kg−1 K−1, ΔT = 3 K, we can estimate the heat rate absorbed by the Pt, Q = mCpΔT = 1 μJ, which corresponds to 1 μW. The heating rate of the Pt wire will be around 1.3 μW and this describes the faster heating regime slope: the first 8 s in Fig. 7b, considering a 48% reflectance of the Pt surface,
39
and the absorbance of the solution and glass wall. The slower regime, after 8 s, could be due to heat dissipation, as the temperature increases the glass and methanol in the vicinity of the Pt electrode are more effective in dissipating heat, because of the higher ΔT; this higher driving force, in turn, slows the Pt heating rate, before the break in the x-axis in Fig. 7c. In the second heating regime, there is a nearly constant change on the temperature. This regime is likely the result of heat transfer from the medium, as it gradually heats up due to the laser, as discussed in more detail below. Although here we propose that convection is negligible, based on the discussion below, it is possible that this regime includes some convection.
11
This would mean that the method overestimates our temperature for the data in Fig. 7. In addition, the change in current from 8 to 300 s is 5% which we assume is due to the change in mass transport by diffusion. However, if this 5% larger current has a convection contribution, this will mean the change in current, which in this case corresponds to an increase of < 0.2 K over the 8 to 300 s, is an error due to convection. Since this <0.2 K error is smaller than the method error (ca. 1 K), we assume the convection error, if present, is negligible in the current state of the method.
Figure 7. (a) Time dependence of the change in anodic current (negative direction), the experiments are labeled in the order they were performed . Curve (3) corresponds to a chopped illumination experiment measured after the main ratio current experiments to check the current reproducibility . (b) Zoom in of (a) at the laser shutter opening time and the change in anodic current (negative direction) during laser irradiation and further heating. (c) Temperature dependence of sampling the data in (b) every 1.4 s.
Download figure:
Standard image High-resolution image
Discussion
Heat transfer mechanisms
We discussed above that the main source of heating the electrode surface is the laser beam power that reaches the electrode surface. We propose that heat transfer by convection could be neglected; i.e., the convective flux due to density and viscosity changing across a temperature gradient is negligible. We discuss two methanol dimensionless numbers relevant to natural convection: Prandtl (Pr), which is the ratio of momentum to thermal diffusitivites 40 :

Where cp is the specific heat, µ dynamic viscosity, and k the thermal conductivity. For MeOH, Pr = 6.6 which is close to 1. In general, for Pr ≫ 1, e.g., for an oil (Pr > 300), 40 convection dominates over conduction. Another parameter relevant to heat transfer by convection is the Grashof number,

Where g is the gravitational acceleration, β is the coefficient of thermal expansion, Ts is the surface temperature, T∞ is the bulk temperature, L is the charateristic distance (electrode diameter) and ν is the kinematic viscosity. For MeOH under our conditions, GrL = 6.3 × 10⁻⁵, which is significantly smaller than the value expected for natural convection. For example, for water next to a stagnant wall, Gr = 104 to 109 for effective dissipation through natural convection. 40 In other words, the Pr and GrL numbers have values consistent with negligible convection in comparison with heat dissipation by conductivity. These numbers are also consistent with our observation that the temperature gradient causes negligible mass transport convection (Fig. 5) in the steady-state current due to diffusion-limited mass transport to the UME.
Another possible source of heat is the laser power absorbed by the solution in the beam path. For a 1 mM TBAI (A = 0.0419, SI, Fig. S1 (available online at stacks.iop.org/JES/169/016509/mmedia)), the power absorbed by the solution under laser illumination is 3.8 mW for a Pyrex cell. Assuming that a cylinder of 1 mm with the diameter of the beam (1.2 mm), and V = 1.13 × 10⁻³ cm3, and that the solution converts all the absorbed energy to heat, over 300 s, this corresponds to 1.14 J. On the other hand, given the heat capacity of CH3OH, Cp,MeOH = 3.62 J g−1 K−1, to increase the solution temperature in 4 K will take 13 mJ. Therefore, there would be excess power to heat the solution in the vicinity of the electrode to 4 K, and the same applies above, for the case of 1 mM TBAI. For Fc, with a larger absorption at 325 nm, there will be a larger laser power absorbed. Therefore, we propose that the heat absorbed by the solution volume in the beam path between the electrode and the cell is dissipated by conduction to the larger volume of solution in the WE cell compartment. We consider a cylinder of radius r1 = laser beam radius = 0.6 mm and length Lcyl, that conducts heat to a larger cylinder of radius r2. The thermal conduction rate in cylindrical coordinates is given by 40 :

where k is the thermal conductivity of MeOH, kMeOH, T1 and T2 are the temperatures at r1 and r2, respectively. For kMeOH = 0.2 W m−1 K−1, and Qcond = 3.8 mW, and ΔT = 5 K, we obtain r2 = 4 mm. In other words, a stagnant volume of CH3OH can dissipate the laser energy as heat over a radius of 4 mm, which is well within the dimensions of our cell compartment. Based on the heat conduction analysis and the data below, on the time dependence of the D and Dapp and temperature change, it follows that the metal illumination is the main heating mechanism causing a change in mass flux.
Because the laser heating the electrode is the main illumination mechanism, we discuss the beam shape and its implications. The Gaussian beam radius of the laser is 1.2 mm, much larger than the 10 μm disk. The laser specifications are: Gaussian beam radius of 1.2 mm ( ), power of the incident beam 50 mW, transverse mode TEM00, and linear polarization. The power intensity is described with a Gaussian function on a perpendicular plane from the laser beam, as given by Eq. 21.

The beam radius,  is used by the manufacturer to define the decay of the power from the center of the beam. From Eq. 21, the distance from the beam axis where the intensity drops to
  (1/e2) of the maximum value is at
  Thus, this specific CdHe laser can transmit
  of the optical power at 0.6 mm from the center of the beam. Moreover, we aligned the laser by sweeping the mirrors on the micrometer range, thus, we set the laser beam irradiating the electrode at the global maximum photocurrent (ca. 90% of the maximum power of the laser) which aligns the electrode at the maximum power irradiation. Assuming our electrode is within a circle of 100 μm in diameter, within the center of the laser, the variation would be, based on Eq. 21, is 0.3% of the laser power. Moreover, local and non-uniform heating could result from surface defects. However, in order to address local/non-uniform heating, we would need to do a surface-sensitive characterization like SECM,
28,30
which is beyond the scope of this work.
of the optical power at 0.6 mm from the center of the beam. Moreover, we aligned the laser by sweeping the mirrors on the micrometer range, thus, we set the laser beam irradiating the electrode at the global maximum photocurrent (ca. 90% of the maximum power of the laser) which aligns the electrode at the maximum power irradiation. Assuming our electrode is within a circle of 100 μm in diameter, within the center of the laser, the variation would be, based on Eq. 21, is 0.3% of the laser power. Moreover, local and non-uniform heating could result from surface defects. However, in order to address local/non-uniform heating, we would need to do a surface-sensitive characterization like SECM,
28,30
which is beyond the scope of this work.
Measurement error sources
Our results indicate that we can measure changes in temperature using the difference in the diffusion-limited current within a 1 K accuracy. For the data in Table I, we can apply the method to the current-ratio measured under thermostatic conditions. We get an increment of 4.5 K, which is within the ± 1 K that we estimate for the error with Eq. 17 and we discuss the factors that limit the accuracy of the measurement. The method is analogous to a ratiometric fluorescence measurement because by taking the current ratios, the concentration, C*, and the electrode radius, a, in Eq. 6 cancel out in the derivation of Eq. 12. Therefore, using the current ratios removes uncertainties on the UME radius, which is difficult to standardize if the experiments do not modify the electrochemical surface area. We monitored changes in C* during heating by collecting iss values either by LSV or CA once the solution has cooled back to r.t.. We can address error contributions by looking at the relative weight of the terms between brackets in Eq. 17. Interestingly, we found that the more significant contributions come from the current measurement errors. For example, 46% of the overall error is due to σix while ca. 35% to the current measured at a higher temperature, σiy, for the unfiltered photoelectrochemical ratios, see Table SVII in the SI. Figure 6 shows the current ratios as a function of time for Fig. 3, which shows the significant error obtained in these measurements. The current envelope has periodic components, which points to an instrumental source of error. For the measurements with the thermostatic conditions, the bath pump and heating element likely contribute to the noise. In summary, the relatively large noise level on the current measurements for UMEs decreases the method's accuracy, especially when the cell is heated. The third significant contribution is the error in the initial temperature, σTx = ± 0.5 K, with 17% for the same case in Table SVII, simply because of the limitations of our thermocouple. Therefore, to increase the accuracy of the measurement, we need to calibrate the currents under constant temperature with lower noise levels. As described above, we also use a digital filter to minimize the instrumental error. This improved our results, making the error for our most precise measurements ± 0.6 K. However, the use of filtering or sampling at lower times has a relatively low effect, because we average the data over 300 s in the measurements reported here. Also, the data in Table SV shows that under conditions where adsorption occurs, the error of the measurements is larger (e.g., ±4 K for Fc/Au with a pyrex cell), which indicates that surface reactions can also introduce noise, which we are currently investigating. In addition, convection could be a source of error as described above, but based on our current results, we expect convection to be negligible in both mass transport and heat transfer.
Other known sources of uncertainty include the error of fitting viscosity data to Andrade's model has a lower contribution (< 0.5%) to the overall error of the temperature estimate. Therefore, even though more advanced viscosity models exist 37 the fitting to Andrade's model, a time-honored equation, provides accurate results if the viscosity data brackets the temperature interval of interest. Another error source could arise because of deviations from the viscosity of pure solvents. The redox-active molecules or impurities that build up during the experiment can cause the viscosity to deviate from the value of the pure solvent. In this case, it should be possible to measure the viscosity for the specific solution under study.
Our results show that the change in temperature of (4 ± 1) K is relatively low considering that the CW laser illuminates the electrode surface constantly. We collected the data in Fig. 6 over 300 s, a typical time scale when collecting stochastic photoelectrochemistry data. Note that there is no upwards trend in Fig. 6, which indicates that the system has reached thermal equilibrium. It follows that the electrode materials and the cell, e.g., the glass around the UME, and the large solvent volume, which is not illuminated, act as effective heat sink opposing a temperature change. The region illuminated by the laser overall has a tendency to remain close to room temperature. This 4 K temperature increment is tolerable for many applications. For example, Smalley et al. 3 point out that a 4 K temperature jump does not significantly affect electron transfer measurements of fast outer sphere reactions. Also, when working with volatile solvents, such as many organic solvents, with higher vapor pressures than water, it is crucial to keep the light source from making the solution boil. Finally, we emphasize that we did not add any supporting electrolyte, which indicates that the temperature effect does not change the relative contribution of migration in the unsupported iodide solution.
Conclusions
We derive a method to measure temperature and estimate its error using the diffusion coefficients' temperature dependence and its effect on the steady-state diffusion-limited current. We propose a ratiometric approach for the steady-state current to measure temperature in unsupported solutions in MeOH, a volatile solvent. We calibrated the temperature measurement to an accuracy of 1 K by measuring the ratios of the steady-state current for a disk UME at different temperatures and using a model that accurately predicts the dependence of viscosity and temperature of the methanol solvent. A numeric (iterative) method can yield satisfactory results, explicitly considering the changes for both diffusion coefficients and viscosity. The calculated temperature while heating under thermostatic conditions is within 1 K of the temperature control value, consistent with the equation derived for the temperature measurement error. The solutions in MeOH are unsupported, but the apparent diffusion coefficient follows the expected increase with temperature. This finding is relevant for work with weakly supported solutions. Under our conditions that include illumination from a CW laser, the method indicates that the temperature increases by (4 ± 1) K. This increment corresponds to an average temperature from the surface of the electrode and the solution around it, considering that a species electrolyzed on a microdisk has an effective diffusion length of several disk radii. Future work will include developing a more rigorous model that could deconvolute the temperature/distance profile to possibly leverage the effects of heating by the illumination source for studies of the solid/liquid interface with UMEs 3–5
Acknowledgments
We gratefully acknowledge support from the National Science Foundation through grant CHE-1905312. We thank Dr. Ulises Torres-Herrera for useful discussion.