
Abstract
Li- and Mn-rich layered oxides (LMR-NCMs) are promising cathode active materials (CAMs) in future lithium-ion batteries (LIBs) due to their high energy density. However, the material undergoes a unique open circuit voltage (OCV) hysteresis between charge and discharge after activation, which compromises its roundtrip energy efficiency and affects the thermal management requirements for a LIB system. The hysteresis is believed to be caused by transition metal (TM) migration and/or by oxygen redox activities. Using in-situ X-ray powder diffraction (XPD), we monitor the lattice parameters of over-lithiated NCMs during the initial cycles and show that also the lattice parameters feature a distinct path dependence. When correlated to the OCV instead of the state of charge (SOC), this hysteresis vanishes for the unit cell volume and gives a linear correlation that is identical for different degrees of over-lithiation. We further aimed at elucidating the role of TM migration on the hysteresis phenomena by applying joint Rietveld refinements to a series of ex-situ XPD and neutron powder diffraction (NPD) samples. We critically discuss the limitations of this approach and compare the results with DFT simulations, showing that the quantification of TM migration in LMR-NCMs by diffraction is not as straightforward as often believed.
Export citation and abstract BibTeX RIS

This is an open access article distributed under the terms of the Creative Commons Attribution 4.0 License (CC BY, http://creativecommons.org/licenses/by/4.0/), which permits unrestricted reuse of the work in any medium, provided the original work is properly cited.
Driven by mobile applications like electric vehicles (EVs), 1–3 the demand for affordable lithium-ion batteries with a higher energy density is rising. Targets of 100 $/kWh are necessary to achieve comparable vehicle costs at acceptable driving ranges. 4,5 The only way to reach these ambitious goals is an increase of battery energy density by increasing the specific capacity of the active materials and by using abundant and inexpensive materials. On the cathode side, lithium-and manganese-rich layered oxides, often abbreviated as LMR-NCMs, provide high specific capacities of up to 250 mAh g−1 at low material costs that are achieved by replacing a major part of the conventionally used nickel with inexpensive manganese. 6,7 The specific capacity increase of the so-called "over-lithiated" NCMs compared to conventional NCMs originates from a slight rearrangement of the layered structure, Li[Liδ TM1−δ ]O2 (with TM = Mn, Ni, and Co), in the pristine cathode active materials (CAMs). Stoichiometric NCMs with δ being close to 0 offer a theoretical specific capacity of around 277 mAh g−1, but due to their structural instabilities at lithium contents of xLi < 0.2 that are caused by the release of lattice oxygen and due to their first cycle efficiency of maximum 90%, their practically usable specific capacity remains limited to approximately 200 mAh g−1. 8,9 On the other hand, in LMR-NCMs, a part of the transition metals (TMs) in the TM layer is replaced by lithium, 10–12 leading to an over-lithiated structure with theoretical specific capacities of 346–377 mAh g−1 for δ = 0.14–0.20. 13 In contrast to stoichiometric NCMs, the over-lithiated structure can be reversibly cycled beyond the onset of oxygen release down to xLi ≈ 0.1 and delivers first charge capacities of ≈320–340 mAh g−1. 13 Even though not all of the removed lithium from the first activation charge can be re-intercalated, the material delivers a reversible specific capacity of around 250 mAh g−1, 25% more than stoichiometric NCMs can reach under practical cycling conditions. Despite their high specific capacity and low material costs, issues such as oxygen evolution and the associated stability problems, 13–15 the low electrode densities of the first generation of LMR-NCMs, 16 the comparably high impedances, 17 and the well-known voltage fading phenomenon 18 still hamper the commercialization of LMR-NCMs. Amongst these issues, voltage fading over cycle-life is often discussed as one of the most detrimental challenges, but Kraft et al. have shown that the voltage fading over 250 cycles in large-format LMR-NCM/graphite full-cells is in the range of ≈155 mV (compared to ≈60 mV for NCA/graphite cells), and therefore reduces the energy density by less than 5%. 19 With regards to actual applications, they further show that the well-known open circuit voltage (OCV) hysteresis LMR-NCMs does lead to lower energy efficiencies compared to stoichiometric NCAs even at low C-rates (e.g., 88% for LMR-NCM/graphite vs 98% NCA/graphite at C/10), resulting in a more pronounced temperature increase when operating large-format cells at high C-rates. One last point to consider with LMR-NCM based cells is that current battery management systems would have to be adapted, as they typically determine the state of charge (SOC) from the measured cell voltage. 20,21 For materials with a significant voltage hysteresis like LMR-NCMs and silicon, however, the SOC at a given cell voltage can differ substantially depending on the cycling history of the cell.
The voltage hysteresis of over-lithiated NCMs is well-known since their early days after invention. 22 The fact that the charge and discharge curves after activation remain separated by up to several hundreds of mV, even under OCV conditions of a few hours, shows that the voltage hysteresis is an intrinsic bulk property of LMR-NCMs. 23 It is thus not surprising that over time a variety of other properties of LMR-NCMs were also found to be path-dependent, such as its resistance (determined by the direct current internal resistance (DCIR) method) 17 and, more explicitly, the charge-transfer resistance (from EIS measurements) and the lithium diffusion coefficient (from GITT experiments). 24 On the atomic level, there are several publications about the charge/discharge hysteresis of the oxidation states, both for the transition metals 24,25 and oxygen 24 as well as of the TM-O bond distances (from EXAFS analysis). 26 Even though X-ray powder diffraction (XPD) is frequently applied to analyze the structural changes of CAMs during lithiation/delithiation, Konishi et al. were the only ones who reported on the lattice parameter hysteresis (in the rhombohedral representation) of LMR-NCMs, but without diving deeply into possible reasons for their observations. 25 However, the evolution of the lattice parameters upon lithiation/delithiation, especially when measured under in-situ or operando conditions in a battery cell, can be a powerful tool to gain an understanding about the underlying mechanism(s) of the observed hysteresis phenomena. There is a lively discussion in the literature, which assigns the hysteresis in LMR-NCMs either to a path dependence of the transition metal (TM) migration, 23,27–29 the anionic redox, 24 or a combination of both. 30 TM migration typically means that transitions metals, which originally reside in the TM layer (TMTM), move upon cycling (ir)reversibly into the lithium layer (TMLi), whereas anionic redox refers to the O2−/On− couple (n < 2), which occurs independently or in conjunction with the cationic redox in over-lithiated CAMs. Alternatively, a recently published study considers the anionic redox as the reversible formation of molecular O2 trapped in voids within the particles, which is induced by the in-plane TMTM disordering after the removal of LiTM during the activation charge. 31
As known from the intensively studied stoichiometric NCMs, 32–35 both the redox processes and the TM distribution are important descriptors of the lattice dimensions, because they affect the attractive and repulsive interactions of the two metal layers inside the oxide lattice. This renders diffraction methods to be very promising for elucidating the origin of the voltage hysteresis in LMR-NCMs. Beyond that, Rietveld refinements of high-quality (ex-situ) diffraction data enable the quantification of migrated TMs upon cycling. 29,30,36 Since the literature considers the distribution of typically Li, Ni, and Mn in LMR-NCMs on either octahedral and/or tetrahedral sites, it is not possible to perform the refinement solely based on XPD data, as this would result in severe correlations between all of the refined parameters. Therefore, it is beneficial to rely for such complex systems on complementary diffraction datasets, e.g., XPD and neutron powder diffraction (NPD), and to perform joint Rietveld refinements. 37–39
In the present study, we applied in-situ XPD on our laboratory diffractometer to monitor the lattice parameter evolution of an over-lithiated CAM over the course of the initial charge/discharge cycles. The in-situ approach makes it possible to correlate the lattice dimensions to the SOC, which is equivalent to the overall lithium content in the material, but also to the OCV at which the diffractograms were recorded during intermittent rest phases. Further in-situ experiments were conducted to shed light on the lattice parameter dependence on the degree of over-lithiation and on the cycling conditions, varying the effective SOC window. Subsequently, ex-situ diffraction data were collected again on the laboratory diffractometer (L-XPD) as well as at a synchrotron (S-XPD) and a neutron source (NPD), which were analyzed by Rietveld refinements. Here, we are especially interested into the quantification of migrating TMs by applying a joint refinement approach. By evaluating different structural models and looking at several influencing factors during the refinement, we critically discuss the meaningfulness of the refinement results, and, in combination with DFT simulations, the role of TM migration on the hysteresis in Li- and Mn-rich layered oxides.
Experimental
Materials and electrode preparation
As in our previous gassing study, 13 we used three different Li- and Mn-rich layered oxides with varying degrees of over-lithiation. Following the Li[Liδ TM1−δ ]O2 notation for the pristine CAMs, BASF SE (Germany) provided a low- (δ = 0.14), mid- (δ = 0.17), and high-lithium material (δ = 0.20), which in an alternative notation correspond to the compositions 0.33 Li2MnO3 · 0.67 LiTMO2, 0.42 Li2MnO3 · 0.58 LiTMO2, and 0.50 Li2MnO3 · 0.50 LiTMO2 that were examined by Teufl et al. 13 The high-lithium material is the same as in our previous work, whereas the other two CAMs are follow-up batches with similar composition and properties. Since the main work in the present study was done with the mid-lithium material, its precise composition was determined at the Mikroanalytisches Labor Pascher (Remagen, Germany). After dissolving the CAM by pressurized acid digestion in aqua regia, the (metal) composition was determined as Li[Li0.17Ni0.19Co0.10Mn0.54]O2 by means of inductively coupled plasma atomic emission spectroscopy (ICP-AES). Here, we included surface impurities into the calculation, from which a total of ≈1 wt% could be identified mainly as carbonates. In order to assign the residual mass stoichiometrically to lattice oxygen (assuming no oxygen vacancies in the pristine material, as confirmed by Csernica et al. 40 ), there has to be another total amount of ≈2 wt% of impurities. This corresponds to a theoretical specific capacity of 350 mAh g−1 CAM for complete lithium extraction (compared to 361 mAh g−1 NCM for the pure LMR-NCM in the absence of the ≈3 wt% of impurities). Please note that capacity values are normalized to the mass of the as-received CAM powder (i.e., 350 mAh g−1 CAM) and that we used the Li[Liδ TM1−δ ]O2 notation throughout our work.
LMR-NCM cathode coatings were prepared by mixing 94 wt% of CAM powder, 3 wt% of Super C65 conductive carbon (Timcal, Switzerland), and 3 wt% of polyvinylidene fluoride binder (PVDF, either Kynar HSV 900, Arkema, France or Solef 5130, Solvay, Belgium) with N-methyl-2-pyrrolidone (NMP, anhydrous, 99.5%, Sigma-Aldrich, Germany) at a solids content of 62 wt% in a planetary orbital mixer (Thinky, USA) in several steps. The final slurry was cast onto an aluminum foil (thickness 15 μm, MTI, USA) using a 200 μm four-edge blade. The coated foil was dried overnight in a convection oven at 50 °C. This procedure results in relatively high loadings of ≈14–20 mgCAM cm−2, which improves the signal-to-background ratio for the in-situ L-XPD experiments. In order to obtain enough cycled CAM powder for the ex-situ NPD measurements, we also prepared double-sided cathode sheets by coating the backside of the Al foil after the first drying step. The cathode sheets were calendered (GK 300-L, Saueressig, Germany) to a porosity of around 45%. For coin cells, disk-shaped electrodes with a diameter of 14 mm were punched out from the single-sided sheets and then dried overnight in a vacuum oven (Büchi, Switzerland) at 120 °C, before transferring them inertly into an argon-filled glove box (<1 ppm O2 and H2O, MBraun, Germany). For single- and multi-layer pouch cells, quadratic-shaped electrodes with a coated area of 9 cm2 were cut out and then dried overnight in the oven chamber of the glove box at 90 °C under dynamic vacuum.
X-ray powder diffraction
X-ray powder diffraction (XPD) experiments were mainly conducted at our in-house STOE STADI P diffractometer (STOE, Germany) in Debye–Scherrer geometry, using Mo-Kα1 radiation (0.7093 Å), a Ge(111) monochromator, and a Mythen 1 K detector, and taking one data point every 0.015°/2θ. These will further on be referred to as "L-XPD" measurements, which were used (i) to monitor the evolution of lattice parameters during the first cycles from in-situ single-layer pouch cell data and (ii) to obtain structural information from ex-situ capillary data.
The in-situ L-XPD data were recorded in a similar fashion as in our previous publication. 41 The 9 cm2 single-sided cathode was assembled with an over-sized lithium counter-electrode (10.9 cm2, thickness 450 μm, Albemarle, USA), a glass-fiber separator (14.4 cm2, glass microfiber filter 691, VWR, Germany), and 400 μl of LP57 electrolyte (1 m LIPF6 in EC:EMC = 3:7 by weight, BASF SE) in a relatively thin pouch foil (12 μm-thick Al layer, Gruber-Folien, Germany). The pouch cell was fixed without external compression between two metal plates (with a 15 mm hole in the center of the battery stack) and then connected to the diffractometer as well as a potentiostat (SP200, Biologic, France), as shown in Fig. S1 (available online in the Supporting Information at stacks.iop.org/JES/169/020554/mmedia). The cell was aligned in the direction of the X-ray beam on the basis of the most intense (003) reflection of the pristine CAM. Electrochemical cycling was done at a C-rate of C/10 (based on a nominal specific capacity of 300 mAh g−1 used throughout this study) in the cell voltage window between 2.0 and 4.8 V. The room temperature remained within 24 ± 2 °C. Diffractograms were recorded every 25 mAh g−1 (15 mAh g−1 when studying smaller voltage windows) during intermittent OCV periods of 50 min in the 2θ range of 6°–48° (Q range 0.9–7.2 Å−1, acquisition time ≈40 min, start after the first ≈5 min of the OCV break). The XPD patterns were collected at fixed SOCs of 0, 25, 50 mAh g−1, etc. for all succeeding cycles (plus additional diffractograms after running into the cut-off voltages).
Ex-situ L-XPD measurements of cycled cathode electrodes were conducted in 0.3 mm Lindemann glass or borosilicate glass capillaries (both from Hilgenberg, Germany) in the 2θ range of 3°–60° (Q range 0.5–8.9 Å−1, acquisition time ≈14 h). For this, 2325-type coin cells with a cathode electrode (14 mm diameter), a lithium metal anode (15 mm diameter), two glass-fiber separators (16 mm diameter), and 80 μl of LP57 electrolyte were cycled at C/10 and 25 °C in the cell voltage window of 2.0–4.8 V to the desired SOC either during charge or discharge of the second cycle (Series 4000 battery cycler, Maccor, USA). The coin cells were opened in the glove box to harvest the cathode electrodes, and the scratched-off cathode electrode material, without any prior washing, was loaded and air-tightly sealed into the capillaries.
Some additional capillaries were sent to the Material Science beamline MS-X04SA of the Swiss Light Source (Paul Scherrer Institute, Villigen, Switzerland), where they were stored for ≈5 months prior to the measurements. 42 X-ray diffractograms were measured at ambient temperature in Debye–Scherrer geometry using synchrotron radiation at 22 keV (0.5646 Å; equipped with a Si(111) double-crystal monochromator and Mythen II microstrip detector) in the 2θ range of 1°–90° (Q range 0.2–15.7 Å−1, exposure time 4 min sample, one data point every 0.0036°/2θ), which will further on be abbreviated as ex-situ "S-XPD" measurements.
Neutron powder diffraction
Since the ex-situ NPD measurements require (cycled) CAM in the gram scale, we assembled hand-made multi-layer pouch cells in our laboratory, which consisted of two single-sided and two double-sided cathode sheets (i.e., in total six cathode layers at 9 cm2 each). Their loading deviation was set to be less than 0.5 mgCAM cm−2 per layer and the absolute capacity of the pouch cells amounted to ≈260 ± 50 mAh (based on a nominal specific capacity of 300 mAh g−1). Three over-sized lithium metal anodes (10.9 cm2) were placed between the cathode sheets, alternating within total six glass-fiber separators (14.4 cm2) and packed in a battery pouch foil (40 μm-thick Al layer, DNP, Japan) with 2.4 ml of LP57 electrolyte. As done above for the coin cells, the pouch cells were cycled at C/10 and 25 °C in the voltage window of 2.0–4.8 V (and fixed in a cell holder with a homogeneous compression of ≈2 bar). After reaching the desired SOC in either charge or discharge direction within the first two cycles, the cells were opened in the glove box to harvest the cathode electrodes. For this, the cathode electrodes were scratched off the Al foil with a scalpel, hand-mixed in a mortar using the material from three nominally identical cells, and dried overnight in a vacuum oven at room temperature. The samples were loaded in thin-walled 6 mm vanadium cans (thickness 0.15 mm), which were metal-sealed using an indium wire (loading ≈1.7 ± 0.1 gCAM; for the pristine CAM powder, a 10 mm vanadium can was used). A tiny fraction of the cathode electrode material was filled in X-ray capillaries for ex-situ L-XPD measurements.
The samples were prepared within two weeks prior to the high-resolution neutron powder diffraction (NPD) measurements at the SPODI beamline of the research reactor FRM II (Garching, Germany), which operates in Debye–Scherrer geometry with thermal neutrons at a constant wavelength of 1.5481 Å by using a Ge(551) monochromator and a 3He multidetector system. 43 The NPD patterns were collected at ambient temperature for constantly rotating samples in the 2θ range of 1°–152° (Q range 0.1–7.9 Å−1, acquisition time ≈5 h sample, one data point every 0.05°/2θ) and afterwards corrected for geometrical aberrations and detector nonlinearities, as described by Hoelzel et al. 43 To perform a joint refinement of L-XPD and NPD data, X-ray diffractograms of the same samples were recorded in parallel at our in-house instrument.
Analysis of diffraction data
The structural complexity of Li- and Mn-rich layered oxides first raises the question about the proper structural model if it comes to the analysis of diffraction data. 10,12 The incorporation of additional lithium in the TM layer causes an in-plane Li/TM ordering of the pristine LMR-NCM materials, which becomes visible as small, typically very broad superstructure peaks in the powder diffraction patterns. 10,44 In the literature, the authors choose most commonly between three different models: (i) the rhombohedral model (R−3m) known from conventional layered oxides, which neglects the in-plane ordering and distributes all ions randomly in the TM layer; 22,36,40 (ii) the monoclinic model (C2/m), which takes the ordering into account by dividing each layer into two crystallographic sites at a ratio of 1/2; 30,44 and, (iii) a composite model comprising a rhombohedral and monoclinic phase, which are typically assigned to the LiTMO2 and Li2MnO3 composition, respectively. 25,44 As none of our diffractograms show a clear splitting of the main reflections (e.g., of the (003) peak, as was observed by Konishi et al. 25 ), not even a shoulder, which would justify the application of the composite model, we do not use it in this work. Furthermore, it is well-known that the superstructure peaks gradually vanish within the first battery cycle(s), 45,46 which puts the monoclinic model in question. The monoclinic model also has more than double the amount of refinement parameters than the rhombohedral model, which involves the danger of severe correlations between interdependent (structural) parameters. All these considerations make the rhombohedral model the main approach to analyze diffraction data in the course of this work, as was done previously by Kleiner et al. 36
Standard reference materials (i.e., silicon and at the synchrotron also NAC (Na2Ca3Al2F14)) were measured before each set of samples. Silicon was used to perform an angle correction of the L-XPD raw data with the WinXPOW software 47 and to determine the accurate wavelength of the X-ray and neutron beamline. In addition, silicon and NAC were used to determine the instrumental peak broadening with the Thompson-Cox-Hastings pseudo-Voigt function, whose parameters were fixed during the subsequent refinement of the samples. The diffraction data were all refined with the software package TOPAS. 48
The in-situ L-XPD data are used to monitor the lattice parameters during the initial cycles. Here, the rhombohedral model is the common approach in the literature. 23,49,50 To extract the lattice parameters a and c as well as the unit cell volume V, the LMR-NCM phase was refined with a structure-independent Pawley fit. The multi-pattern datasets were analyzed by means of sequential refinements, which also include the Al reflections in the diffractograms. The error of the extracted lattice parameters is on the order of ≈0.01%–0.05% (based on their estimated standard deviations relative to the refined values), which is deemed to be sufficiently precise, as the lattice parameters change by a few percent during a charge/discharge cycle. For the mid-lithium material (δ = 0.17), the state of charge of each diffraction pattern was converted into the overall lithium content, xLi, by considering its theoretical specific capacity (350 mAh g−1, using the above described results from elemental analysis) and its total lithium content (i.e., 1 + δ = 1.17 based on the Li[Liδ TM1−δ ]O2 notation):

Here, it is assumed that the electrochemically measured capacity solely originates from lithium insertion/extraction into the LMR-NCM material and that the extent of parasitic reactions is negligible. The OCV value of each diffractogram was averaged from the last minute of the 50 min OCV step used for data collection, where the remaining voltage relaxation, dV/dt, was in the range of ≈5–25 mV h−1 (depending on SOC and charge/discharge; for OCV holds of 10 h, it was <1 mV h−1). According to Croy et al., this approach closely represents the OCV function of the CAM at the time scales of interest. 23
All ex-situ data of the mid-lithium material were processed by Rietveld refinements. Here, the site occupancy factors are of particular interest, since they might provide insights into the lithium de-/intercalation mechanism and the migration of transition metals into the lithium layer. Important refinement details are given in paragraph S3 of the Supporting Information. Regarding the joint refinement of L-XPD and NPD data, some parameters (viz., background, zero shift, absorption, peak broadening, and scale factor) were refined on a local level independent for each dataset, whereas the lattice parameters and structural parameters (viz., fractional coordinates, atomic displacement parameters, and site occupancy factors) were optimized on a global level together for both datasets. We used three different structural models, which will be introduced as the extended rhombohedral model 1, the simplified rhombohedral model 2, and the monoclinic model 3 in the Results and Discussion section (together with the corresponding refinement results).
Beyond the Supporting Information, we also attached the diffraction raw data of the ex-situ L-XPD and NPD samples (.xy and .xye file types) as well as the input files for the TOPAS refinement program (.inp file type) as supplementary data to this work (see attached .zip folder which comprises all above files). With the LMR-NCM_Pawley_Refinement.inp input file, the lattice parameters and the sample broadening can be optimized in a first step by means of an independent Pawley fit for each dataset, while LMR-NCM_Rombohedral_Refinement.inp and LMR-NCM_Monoclinic_Refinement.inp allow for testing the (joint) Rietveld refinement of the here presented structural models (and beyond).
DFT simulation
Spin-polarized calculations in the framework of DFT have been performed using the Vienna Ab-initio Simulation Package (VASP) 51–54 with projector augmented wave pseudopotentials. 55,56 The exchange-correlation functional of choice is the strongly constrained and appropriately normed (SCAN) meta-generalized gradient approximation supplemented with the long-range van der Waals interaction from rVV10, the revised Vydrov-Van Voorhis nonlocal correlation functional, which performs very well on layered compounds. 57 Within a 4 × 5 × 1 supercell of the conventional rhombohedral cell, all structures have been fully relaxed until the forces were lower than 10−2 eV·Å−1 with a cut-off energy of 600 eV at the Γ-point only, which is justified by the large dimensions of the supercell. In selected cases, a pre-relaxation by means of short molecular dynamics at 300 K helped to find a better local minimum. Because VASP cannot handle partial occupancies, structures with integer occupancies compatible with the experimental site occupancy factors have been generated with the combinatorial approach implemented in the supercell software. 58
The material with the mid-lithium composition, Li[Li0.17Ni0.19Co0.10Mn0.54]O2, has been simulated with a 4 × 5 × 1 supercell of the conventional rhombohedral cell and thus contains 60 formula units. The supercell contains 72 Li (60 in the Li layer and 12 in the TM layer), 12 Ni, 6 Co, 30 Mn and 120 O that corresponds to the formula unit (f.u.) Li1.2Ni0.2Co0.1Mn0.5O2 of the model composition (which represents the over-lithiation degree of the high-lithium material, since simulating the precise lithium content of the mid-lithium material would have required an excessively large supercell). With a supercell of this size, the sheer number of possible ways to distribute the cations into the Li and TM sub-lattices is astronomical. A good structural candidate has been determined by letting the combinatorial calculator supercell find the cation distribution with the lowest electrostatic energy within a point-charge approximation based on given oxidation states (viz., Li+, Ni2+, Co3+, Mn4+, and O2−). The key features associated with the progressive delithiation of the material are analyzed by investigating structural models at different Li contents and comparing their thermodynamic stability at each composition. Already at this point, it is important to reiterate that the extremely large configurational space renders it virtually impossible to determine with certainty the true ground state for a given composition (bar the construction of an exhaustive compositional phase diagram, which falls beyond the scope of this work). Calculation of the voltage profile also requires the knowledge of the compositional convex hull. Therefore, we will not report on voltages but rather compare the total energies of structures with the same composition.
Results and Discussion
SOC dependence of lattice parameters
Most of our previous work on Li- and Mn-rich layered oxides, including studies about their gassing behavior, 59 resistance build-up, 17 and the irreversible TM migration during long-term cycling, 36 used exclusively materials with a medium degree of over-lithiation (δ = 0.17). Here, the work of Teufl et al. revealed a path-dependent resistance hysteresis of this particular LMR-NCM within a charge/discharge cycle. 17 It is thus reasonable to focus first on a very similar CAM to monitor its lattice parameters during the first battery cycles and to look for any structural hysteresis behavior. Figure 1 shows the results from two in-situ L-XPD measurements of the mid-lithium material, whose pristine composition was determined to be Li[Li0.17Ni0.19Co0.10Mn0.54]O2 by elemental analysis. The voltage curves obtained in a half-cell (i.e., with a lithium metal anode) and the lattice parameters (i.e., a, c, and the unit cell volume V; as based on the rhombohedral model) are plotted vs the exchanged capacity (upper x-axis) and the lithium content, xLi (lower x-axis), of the CAM, which are equivalent measures of the state of charge (see Eq. 1). Three consecutive cycles (the first cycle in black and the 2nd and 3rd cycle in blue and green, respectively) of one cell operated at C/10 in the full voltage window of 2.0–4.8 V are compared to the first cycle (in red) of another cell, that was reversed at 4.2 V, just before reaching the activation plateau. The electrochemistry matches our previous work and is not affected by the simplified pouch cell setup or X-radiation, with the expected capacities of ≈313 mAh g−1 for the first activation charge and ≈276–264 mAh g−1 for the following discharge cycles. The vertical spikes in the voltage curves indicate the intermittent OCV periods used for XPD data collection. Connecting the final OCV values at each SOC, as exemplarily done for cycle 3 in Fig. 1a, makes it obvious that the main part of the voltage hysteresis, especially in the mid-SOC regime, is maintained during OCV and reaches almost up to ≈400 mV.

Figure 1. Lattice parameter evolution of the mid-lithium LMR-NCM (δ = 0.17) during the initial cycles, as obtained from two independent in-situ L-XPD experiments in a half-cell configuration (i.e., with a lithium metal anode). "Cycle 1–3" were measured at C/10 in the full voltage window of 2.0–4.8 V, whereas the curve labeled "no activation" shows the first cycle in the smaller window of 2.0–4.2 V. The diffractograms were collected during OCV breaks every 25 and 15 mAh g−1, respectively. The panels show from top to bottom (a) the voltage curves, (b) the lattice parameter a, (c) the lattice parameter c, and (d) the unit cell volume V as a function of the overall lithium content, xLi (lower x-axis), which was calculated according to the respective SOC (upper x-axis, see Eq. 1). In panel (a), the OCV share of the total voltage hysteresis is shown for cycle 3 by the green shaded area. The right y-axes illustrate the lattice parameter changes in percentage terms relative to the pristine state.
Download figure:
Standard image High-resolution imageLet us now turn towards the lattice parameters. We directly discuss the refinement results, because the raw data do not contribute any additional information. For the sake of completeness, paragraph S1 of the Supporting Information (SI) shows a contour plot of the in-situ L-XPD patterns of "Cycle 1–3" and two Pawley fits in the discharged and charged state, respectively (see Figs. S2 and S3). At a first glance, the lattice parameters a and c in Fig. 1 seem to resemble the voltage characteristics: the first-cycle charge curve that differs from the subsequent charge curves (Fig. 1a) is reflected in the behavior of a (Fig. 1b) and c (Fig. 1c) that also show different functionalities in the first compared to the subsequent cycles. The first-cycle activation charge (upper black line in Fig. 1a) can be divided into a sloping region until ≈4.4 V (corresponding to 1.17 > xLi > 0.76) and an extended voltage plateau at ≈4.5 V (0.76 > xLi > 0.23). In a similar manner, the lattice parameters change monotonically in the sloping region (lower black lines in Figs. 1b and 1c), then remain approximately constant during the voltage plateau, and move (slightly) back at the end of the first charge. Following the activation, there is a drastic change of the lattice parameters, which also feature a pronounced hysteretic behavior during charge and discharge. Former in-situ XPD studies have seen similar lattice parameter trends within the initial cycles, e.g., for Li[Li0.20Ni0.15Co0.10Mn0.55]O2 by Mohanty et al. 50 and for Li[Li0.20Ni0.20Mn0.60]O2 by Croy et al., 23 but the hysteresis in the evolution of the lattice parameters over a charge/discharge cycle was not so obvious there, as in the former study the lattice parameters were only plotted vs time while in the latter study there were too few data points over a charge/discharge cycle. To the best of our knowledge, only Konishi et al. reported a clear lattice parameter hysteresis for Li[Li0.20Ni0.13Co0.13Mn0.54]O2, whereby the hysteresis was assigned to the LiTMO2-like phase in their 2-phase refinement with a composite model comprising a rhombohedral (LiTMO2-like) and monoclinic (Li2MnO3-like) phase. 25
Since Li- and Mn-rich layered oxides are closely related to conventional NCM materials, most authors apply the same structural and electronic considerations to explain the change of the lattice parameters. The lattice parameter a reflects the intra-layer nearest-neighbor distances, which are all the same for Li-Li in the Li layer, TM-TM in the TM layer, and O-O in the O layer, respectively. As the transition metals decrease their ionic radii upon oxidation, the contraction of the lattice parameter a during charging is however dominated by the TM-TM distance. 32,60 As shown in Fig. 1b (lower black line), the lattice parameter a decreases by ≈0.8% from ≈2.854 to ≈2.831 Å during the sloping region of the first charge and remains almost constant afterwards. This result fits to several spectroscopic studies, 24,30,61 which have shown that the TM oxidation only occurs during the first part of the activation. Assuming that all TMs get oxidized to their 4+ state, starting from Ni2+, Co3+, and Mn4+ in the pristine material, the TM redox can theoretically compensate for 144 mAh g−1 (ΔxLi = 0.48), what is reasonably close the exchanged capacity of ≈123 mAh g−1 (ΔxLi ≈ 0.41) until the end of the sloping voltage region at 4.4 V. If the cycling is restricted to this region, i.e., if the charge is stopped prior to reaching the subsequent voltage plateau at ≈4.5 V, the lattice parameters move reversibly back (see red lines labeled "no activation" in Fig. 1). Such a "non-activated" LMR-NCM shows no voltage fade over extended cycling and thus may be considered as a conventional layered oxide. 17 On the other hand, after a full activation charge to 4.8 V, the lattice parameter a changes afterwards between ≈2.874 and ≈2.834 Å (Δa/apristine ≈ 1.4%) in a hysteresis loop (see upper black as well as green and blue lines in Fig. 1b). It thus exceeds its value in the pristine material by ≈0.02 Å (≈0.7%) at the end of discharge. This could be explained by the additional activation of the Mn3+/Mn4+ redox couple, as was evidenced through HAXPES measurements by Assat et al. (≈10% Mn3+ in the discharged state). 24,62
The lattice parameter c is a measure of the inter-layer distances. Due to the alternating stacking of O-Li-O and O–TM–O layers, c can be separated into a lithium, hLi, and TM layer height, hTM, respectively. 33 De Biasi et al. have investigated many regular NCM materials, ranging from NCM-111 to NCM-851005, by operando XPD. 32 In their study, the lattice parameter c increases by ≈1.5% until the delithiation reaches xLi values of ≈0.4–0.5, what is explained by the increasing Coulomb repulsion of O2− anions facing each other in the depleting Li layers (and thus referring to the hLi component). Upon further delithiation, c falls back and even below the value in the discharged (lithiated) state, reaching up to minus 4.7% for NCM-851005 (at xLi ≈ 0.1). The repulsive interactions get diminished through an increasing covalent bond character between the transition metals (especially Ni) and oxygen, which in turn reduces the effective negative charge of the O atoms. 32,34,63 Thus, oxygen is involved into the charge compensation of regular layered oxides, but its participation is confined to the standard TM-O hybridization model. This model is not sufficient for Li- and Mn-rich layered oxides, which experience a TM-independent anionic redox during cycling (typically expressed as O2−/On− redox, n < 2). 24,30,61 According to these spectroscopic studies, the anionic redox gets activated during the voltage plateau at ≈4.5 V in the first charge and stays present in the following cycles. In general, the lattice parameter c of the mid-lithium LMR-NCM resembles the trends known from regular NCMs, with c increasing until a delithiation level of xLi ≈ 0.4 and then decreasing again (see Fig. 1c). The magnitude of this change in c is however significantly smaller. The maximum difference Δc/cpristine amounts to less than 1% within one cycle. This damping effect could be rationalized by the O2−/On− redox, which distributes over the entire SOC range after activation. 24,62 Assuming that the anionic redox scales approximately linearly with the extent of delithiation, it reduces the Coulomb repulsion at high xLi values (i.e., low SOCs), what in turn diminishes the c increase at xLi > 0.4. For xLi < 0.4 (i.e., high SOCs), the anionic redox might compete with the TM–O hybridization, 64 thus damping the subsequent decrease of c. Please note that the Ni–O bonding (important for Ni-rich stoichiometric oxides) tends towards stronger covalency than the Mn–O bonding (important for Mn-rich over-lithiated oxides), which has a more ionic nature. 65 Assat et al. report that the O2−/On− redox is not evenly distributed during charge and discharge. 24 This could explain the hysteretic behavior of c, which does not manifest as a simple hysteresis loop. In contrast to the lattice parameter a, the charge and discharge curves of c intersect at ≈0.67 and ≈0.40. Furthermore, their maxima are shifted on the xLi axis (viz., at ≈0.42 during charge and at ≈0.33 during discharge; as highlighted by the grey bars in Fig. 1c). At this point, we have to call to mind that the lattice parameter c consists of two individual layer heights, hLi and hTM, which might evolve quite differently compared to their summed-up value of c. Their calculation however requires the z-coordinate of oxygen from Rietveld refinements, what will be done later.
Let us examine once again the first activation charge. As discussed above, the Li- and Mn-rich layered oxide can be regarded as a regular NCM material in the sloping region, i.e., a decreases due to TM oxidation and c increases due to Coulomb repulsion of the O2− anions. During the voltage plateau, where the lattice parameters remain almost constant, the anionic redox comes into play. Another not yet considered aspect is the lithium extraction, which includes both the lithium ions from the Li layer (LiLi) and from the TM layer (LiTM). Liu et al. investigated the delithiation process of Li[Li0.20Ni0.15Co0.10Mn0.55]O2 by operando NPD. 66 They determined the LiLi/LiTM extraction ratio to be ≈24/1 in the sloping region and ≈2.6/1 in the plateau region at ≈4.5 V, and also found out that LiTM cannot be re-intercalated during the subsequent discharge. Hence, the lithium ions in the TM layer get predominantly and permanently removed in the voltage plateau region during the first charge. It is however difficult to estimate the consequences for the lattice parameters, because the LiTM removal goes along with the depopulation of LiLi-O-LiTM configurations 64 and the loss of in-plane ordering in the TM layer. 31,46 Both processes connect the LiTM removal to the anionic redox, as they make it energetically favorable. Even though most lithium ions in the TM layer are extracted during the activation charge, NMR measurements by Jiang et al. have shown that their complete removal might require up to ≈10 cycles. 46 This possibly explains why the lattice parameters increase irreversibly from cycle to cycle in Fig. 1 (e.g., when comparing the discharge curves of the lattice parameters). Here, the difference of the discharge curves between cycle 2 and 3 is smaller than between cycle 1 and 2. We also want to mention that the first three lattice parameter values of the first discharge (0.33 < xLi < 0.17) are shifted towards lower values compared to the preceding charge, probably due to a temporary misalignment of the pouch cell resulting from CAM gassing at the end of the activation charge (which also continues during OCV). 59 The comparison with a second in-situ L-XPD measurement (cell #2 in Fig. S4 of the SI) however shows that this artefact does not affect the progression of the lattice parameters.
The unit cell volume V (see Fig. 1d) represents the net response of the crystal lattice upon lithium insertion/extraction. Its behavior is similar to that of the lattice parameter a, also showing a hysteresis loop after the first activation cycle. This resemblance is reasonable because a affects the unit cell volume to the second power (according to  ) and the relative changes of a are larger than for c. The unit cell volume is an important measure for the tendency of a CAM particle to crack during cycling. The larger the volume change, the larger the mechanical stress of the particles due to (i) the anisotropic change of the lattice parameters a and c and (ii) the different orientation of the primary particles inside the secondary agglomerates of a typical polycrystalline CAM.
63,67
In Table I, we compare the relative lattice parameter changes of the over-lithiated NCM in Fig. 1 with two regular NCMs from the study of de Biasi et al.
32
In their work, NCM-111 and NCM-851005 are the end members with respect to the range of Ni content (33%Ni vs 85%Ni on TM basis). It is well-known in the literature that the degree of cracking increases with the Ni content
63,67
and with the upper cut-off potential.
68,69
Since increasing both parameters yields higher delithiation levels (i.e., lower xLi,cha values), this trend can be explained in good approximation by the steep volume contraction at xLi values smaller than ≈0.3.
32,70
The overall volume contraction of the mid-lithium LMR-NCM (amounting to ‒1.1% during activation and ‒3.0% reversibly in the following cycles) is much closer to NCM-111 (‒2.3%) than to NCM-851005 (‒8.0%), even though its delithiation level (xLi,cha = 0.13) resembles the latter one (0.09). This discrepancy is largely driven by the smaller change of the lattice parameter c, whereas the reversible change of a is rather similar among the different CAMs. Despite the broader SOC range of Li- and Mn-rich layered oxides, we thus hypothesize that they are less prone to particle cracking and its detrimental consequences (such as CAM loss, TM dissolution, and surface reconstruction) than their Ni-rich (polycrystalline) competitors.
) and the relative changes of a are larger than for c. The unit cell volume is an important measure for the tendency of a CAM particle to crack during cycling. The larger the volume change, the larger the mechanical stress of the particles due to (i) the anisotropic change of the lattice parameters a and c and (ii) the different orientation of the primary particles inside the secondary agglomerates of a typical polycrystalline CAM.
63,67
In Table I, we compare the relative lattice parameter changes of the over-lithiated NCM in Fig. 1 with two regular NCMs from the study of de Biasi et al.
32
In their work, NCM-111 and NCM-851005 are the end members with respect to the range of Ni content (33%Ni vs 85%Ni on TM basis). It is well-known in the literature that the degree of cracking increases with the Ni content
63,67
and with the upper cut-off potential.
68,69
Since increasing both parameters yields higher delithiation levels (i.e., lower xLi,cha values), this trend can be explained in good approximation by the steep volume contraction at xLi values smaller than ≈0.3.
32,70
The overall volume contraction of the mid-lithium LMR-NCM (amounting to ‒1.1% during activation and ‒3.0% reversibly in the following cycles) is much closer to NCM-111 (‒2.3%) than to NCM-851005 (‒8.0%), even though its delithiation level (xLi,cha = 0.13) resembles the latter one (0.09). This discrepancy is largely driven by the smaller change of the lattice parameter c, whereas the reversible change of a is rather similar among the different CAMs. Despite the broader SOC range of Li- and Mn-rich layered oxides, we thus hypothesize that they are less prone to particle cracking and its detrimental consequences (such as CAM loss, TM dissolution, and surface reconstruction) than their Ni-rich (polycrystalline) competitors.
Table I. Comparison of lattice parameter changes in regular NCMs and in the mid-lithium LMR-NCM. The NCM data were taken from the operando XPD study of de Biasi et al. and present the therein investigated NCM materials with the lowest (NCM-111, 33%Ni on TM basis) and highest Ni content (NCM-851005, 85%Ni), respectively.
32
As in our work, the CAMs were cycled in half-cells at C/10, but in the voltage window of 3.0–4.6 V. The lattice parameter changes are given as the difference between the completely discharged (lithiated, xLi,dis) and charged (delithiated, xLi,cha) state of the respective charge cycle and are normalized to the starting value (in a given particular cycle). For the unit cell volume V, this procedure always yields the maximum difference within a cycle, whereas a and c might run through minima and maxima, respectively. The ΔxLi range is calculated according to 
| Material | Cycle | xLi,dis [−] | xLi,cha [−] | ΔxLi [−] | Δa/a0 [%] | Δc/c0 [%] | ΔV/V0 [%] |
|---|---|---|---|---|---|---|---|
| Regular NCMs 32 | |||||||
| NCM-111 | 4 (reversible) | 0.94 | 0.21 | 0.73 | ‒1.2 | ±0.0 | ‒2.3 |
| NCM-851005 | 4 (reversible) | 0.89 | 0.09 | 0.80 | ‒1.7 | ‒4.7 | ‒8.0 |
| Over-lithiated NCMs | |||||||
| Mid-lithium LMR-NCM | 1 (activation) | 1.17 | 0.13 | 1.04 | ‒0.7 | +0.3 | ‒1.1 |
| Mid-lithium LMR-NCM | 2 + 3 (reversible) | 1.04 | 0.13 | 0.91 | ‒1.3 | ‒0.3 | ‒3.0 |
The "no activation" dataset in Fig. 1 revealed that the structural hysteresis observed in cycle 2 and onwards is directly connected to the activation plateau at ≈4.5 V. This raises the question if there is any chance to re-establish the pre-activated state without hysteresis even after passing this plateau. Therefore, we performed a charge window opening experiment. 24,25 After two cycles in the full voltage window of 2.0–4.8 V to activate the mid-lithium LMR-NCM material, Fig. 2 shows three consecutive cycles, where the upper cut-off voltage during charge was stepwise increased from 3.7 to 4.1 to 4.8 V, while always going back to 2.0 V during discharge. The extent of OCV hysteresis (see Fig. 2a) and lattice parameter hysteresis (exemplary shown for the unit cell volume in Fig. 2b) depends on the SOC range (equivalent to ΔxLi) that the CAM has passed through in every single cycle. Konishi et al. made the same observation for the OCV as well as the lattice parameters a and c of the LiTMO2-like phase in their 2-phase refinement. 25 For the smallest SOC window of ≈74 mAh g−1 (ΔxLi ≈ 0.25) measured until 3.7 V (black lines in Fig. 2), the charge/discharge values of the unit cell volume agree within the error of measurement, while the OCV differs by a maximum of ≈60 mV (at xLi ≈ 0.92). Since the voltage relaxation is not completed after 50 min resting (dV/dt ≈ 5 mV h−1), this difference would get even smaller during a prolonged OCV step. Hence, the fully activated LMR-NCM exhibits almost no path dependence when cycled under this condition, but the hysteresis grows strongly when charged further (blue and green lines). As already described for the voltage by Assat et al., 24 the in-situ L-XPD data also show on a structural level that the hysteresis raises mainly at the end of charge and stays open until the end of the discharge. Furthermore, the voltage and lattice parameter hysteresis must have the same driving force. In Fig. S5 in paragraph S2 of the SI, this measurement is contrasted with a discharge window opening experiment.
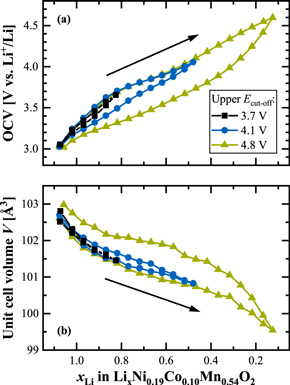
Figure 2. Charge window opening experiment at C/10 with the fully activated mid-lithium LMR-NCM (after 2 activation cycles between 2.0–4.8 V), where the upper cut-off voltage is stepwise increased from 3.7 to 4.1 to 4.8 V (lower cut-off voltage fixed to 2.0 V, what is also the starting point). As a function of the lithium content, panel (a) shows the open circuit voltage, at which the diffractograms were measured every 15 mAh g−1, and panel (b) depicts the unit cell volume from the corresponding Pawley fits.
Download figure:
Standard image High-resolution imageOCV dependence of lattice parameters
Since the diffractograms were measured under open circuit voltage conditions, the lattice parameters of the mid-lithium material in Fig. 1 are re-plotted in Fig. 3 vs the OCV value averaged over the last minute of the 50 min rest phase. Here, we directly see a completely different dependency than when plotted vs the state of charge as was done in Fig. 1: When plotted vs OCV, the lattice parameter a exhibits almost no hysteresis between charge and discharge after the first activation charge (see Fig. 3a). Only upon closer inspection, it can be noticed that the a values during charge are slightly higher than during discharge (directions marked by arrows) for OCVs smaller than ≈4.0 V, where both curves intersect (this subtle difference was not be resolved in the study by Konishi et al. 25 ). Interestingly, the "no activation" data (red lines) coincide perfectly with the charge curve. In the previous paragraph, we assigned any changes of a as to mainly originating from TM redox activities, which are initially restricted to the potential range of ≈3.6–4.2 V, but expand to lower potentials after activation (probably due to Mn3+/Mn4+ redox). As the hysteresis of a when plotted vs OCV is negligibly small (Fig. 3a) compared to when it is plotted vs SOC (Fig. 1b), the TM redox seems to be uniquely associated with the thermodynamic state of the CAM that is marked by the OCV, whereas there seems to be no causal relationship to the lithium content. In contrast, the lattice parameter c still shows a hysteretic behavior even when plotted vs OCV (as shown in Fig. 3b). Due to the large voltage drop after current reversal at the upper cut-off, the maximum of the charge curve, that was at a lower SOC than during discharge (see Fig. 1c), is now at a higher OCV than the discharge curve (viz., at ≈4.15 Vcharge vs ≈3.95 Vdischarge, as highlighted by the grey bars).
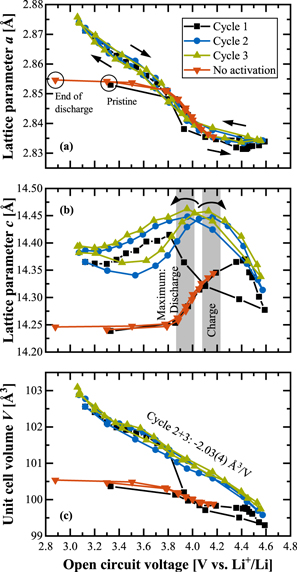
Figure 3. Lattice parameter data (taken from Fig. 1) for the mid-lithium LMR-NCM shown as a function of OCV at which the diffractograms were collected during the in-situ L-XPD experiments. (a), (b) Evolution of the lattice parameters a and b during the first three cycles at C/10. (c) Evolution of the corresponding unit cell volume, whereby the linear regression of the "cycle 2+3" data results in V = 109.0(1) Å3 ‒ 2.03(4) Å3/V · OCV, with R2 = 0.985.
Download figure:
Standard image High-resolution imageThe most interesting observation is the behavior of the unit cell volume V (see Fig. 3c) which, within the accuracy of the in-situ L-XPD measurements, exhibits no hysteresis after the first activation charge, with V changing linearly with OCV by about ‒2 Å3 V−1. As for any given OCV, the lithium content (xLi) is different between the charge and the discharge reaction by up to ΔxLi ≈ 0.33 (see blue/green lines in Fig. 1a). The linear and direction-independent relationship between V and OCV in turn means that very different lithium contents can yield the same unit cell volume: for example, [Li0.75TM0.83O2]charge and [Li0.42TM0.83O2]discharge both have an OCV of ≈3.80 V and a unit cell volume of ≈101.3 Å3 within the second cycle. Such a behavior is quite remarkable and completely unknown for regular NCMs that exhibit no charge/discharge hysteresis and for which the lattice parameters uniquely scale both with the SOC and OCV. 41 The red lines in Figs. 1 and 3 show that the same is true for LMR-NCMs if they are not cycled into their activation plateau (labeled as "no activation"), contrary to the irreversible changes induced by cycling into the activation plateau.
So far, we only discussed the mid-lithium material, but it is also interesting to examine the lattice parameter changes for different degrees of over-lithiation. Figure 4 compares their OCV dependence during the second cycle for the already introduced mid-lithium material (δ = 0.17 in Li[Liδ TM1−δ ]O2, same data as in Fig. 3) as well as for a low- (δ = 0.14) and high-lithium material (δ = 0.20). Beyond that, the Mn-rich over-lithiated CAMs are contrasted with the Ni-rich stoichiometric NCM-811. A zoomed-in view of the data for only the LMR-NCMs is given in Fig. S6 in paragraph S2 of the SI.
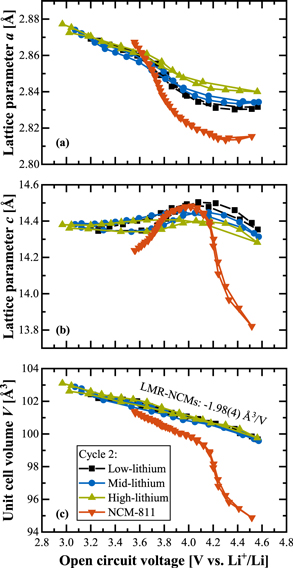
Figure 4. Evolution of the lattice parameters of three different LMR-NCMs during the second cycle (i.e., after activation) vs OCV, as determined from in-situ L-XPD experiments at C/10 in the voltage window of 2.0–4.8 V. The CAMs differ with respect to the degree of over-lithiation, ranging from a low-lithium (δ = 0.14) over a mid-lithium (δ = 0.17, same data as in Fig. 3) to a high-lithium material (δ = 0.20). They are additionally contrasted with stoichiometric NCM-811 (δ = 0.01), which was investigated at C/7.5 between 3.0–4.6 V (data taken from Fig. S6 in the SI of Friedrich et al., 41 published by ECS, licensed as CC BY 4.0). In panel (c), the linear regression of all three LMR-NCMs results in V = 108.9(1) Å3 ‒ 1.98(4) Å3/V · OCV, with R2 = 0.977.
Download figure:
Standard image High-resolution imageStarting again with the lattice parameter a, Fig. 4a shows that a decreases as the OCV increases from ≈3.6 to 4.2 V (i.e., in the region that is ascribed to the Ni2+/Ni3+/Ni4+ and Co3+/Co4+ redox). The decrease is the higher the lower the degree of over-lithiation, with a decreasing to only ≈2.840 Å for the high-lithium material while decreasing to ≈2.833 and ≈2.830 Å for the mid- and low-lithium material, respectively. The lower the degree of over-lithiation, the more transition metals are present in the transition metal layer and the lower is their average oxidation state (i.e., 3.33+, 3.41+, and 3.50+ in the pristine LMR-NCMs with low-, mid-, and high-lithium content, respectively; according to (3−δ)/(1−δ)). Consequently, for lower over-lithiation, more charge can be compensated by the classical TM redox until their formal 4+ state, apparently resulting in the observed larger a parameter changes. The lattice parameter a of NCM-811 varies exactly in the same voltage window, but its change is ≈2–3 times stronger (note that the average TM oxidation state is 3+ in pristine stoichiometric NCMs, because δ is essentially 0). The rise of a at potentials below ≈3.6 V (better visible in Fig. S6), which only occurs after activation and is not present in NCM-811, increases with increasing over-lithiation. It is reaching both lower OCV values (viz., from ≈3.20 Vlow to ≈2.97 Vhigh at the end of the second discharge) and higher a values (viz., from ≈2.869 Ålow to ≈2.877 Åhigh; same data points). This trend could be explained by an increasing Mn3+/Mn4+ redox fraction, 24,62 which is a concomitant feature of the anionic redox. To the best of our knowledge, there is no spectroscopic comparison of several Li- and Mn-rich layered oxides in one single publication, but the strong increase of irreversible O2 loss (at the end of the activation charge; as was studied by Teufl et al. 13 ) suggests that its reversible O2−/On− redox counterpart also grows with increasing over-lithiation. This argument is in line with the increasing damping effect of the lattice parameter c (as shown in Fig. 4b). Both the initial rise (due to Coulomb repulsion) and the following drop (due to TM-O hybridization) get reduced with increasing over-lithiation and are much smaller compared to NCM-811, because the anionic redox most likely competes with the afore-mentioned electrostatic effects.
Despite the shifting ratio of cationic and anionic redox, which becomes visible in the individual lattice parameters a and c, the unit cell volume V vs OCV is essentially identical among the investigated LMR-NCMs, with a uniform slope of about ‒2 Å3 V−1 (see Fig. 4). This indicates that the V = f(OCV) representation is some kind of universal curve, as it uniquely describes all three LMR-NCMs independent of their degree of over-lithiation. There is obviously a close relationship between the crystal lattice dimensions and the open circuit voltage, but we do not yet know which structural and/or electronic parameter(s) command them.
As already noted above, the overall relative volume change of ΔV/V0 ≈ 2.5%–3.0% in the second cycle over an SOC range of ΔSOC ≈ 240–270 mAh g−1 CAM for all of the here examined LMR-NCMs, almost independent of their degree of over-lithiation (δ = 0.14–0.20), is much smaller than that of NCM-811 that exhibits ΔV/V0 ≈ 6.3% for ΔSOC ≈ 220 mAh g−1 CAM. Based on this, one would expect that the tendency for CAM particle cracking should be reduced for LMR-NCMs compared to Ni-rich NCMs.
Determination of the lithium and transition metal layer heights
Before discussing possible reasons of the observed hysteresis phenomena, let us first deconvolute the lattice parameter c. This requires a determination of the z-coordinate of oxygen, z6c,O, in order to calculate the lithium, hLi, and TM layer heights, hTM, according to 60


Please note that the definition of the 3a/3b sites as Li/TM layers might also be opposite to that which is used in some instances in the literature.
The layer heights are a good starting point for Rietveld refinements. Liu et al. have shown in a detailed study about the sensitivity of the analysis of diffraction data (with stoichiometric NCA as a test case) that z6c,O is barely correlated to any other structural parameter. 39 It is thus the structural parameter that can be determined most accurately from X-ray powder diffraction data. Since in-situ data are usually biased due to overlapping reflections from other cell components (e.g., Al) 41 and have low counting statistics (in particular at laboratory diffractometers), which makes the detailed evaluation of structural parameters (other than lattice parameters) really challenging, we decided to rely just on ex-situ data for Rietveld refinements. Here, the cathode was cycled to the desired SOC, then the CAM powder was scratched off and air-tightly sealed in capillaries (see Experimental section for more details). Focusing on the quasi-reversible hysteresis after activation, Fig. 5 shows the Rietveld refinement results of the mid-lithium material within the second cycle, where ex-situ L-XPD measurements were conducted every ≈50 mAh g−1 during charge/discharge (blue circles/lines). Additionally, we sent some samples to the Swiss Light Source to obtain high-quality ex-situ S-XPD data (green triangles). The two upper panels of Fig. 5 compare the lattice parameters to the in-situ L-XPD data from V 1 (black squares/lines), while the layer heights, hLi and hTM, derived from the ex-situ XPD data are depicted in the two lower panels.
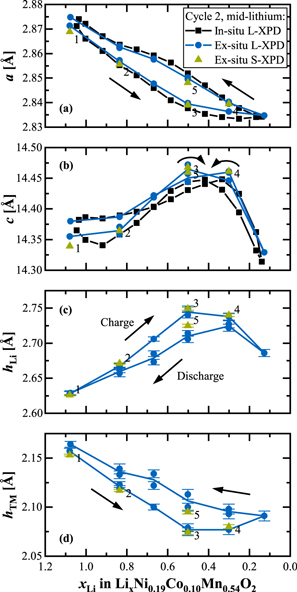
Figure 5. Determination of structural parameters over the course of the second charge/discharge cycle of the mid-lithium LMR-NCM material based on ex-situ XPD data from harvested electrodes, either acquired at the laboratory diffractometer (L-XPD; blue circles, with blue lines connecting their average values) or at the synchrotron (S-XPD; green triangles, labeled with numbers: 1/2/3 on the charge branch and 4/5 on the discharge branch). (a), (b) Lattice parameters a and c derived from ex-situ L-XPD and S-XPD data, including a comparison with the in-situ L-XPD derived data shown in Fig. 1. (c), (d) Determination of the lithium layer height, hLi, and of the transition metal layer height, hTM, via Rietveld refinements using the following rhombohedral model: [Lix−uNiv]3a[LiuTM0.83−v]3b[Ow]6c with uLi = 0 (except for the completely discharged samples with xLi > 1, so that the occupation of the Li layer would be mistakenly greater than 1) and wO = 1. The error bars correspond to the estimated standard deviation (e.s.d.) of each sample, as given out by the refinement program. Please note that some points of the ex-situ L-XPD dataset were measured twice with two independent samples.
Download figure:
Standard image High-resolution imageThe lattice parameters a and c derived from ex-situ L-XPD data are in good agreement with those derived from in-situ L-XPD data and show the same characteristic hysteresis features. For the lattice parameter a in Fig. 5a, the ex-situ determined hysteresis loop (blue circles/line) is however slightly smaller, as the data points lie consistently in between the in-situ determined values (black squares/line). This might be due to a continued relaxation of the material within the first hours and days after transitioning into the OCV condition. In contrast, the lattice parameter c (see Fig. 5b) is shifted upwards for most of the ex-situ derived data, especially at xLi values smaller than ≈0.8. Even though the shifts of a and c are not all in the same direction, the observed differences could be at least partially explained by a small misalignment of the in-situ pouch cell (see also Fig. S4 of the SI). Whatever the reason for these relatively small differences might be, a comparison of the ex-situ L-XPD derived lattice parameters that were measured within a few days after cell disassembly (blue circles) and those obtained by ex-situ S-XPD that were measured only after ≈5 months (green triangles) are in excellent agreement. This proves that the extended storage in the glass capillaries does not affect the harvested electrode samples (in call cases, the samples were sealed into the glass capillaries immediately after harvesting the electrodes), which is an important prerequisite for the much more time-consuming NPD experiments presented later. Furthermore, we can conclude here that the ex-situ approach is suitable for the quantification of detailed structural parameters under defined state of charge conditions.
The individual components hLi and hTM of the lattice parameter c are derived from ex-situ XPD data and presented in Figs. 5c and 5d, respectively. Surprisingly, their hysteresis behavior is much simpler than that of c (see Fig. 5b), because the charge branch is permanently higher than the discharge branch for hLi or vice versa for hTM. The general evolution of c over the charge/discharge cycle is dominated by the hLi component (since its changes are typically higher than the changes of hTM), 33,63 which is why any changes of c are typically explained with respect to this component (as we also did in the previous paragraphs). On the other hand, the evolution of the hTM component resembles that of the lattice parameter a (see Fig. 5a). This means that the contraction/expansion of the TM-O6 octahedra in the TM layer is fairly isotropic, as they respond uniformly in the ab plane (seen in a) and along the c direction (seen in hTM) to the actual oxidation state (and ionic radius) of the TMs. 63
Let us shortly comment on the accuracy of the quantification of the layer heights. Their relative error of 0.10%–0.25% (based on the estimated standard deviation given by the refinement program and marked by the error bars in Figs. 5c, 5d) is roughly one order of magnitude higher than that of the lattice parameter c. The reproducibility among two nominally identical data points is fairly good, even though some other structural parameters might differ strongly (especially vNi/NiLi and b3a,Li). This underlines the weak interdependence of z6c,O with other structural parameters. 39 Comparing the L-XPD to the S-XPD data, they coincide nicely on the charge branch (S-XPD data points 1, 2 and 3), but there are deviations on the discharge branch (points 4 and 5; note that the high-SOC point 4 appears to be on the charge branch). Taking all this into consideration, we believe that the ex-situ XPD data correctly describe the separation of the charge/discharge curves, but that the actual values of the layer heights and thus the extent of hysteresis have some uncertainty.
Origin of the reversible structural changes
In the literature, hysteresis phenomena in Li- and Mn-rich layered oxides are usually ascribed to a path dependence of TM migration, 28,29,36,71 which was first proposed by the Argonne National Laboratory. 18,23,27 This migration process might involve both Ni and/or Mn moving from their native spot in the TM layer into tetrahedral and/or octahedral sites in the Li layer. As long as this process is reversible, it is believed that it causes the voltage hysteresis during charge/discharge cycling, whereas the irreversible capture of TMs in the Li layer would lead to voltage fade during long-term cycling. Assat et al. reported instead that the anionic redox is the real cause for hysteresis phenomena and that any structural rearrangements are just a consequence of that. 24 On the other hand, Gent et al. proposed a coupled {O2− + TM} → {O− + TMmig} + e− process, where TMmig indicates a migrated TM into the Li layer, thus combining both afore-mentioned theories. 30 House et al. showed a link between the superstructure ordering and the anionic redox. Both in alkali-rich Nax[Liδ Mn1−δ ]O2 compounds 72 and in Li1.20Ni0.13Co0.13Mn0.54O2, 31 they showed that molecular O2 is reversibly formed and trapped in the bulk, which would connect the voltage hysteresis to the in-plane TM migration in the TM layer (after LiTM removal). 72 Recently, Csernica et al. proposed an oxygen vacancy model, where the oxygen deficiency penetrates into the bulk of the material by a diffusion process, while maintaining the native layered phase. 40 An oxygen vacancy leads to an undercoordinated transition metal, which promotes its migration into the Li layer. Csernica's model provides an atomistic link between cation disordering and oxygen release, both of which occur progressively upon cycling and could thus explain together the voltage fade. 40
Assat et al. and Gent et al. are one of the few publications who quantified the extent of anionic redox and/or TM migration within one cycle and visualized their path dependence as a function of SOC (as we have done for the lattice dimensions in Figs. 1 and 5). Their results are however not identical. Assat et al. have shown by HAXPES measurements for Li1.20Ni0.13Co0.13Mn0.54O2 within the first two cycles that the fraction of oxidized lattice oxygen, % On−, is consistently higher during charge than during discharge (see Fig. 2 in their paper). 24 In contrast, Gent et al. reported for Li1.17Ni0.21Co0.08Mn0.54O2 within the first activation cycle that % On− (measured by STXM-XAS) and % TMLi (measured by S-XPD) are smaller during charge than during discharge (see Fig. 6 in their paper). 30 Even though Assat et al. mention that their result conflicts with the hysteresis loop of the Ni oxidation state (which shows the same trend, but should be opposite for charge balancing), there is obviously not a general consensus yet in the literature—at least when attempting to quantify these sensitive parameters which are apparently difficult to determine.

Figure 6. Selection of data points for the joint Rietveld refinement of ex-situ L-XPD and NPD data from the mid-lithium LMR-NCM, illustrated via the OCV vs SOC curves for the first (in black) and second charge/discharge cycle (in blue). The curves were extracted from the data shown in Fig. 1, which were recorded at C/10 with intermittent OCV periods. Using a nomenclature that specifies the cycle number (#), whether it is a charge or discharge step (CHA or DIS), and the measured SOC (in mAh g−1), the points marked in the figure, given in chronological order, correspond to: ① pristine, ② #1-CHA-100, ③ #1-CHA-200, ④ #2-CHA-100, ⑤ #2-CHA-200, ⑥ #2-DIS-260, and ⑦ #2-DIS-200.
Download figure:
Standard image High-resolution imageThe structural parameters determined in the present study might help to qualitatively track the path dependence during charge/discharge. Assuming a significant fraction of % On− and/or % TMLi, the O-O repulsion in the Li layer gets reduced compared to 0% On− and/or TMLi, what leads to smaller hLi values. On the other hand, the TM-O attraction in the TM layer might get reduced as well, what in turn increases a and hTM. According to the observed trends in Fig. 5 (hLi: charge > discharge; a and hTM: charge < discharge), these considerations support the findings by Gent et al. 30 In a simplified picture, the anionic redox and/or TM migration mainly occur at high SOCs during charge, but revert at low SOCs during discharge, i.e., the hysteresis is maximized in the mid-SOC regime (what is actually true for the OCV and lattice dimensions; see Figs. 1 and 5). It is however not really clear where the (energetic) penalty for such a huge delay comes from Refs. 23, 27, 73. An alternative explanation for the analogous hysteresis of a and hTM is the path dependence of the cationic redox, which is spectroscopically easier to access than the anionic redox and which basically follows the OCV hysteresis. 24,25 The large number of (potentially) hysteretic parameters, including the open circuit voltage, lattice parameters, TM migration, cationic and anionic redox, raises the fundamental question about their "true" causal chain, which is lively discussed in the literature. Since there are so many different perspectives at the moment, it is difficult, if not impossible, to unequivocally assign the lattice parameter hysteresis to one particular parameter.
To break complexity down, we want to focus on TM migration in the following. The distribution of transition metals in Li- and Mn-rich layered oxides is usually investigated by (i) diffraction, using either XPD 30,45,74–76 or NPD data, 29,44 and (ii) a combination of microscopy techniques such as HAADF-STEM, EELS, and electron diffraction. 77–79 While microscopy is a local probe, which often resolves changes of the TM arrangement close to the particle surface, diffraction is a bulk method, which allows quantifying the TM distribution by the use of proper structural models to obtain average information for the entire CAM particle. There are single examples of other techniques such as X-ray diffraction spectroscopy (XDS), 71,80 atomic resolution STEM-EDS mapping, 81 and 6Li MAS NMR spectroscopy, 28 but they are not used on a routine basis. Despite being the main technique, diffraction is full of pitfalls, especially due to the possible correlation of interdependent (structural) parameters, which hampers their precise quantification. 39 This problem can be minimized by the joint Rietveld refinement of complementary diffraction datasets, typically XPD and NPD, 82–84 but there are also a few examples in the battery field about the additional use of resonant X-ray diffraction (at energies close to the K edge of the transition metals). 37,38,85 As the scattering power of the elements varies among these different datasets, the joint refinement approach allows refining more elements on a single crystallographic site than only one dataset could do. This is in particular advantageous for Li- and Mn-rich layered oxides, because (i) Li can be extracted from two layers (LiLi vs LiTM), and (ii) both Ni and Mn are considered to migrate into the Li layer (NiLi vs MnLi). In contrast to XPD, where the X-ray atomic form factor scales with the number of electrons in the atom, NPD is sensitive to light elements (such as Li and O) and to elements with similar atomic numbers (such as Ni and Mn), as the neutron scattering length varies irregularly with atomic number and isotope. 39
Figure 6 shows the OCV curve of the mid-lithium LMR-NCM plotted vs the lithium content for the first and second cycle, marking the selected samples of harvested cathodes for the combined refinement of ex-situ L-XPD and NPD data. Here, NPD needs CAM powder in the gram scale, which was prepared in multi-layer pouch cells (see Experimental section for more details). Apart from the pristine LMR-NCM (sample ①), we chose two samples from the first charge (②+③), two from the second charge (④+⑤), and two from the second discharge (⑥+⑦). During the first activation charge (in black), sample ② is at the end of the sloping region, whereas ③ resides in the middle of the voltage plateau. Their comparison might allow discerning the lithium extraction mechanism (LiLi vs LiTM). For the quasi-reversible hysteresis of the second cycle (in blue), we selected charge/discharge samples with either the same SOC or lithium content (i.e., ⑤↔⑦ in Fig. 6) or with the same OCV (and thus the same unit cell volume, i.e., ④↔⑦ and ⑤↔⑥), analogous to what was done by Mohanty et al. 29 Even though the number of data points is too little to resolve any hypothetical hysteresis loop of TM migration, their comparison might help to answer the question whether the amount of migrated TMs is similar at a given SOC or at a given OCV and hence whether there is any correlation to the lattice dimensions.
L-XPD and NPD diffractograms
Before moving on to the Rietveld refinement results, it is worth to have a look on the diffractograms. Figure 7 shows the L-XPD and NPD diffractograms of the pristine mid-lithium LMR-NCM, which was measured as pure powder. We used a rhombohedral model for the combined refinement, as will be discussed later in detail. Both datasets cover a similar Q range and have comparable intensities, thus contributing equally to the refinement.
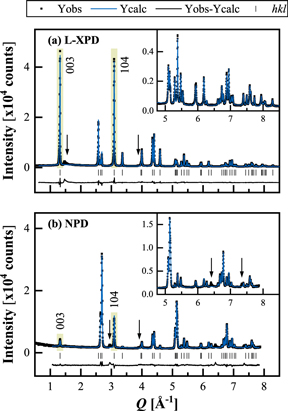
Figure 7. Joint Rietveld refinement of the pristine mid-lithium LMR-NCM powder, using (a) the L-XPD and (b) the NPD dataset with the rhombohedral model 2 (described later in detail). The observed (black points), calculated (blue lines), and difference diffraction profiles (black lines) are shown together with the position of the Bragg peaks (black ticks) as a function of Q (in order to compensate for different wavelengths;  ). The insets show a magnification of the high-Q range. The arrows indicate superstructure peaks due to in-plane ordering in the TM layer, which are not described by the rhombohedral model. The green highlighted regions mark the (003) and (104) reflections.
Download figure:
Standard image High-resolution imageThe in-plane Li/TM ordering in the TM layer is typically discussed on the basis of the small superstructure reflections following the intense (003) peak in the L-XPD pattern (at ≈1.4–2.0 Å−1, marked by the left arrow in Fig. 7a). Interestingly, there are several peaks at ≈2.9, 44,86 ≈ 3.9, ≈6.4, 86 and ≈7.3 Å−1 in the NPD pattern (as highlighted by the arrows in Fig. 7b), which are also not included in the rhombohedral model. They are only described by the monoclinic model and are thus another indicator for Li/TM ordering (see monoclinic refinement in Fig. S7 in paragraph S3 of the SI). As the ordering is not perfect, both in c direction (due to the presence of stacking faults) and in the ab plane (due to the off-stoichiometric Li/TM ratio), the superstructure peaks are quite broad and have a low intensity. 82,86,87 The peak at ≈3.9 Å−1 in the NPD profile also appears in the L-XPD pattern (better visible on a logarithmic intensity scale).
To qualitatively estimate the cation mixing in pristine layered oxides, it is common to compute the integrated intensity ratio of the (003) and (104) reflections from XPD data (higher ratios point towards less migrated TMs).
60,88
While these two reflections are the most intense peaks in the L-XPD pattern, they are relatively weak in the NPD pattern (see yellow highlighted regions in Fig. 7). This discrepancy raises the question about the sensitivity of the NPD dataset with regard to the quantification of TM migration. Here, it is useful to apply the "diffraction parameter space" concept introduced by Yin et al.,
89
which allows calculating the zero-angle scattering power,  of each crystallographic site i according to
where mi is the multiplicity, cj the fractional occupancy, and fj the scattering power of each atom j residing at the site i. This term is normalized by the sum over all sites. Consequently,  is the fractional contribution of the scattering power from each crystallographic site i relative to the total scattering power of the compound at 2θ = 0, with
  As described in more detail in the original publication by Yin et al.,
89
this concept is based on the simplified scenario for the hypothetical F000 reflection, where the phase factor ωi of the site i is 1, and therefore the net scattering power of the m atoms comprising on this site is equal to m times the scattering power of a single one of these atoms. The individual scattering power of each atom, fj, either corresponds to the X-ray atomic form factor or the neutron coherent scattering length.
As described in more detail in the original publication by Yin et al.,
89
this concept is based on the simplified scenario for the hypothetical F000 reflection, where the phase factor ωi of the site i is 1, and therefore the net scattering power of the m atoms comprising on this site is equal to m times the scattering power of a single one of these atoms. The individual scattering power of each atom, fj, either corresponds to the X-ray atomic form factor or the neutron coherent scattering length.
In the rhombohedral model, there are three octahedral sites: 3a (Li layer), 3b (TM layer), and 6c (O layer). Table II summarizes their fractional scattering power,  for the "ideal" pristine mid-lithium LMR-NCM (without any cation mixing) in both datasets. In the XPD pattern, the TM layer has the strongest scattering power amounting to ≈54% due to the high number of electrons, whereas the O and Li layer amount to ≈39% and ≈7%, respectively. Thus, all sites have a measurable contribution to the diffractogram. This is in stark contrast with the NPD pattern, which is dominated by the O layer with a share of ≈85%, whereas the TM layer contributes only with ≈1% to the total scattering power. The unfavorable combination of Ni (medium abundance and high positive scattering length, see caption of Table II) and Mn (high abundance and negative scattering length, see caption of Table II) effectively cancels out the scattering power of this site. The domination of the O layer is not altered by lithium extraction (in cycled samples) or by the incorporation of occupancy defects such as TM migration (e.g., NiLi and MnLi) and oxygen vacancies (considering that the expected extent of these defects is less than 10%). We conclude that the sensitivity of the recorded NPD patterns for the quantification of site occupancy factors in this particular compound is not as high as typically believed in the literature.
Table II. Fractional contribution of the scattering power from each crystallographic site relative to the total scattering power of the compound at 2θ = 0,  as described by Yin et al.
89
The calculation is done for the ideal composition of the pristine mid-lithium LMR-NCM, [Li]3a[Li0.17Ni0.19Co0.10Mn0.54]3b[O]6c, using X-ray form factors of neutral atoms (fLi = 3, fNi = 28, fCo = 27, fMn = 25, and fO = 8; all in number of electrons) and neutron scattering lengths as implemented in Topas (fLi = ‒1.9, fNi = 10.3, fCo = 2.49, fMn = ‒3.73, fO = 5.803; all in fm).
48
as described by Yin et al.
89
The calculation is done for the ideal composition of the pristine mid-lithium LMR-NCM, [Li]3a[Li0.17Ni0.19Co0.10Mn0.54]3b[O]6c, using X-ray form factors of neutral atoms (fLi = 3, fNi = 28, fCo = 27, fMn = 25, and fO = 8; all in number of electrons) and neutron scattering lengths as implemented in Topas (fLi = ‒1.9, fNi = 10.3, fCo = 2.49, fMn = ‒3.73, fO = 5.803; all in fm).
48
| Crystallographic site | Fractional scattering power | ||
|---|---|---|---|
| XPD | NPD | ||
| 3a (Li layer) |

| 0.073 | 0.139 |
| 3b (TM layer) |

| 0.537 | 0.010 |
| 6c (O layer) |

| 0.390 | 0.851 |
Figure 8 illustrates the diffractograms of the cycled sample ⑤ #2-CHA-200 (see also Fig. 6). All harvested electrode samples have in common that the NPD background is substantially increased compared to the pristine LMR-NCM powder (compare Figs. 8b with 7b), probably due to the presence of hydrogen in the PVDF binder and electrolyte residuals (hydrogen has a large incoherent neutron scattering cross-section).
29,90
Furthermore, there are several foreign reflections in the Q range of 1–2 Å−1. According to the simple mixture of conductive carbon and PVDF binder (at a mass ratio of 1/1) in Fig. 8c, these reflections could be mainly assigned to the two electrode additives. As hydrogen and carbon are relatively strong neutron scatterers, the electrode additives are much more visible in the NPD profile than in the L-XPD pattern. Consequently, the weak (003) reflection in the NPD pattern had to be omitted from the joint refinement of harvested electrode samples ( = 2.1 Å−1 for the samples ②–⑦ in Fig. 6). On the other hand, the superstructure peaks (expected positions indicated by the arrows in Fig. 8) are either superimposed by stronger reflections of the LMR-NCM phase and the electrode additives or they are difficult to distinguish from the background. This applies to all other harvested electrode samples as well, which is why we decided to additionally exclude the first superstructure region in the L-XPD pattern from any monoclinic refinement (1.4 <
  < 2.3 Å−1), because the electrode additives' peaks might falsify the refinement results. For the sake of comparability and due to their poor description without any extra broadening, these peaks were also excluded from the monoclinic refinement of the pristine LMR-NCM powder sample.
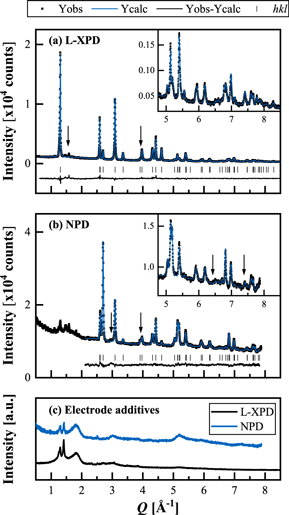
Figure 8. Joint Rietveld refinement of the harvested electrode sample ⑤ #2-CHA-200 (specified in Fig. 6), using (a) the L-XPD and (b) the NPD dataset with the rhombohedral model 2. As for all harvested electrode samples (②–⑥), the minimum Q value for fitting the NPD pattern,  was set to 2.1 Å−1. The arrows indicate the expected positions of the superstructure peaks. Panel (c) shows the diffractograms of a 1/1 g/g mixture of conductive carbon (Super C65) and PVDF binder (Solef 5130) on an arbitrary intensity scale.
Download figure:
Standard image High-resolution imageResults of the joint Rietveld refinement
In the literature, there are numerous structural models used for the Rietveld refinement of diffraction data from Li- and Mn-rich layered oxides, which reach from rhombohedral to monoclinic all the way to composite models with increasing complexity. In Table SV in paragraph S4 of the SI, we tried to give an overview of structural models by comparing 15 publications from different research groups (i.e., with respect to the investigated CAM, the type of diffraction data, and the number of refined structural parameters). Here, we made the following observations: (i) In some publications, it is not clear how all of the structural parameters are actually treated during the refinement (especially atomic displacement parameters, ADPs). This makes it difficult for the reader to evaluate the quality of the applied model. (ii) Even for the same base model, the amount of refined (or constrained) structural parameters might differ significantly (especially site occupancy factors, SOFs). A high number of refined parameters potentially causes severe correlations and thus restricts their validity. (iii) Finally, the application of composite models is in our opinion mostly not well justified on the basis of the raw data, e.g., by the occurrence of peak splitting. It is further not always clear how the overall composition is maintained when the phase fractions are freely refined (without adapting, e.g., the TM distribution among the two phases).
Since the literature reports are largely different, we want to start the joint Rietveld refinement with a simple rhombohedral model for the X-ray and neutron diffraction data of the mid-lithium LMR-NCM material (with the sample specifications given in Fig. 6). This model referred to as model 1 looks as follows in the crystallographic notation: [Lix−uNiv]3a[LiuTM0.83−v]3b[Ow]6c (corresponding to Lix−uNiv[LiuTM0.83−v]O2w in the formula unit notation). Here, the three most common fractional occupancies are freely refined: (i) the Li distribution in the Li/TM layers, which finds expression in the parameter uLi (equivalent to LiTM), (ii) the migrated Ni into the Li layer (vNi, equivalent to NiLi), and (iii) the oxygen vacancies (wO, equivalent to O). The overall lithium content, xLi, is determined by the SOC of the cycled samples according to Eq. 1. Since the 3a/3b metal sites are fully occupied in the pristine state, uLi and vNi are constrained with respect to each other (uLi = 0.17 + vNi at xLi = 1.17). This reduces the number of freely refined site occupancy factors (SOFs) to two. The calculated values of LiTM, NiLi, and O, which represent the afore-mentioned SOFs in percentage terms, are summarized in Fig. 9 for all seven samples (together with their unit cell volume and OCV).

Figure 9. Summary of the combined L-XPD and NPD Rietveld refinement for the seven mid-level LMR-NCM samples described in Fig. 6. (a) Refined unit cell volume (in the rhombohedral representation; left y-axis) and open circuit voltage after 2 h (right y-axis). The following panels show the refined (or fixed) amount of (b) lithium in the TM layer ( ), (c) oxygen in the O layer (
 ), and (d) nickel in the Li layer (
 ) according to three different structural models: (i) the extended rhombohedral model 1 with [Lix−uNiv]3a[LiuTM0.83−v]3b[Ow]6c, (ii) the simplified rhombohedral model 2 (uLi ≥ 0, wO = 1), and (iii) its monoclinic counterpart, model 3, which also accounts for the in-plane Li/TM ordering in the TM layer. The overall lithium content, xLi, is determined by the state of charge (see Eq. 1). For further refinement results see Tables SII-SIV in paragraph S3 of the SI. The gray highlighted area marks the refinement results for the electrode samples harvested in the second cycle.
Download figure:
Standard image High-resolution image
Starting with LiTM (see black data points for model 1 in Fig. 9b), the lithium occupation in the transition metal layer stays at its pristine value of ≈20% until the end of the sloping region (sample ②), but drops to ≈2% in the middle of the first charge plateau (③) and reaches even negative values in the second cycle (⑤–⑦), which are physically meaningless, but mathematically possible in the least squares refinement (without applying any constraints with respect to the SOFs). This result is qualitatively in line with the operando NPD study of Liu et al., 66 who reported that the delithiation mechanism operates solely through the extraction of lithium from the lithium layer (LiLi) in the sloping region, but involves the extraction of lithium from the transition metal layer (LiTM) during the activation plateau, whereby the latter cannot be re-intercalated within the first discharge (constant level of ≈6%–7% in their study). We observe ≈6% LiTM for sample ④ at the beginning of the second charge (#2-CHA-100). Since the SOC provides a lower limit of the actual lithium content due to the possibility of parasitic reactions at high voltages, 39,84 xLi is definitely greater than 1 in the discharged state (xLi ≈ 1.05 at the end of the first discharge, see lower x-axis in Fig. 6), what in turn imposes the partial occupation of LiTM after activation.
Approaching the delithiation process by DFT simulation of the model material, Li60[Li12Ni12Co6Mn30]O120, Table SVI in paragraph S5 of the SI shows that the potential energy surface for these systems exhibits a multitude of nearly degenerate local minima for each delithiation step. We start the analysis considering the removal of 13 Li (xLi = 0.98). Among the calculated structures, it is energetically more favorable to remove Li from the Li layer only, leaving the 12 Li in the TM layer intact. The layered structure is retained; of the 47 Li in the Li layer, only one in the central layer seems to have changed its coordination to tetrahedral. Further delithiation of in total 42 Li (xLi = 0.50) brings us experimentally to the middle of the voltage plateau in the first charge. By DFT, we found that the most stable structure was achieved by removing all Li from the TM layer, while maintaining the layered structure. An alternative model where 6 Li still reside in the TM layer has been found to be 18 meV/atom higher in energy. To sum up, the DFT results qualitatively agree with the experimental data of the first activation charge. Hence, we are confident that the CAM activation follows the energetically favorable delithiation pathway.
The oxygen content of model 1 in Fig. 9c changes from almost +10% to ‒10% upon progressive cycling. Former gassing studies of the mid-lithium material suggest the oxygen release to be on the order of ≈3% within the first two cycles, originating from the near-surface region of the primary particles. 13,59 Despite the presence of intragranular nanopores in pristine CAMs and further intragranular cracking upon cycling, which inject oxygen vacancies also into the bulk lattice, 68,91,92 the refined level seems to be unlikely. Recently, Csernica et al. estimated the oxygen release, including bulk oxygen vacancies, for a similar LMR-NCM material (δ = 0.18) on the basis of XAS data. 40 They reported ≈3.3% lost oxygen after the first cycle, which is consistent with the gassing studies. 13,59 After 500 cycles, the oxygen release amounted to ≈6.5% and is thus far below the here refined changes of almost 20% within the first two cycles. This variation also exceeds the maximum of ≈10% of reversibly trapped lattice oxygen in the form of molecular O2, as was reported by House et al. 31 Beyond that, O values greater than 100% are again physically meaningless and the parameter wO is strongly correlated to the NPD scale factor (≈70%–80%), which can be explained by the overwhelming scattering power from the O layer in the NPD pattern (see Table II). This makes the neutron data insensitive to the oxygen occupancy, as was also observed by Csernica et al. 40 In view of these findings, it seems to be reasonable to neglect oxygen vacancies from refinements of LMR-NCM samples within the initial cycles.
The refined amount of Ni migrated into the lithium layer, NiLi, lies in the range of ≈1.6% to ≈5.0% for all of the examined samples (see Fig. 9d). Gent et al. determined comparable TMLi values from ≈2.6% in their pristine LMR-NCM until ≈7.5% at the end of the first charge. Please note that their reported % TMLi values are divided by the total TM stoichiometry, % TMLi (as used by Gent et al.) = TMLi (as used in this work)/(1−δ) with δ = 0.17. 30 Since NPD could help to differentiate the migrating TM species due the sign of their neutron scattering length (Ni and Co positive, Mn negative), we also tried joint Rietveld fits with MnLi instead of NiLi. However, the refinements gave unreliable LiTM values of up to ≈40% for the cycled samples. As Li and Mn have both negative neutron scattering lengths, they are highly correlated (≈80%) and it is thus not viable to refine their distribution in the metal layers simultaneously (analogous to the difficulty to differentiate the transition metals from XPD data). Refining simultaneously Li, Ni, and Mn would lead to a 100% correlation among the three parameters. In this context, we should recall that diffraction probes the scattering power of crystallographic sites, but not of their individual constituents. This restricts the number of simultaneously refined SOFs on a single site to the available number of complementary diffraction datasets. The combination of L-XPD and NPD, as used in this work, enables a maximum of two SOFs on the same site(s). If the scattering power of two elements is however unfavorably close in one of the datasets (e.g., Li and Mn in NPD, Ni and Mn in regular XPD), their simultaneous refinement might lead to severe correlations and hence to erroneous results.
Since model 1 led, in part, to physically meaningless results, we explored another rhombohedral model, referred to as model 2, in which the lower limit for LiTM is set to 0% (uLi ≥ 0) and which assumes that there are no oxygen vacancies (wO = 1; see blue data points in Fig. 9). These constraints change the refined NiLi values by a maximum of 0.5% (absolute) for the samples ② and ⑥ compared to model 1, which is mainly driven by excluding oxygen vacancies (vNi and wO are inversely proportional). In a former publication, we also refined the migrated Ni amount into the tetrahedral sites of the Li layer,  for the completely charged state (at 4.6 V).
36
Including
for the completely charged state (at 4.6 V).
36
Including  to the mid/high-SOC samples ⑥ and ⑦ however leads to small values of ≈1%, in contrast to a constantly high level of ≈8%–9% over 100 cycles in the previous study (since
  resides on a 6c site, its amount is calculated according to
  to enable direct comparability with the 3a/3b metal sites). We therefore did not include tetrahedral sites in any of the refinements. Replacing NiLi again by MnLi, while constraining LiTM to remain constant, shows the same trend for the migrating TM. MnLi (≈2.1%–6.0%) is up to ≈0.6% higher than NiLi (≈2.0%–4.5%); only for sample ⑥ MnLi is higher by ≈1.5% (see full comparison in Fig. S8 of the SI). Even though it is difficult to identify the migrating TM species by this comparison, NiLi is the preferred choice for the further analysis, because Ni can be simultaneously refined with Li, but Mn cannot.
Lastly, we also tested a monoclinic model, referred to as model 3 (see green data points in Fig. 9), where the superstructure region in the L-XPD pattern was excluded from the refinement (1.4 <  < 2.3 Å−1, as discussed in the context of Fig. 8). This approach does not only consider the inter-layer Li/TM arrangement, but it also accounts for their in-plane ordering by dividing each layer into two crystallographic sites (Li layer: 2c/4h, TM layer: 2b/4g, O layer: 4i/8j). Due to the different multiplicities, special care must be taken to maintain the overall stoichiometry. The monoclinic model 3 has the following crystallographic notation: [Lix−uNiv]2c,4h[Li3uNioMnp]2b[Ni0.285−o/2−3v/2Co0.15Mn0.81−p/2]4g[Ow]4i,8j, which translates into the formula unit Lix−uNiv[(LiuNio/3Mnp/3)2b(Ni0.19−o/3−vCo0.10Mn0.54−p/3)4g]O2w. Since the in-plane Li/TM ordering matters mainly for the TM layer, the Li and O layer were not split into two parts (i.e., the distribution in these layers is homogenous). Beyond the known parameters uLi, vNi and wO from the rhombohedral models, oNi and pMn describe the distribution of Ni and Mn in the TM layer, respectively. Please note that LiTM was only put on the 2b site, as it is also the case in the archetypal Li2MnO3 (= Li[(Li1/3)2b(Mn2/3)4g]O2).
93
Limiting LiTM again to greater or equal than 0% (uLi ≥ 0) and also neglecting oxygen vacancies (wO = 1), there is a maximum amount of four refined SOFs (viz., uLi, vNi, oNi, and pMn). This number reduces to three for most of the cycled samples due to constraints (3uLi + oNi + pMn ≤ 1 at the 2b site for the samples ② and ④, uLi ≥ 0 for ⑤–⑦) and further to two for the pristine sample ① due to full occupation (uLi = 0.17 + vNi and pMn = 0.49 – 3vNi – oNi). The results are pretty close to the rhombohedral counterpart, model 2. LiTM agrees within ±3% and NiLi differs at the maximum by ≈0.4% (for the samples ② and ⑥) and ≈0.9% (for the pristine sample ①). Furthermore, oNi and pMn confirm the expected TM distribution in the TM layer (see Table SIV in the SI). Due to the similar ionic radii of Li+ and Ni2+, Ni resides mainly on the 2b site (2b/4 g ratio ≈2/1 in the f.u. notation),
44
but Mn accumulates on the 4g site (2b/4g ratio not greater than ≈1/3).
< 2.3 Å−1, as discussed in the context of Fig. 8). This approach does not only consider the inter-layer Li/TM arrangement, but it also accounts for their in-plane ordering by dividing each layer into two crystallographic sites (Li layer: 2c/4h, TM layer: 2b/4g, O layer: 4i/8j). Due to the different multiplicities, special care must be taken to maintain the overall stoichiometry. The monoclinic model 3 has the following crystallographic notation: [Lix−uNiv]2c,4h[Li3uNioMnp]2b[Ni0.285−o/2−3v/2Co0.15Mn0.81−p/2]4g[Ow]4i,8j, which translates into the formula unit Lix−uNiv[(LiuNio/3Mnp/3)2b(Ni0.19−o/3−vCo0.10Mn0.54−p/3)4g]O2w. Since the in-plane Li/TM ordering matters mainly for the TM layer, the Li and O layer were not split into two parts (i.e., the distribution in these layers is homogenous). Beyond the known parameters uLi, vNi and wO from the rhombohedral models, oNi and pMn describe the distribution of Ni and Mn in the TM layer, respectively. Please note that LiTM was only put on the 2b site, as it is also the case in the archetypal Li2MnO3 (= Li[(Li1/3)2b(Mn2/3)4g]O2).
93
Limiting LiTM again to greater or equal than 0% (uLi ≥ 0) and also neglecting oxygen vacancies (wO = 1), there is a maximum amount of four refined SOFs (viz., uLi, vNi, oNi, and pMn). This number reduces to three for most of the cycled samples due to constraints (3uLi + oNi + pMn ≤ 1 at the 2b site for the samples ② and ④, uLi ≥ 0 for ⑤–⑦) and further to two for the pristine sample ① due to full occupation (uLi = 0.17 + vNi and pMn = 0.49 – 3vNi – oNi). The results are pretty close to the rhombohedral counterpart, model 2. LiTM agrees within ±3% and NiLi differs at the maximum by ≈0.4% (for the samples ② and ⑥) and ≈0.9% (for the pristine sample ①). Furthermore, oNi and pMn confirm the expected TM distribution in the TM layer (see Table SIV in the SI). Due to the similar ionic radii of Li+ and Ni2+, Ni resides mainly on the 2b site (2b/4 g ratio ≈2/1 in the f.u. notation),
44
but Mn accumulates on the 4g site (2b/4g ratio not greater than ≈1/3).
Comparison of the migrated NiLi amount
Overall, the refined amount of Ni migrated into the Li layer follows the same trends among the three tested structural models (see Fig. 9d). The quality factors of the Rietveld fit (viz., Rwp, Rbragg, and χ2) typically improve from model 2 to model 1 to model 3 (see Tables SII–SIV of the SI), which can be explained by the increasing amount of freely refined parameters (see comparison in Table SV of the SI). Since the results from model 1 were in some cases not physically sound and since the monoclinic extension of model 3 aims primarily at the in-plane Li/TM ordering (which further might get lost within the first cycles
45,46
), we think that the rhombohedral model 2 (with the constraints uLi ≥ 0 and wO = 1) is the simplest and most robust approach to determine NiLi in this study. In the following, we want to systematically compare the amount of migrated NiLi from model 2 in the second cycle (highlighted in gray in Fig. 9). After activation, this cycle is characterized by a quasi-reversible hysteresis of the OCV and the lattice parameters as a function of SOC. Table III contrasts the results from the harvested electrodes of the second cycle according to their SOC, OCV, unit cell volume V, and migrated NiLi amount. As discussed in Fig. 6, the charge/discharge pairs have either the same SOC (⑤↔⑦), essentially the same OCV and unit cell volume V (④↔⑦ and ⑤↔⑥), or they differ for all of the three parameters (④↔⑥). On the other hand, the NiLi amount deviates by ≈0.5%–1.2% (absolute) for each pair (see last column in Table III), which is quite a lot with regards to the maximally observed difference of ≈2.4% (between the samples ② and ⑥; see Fig. 9d). Consequently, we could not prove a causal relationship between the extent of TM migration, in particular NiLi, to the electrochemical (SOC, OCV) and lattice parameter data (for none of the tested models), as we would have intuitively expected based on the TMLi hysteresis reported by Mohanty et al.
29
and Gent et al.
30
in comparison to the here examined hysteresis of the OCV and lattice dimensions. Comparing all samples, we see an increase of the average NiLi level in model 2 from the low/mid-SOC range of the first charge (≈2.1%–2.8% for the samples ①–③) to the low/mid-SOC range of the second charge (≈3.3%-3.9% for ④+⑤) to the mid/high-SOC range of the second discharge (≈4.4%–4.5% for ⑥+⑦). This trend is in line with the irreversible increase of TMLi, which is frequently reported in other studies and amounts there to  ≈ 1.3%–1.9% after the first activation cycle and to ≈2.8%–2.9% after 15-25 cycles (
 analyzed as the difference of the discharged state relative to the pristine material).
30,36,40
On the other hand, our data do not entirely contradict a partially reversible intra-cycle TM migration within the second cycle; however, this hysteresis would be significantly smaller than the
analyzed as the difference of the discharged state relative to the pristine material).
30,36,40
On the other hand, our data do not entirely contradict a partially reversible intra-cycle TM migration within the second cycle; however, this hysteresis would be significantly smaller than the  ≈ 3.6% reported by Gent et al. for the first activation cycle (
 analyzed as the difference between the charged and discharged state).
30
To prove such a small tendency (probably smaller than the overall increase of 2.4% in this study), one certainly needs more data points (including samples in the completely discharged and charged state, which should represent the limit values of NiLi within a cycle, and low-SOC samples during the second discharge, where NiLi would have to go down again).
analyzed as the difference between the charged and discharged state).
30
To prove such a small tendency (probably smaller than the overall increase of 2.4% in this study), one certainly needs more data points (including samples in the completely discharged and charged state, which should represent the limit values of NiLi within a cycle, and low-SOC samples during the second discharge, where NiLi would have to go down again).
Table III. Comparison of mid-lithium LMR-NCM electrode samples harvested in the second cycle (shown in blue in Fig. 6) with respect to their SOC, OCV, unit cell volume V, and migrated NiLi amount (according to the rhombohedral model 2). The relation of the charge/discharge pairs is either classified as identical (=), similar (≈), or different (≠). The respective difference is given as Δ = DIS—CHA. The maximum differences from the completely discharged (2.0 V) to charged state (4.8 V) in the second cycle are: ΔSOC ≈ 270 mAh g−1, ΔOCV ≈ 1.5 V, and ΔV ≈ 3.1 Å3.
|
DFT simulations of the fully charged structure raise further doubts on a correlation between the TM migration and the voltage hysteresis. Although xLi in reality does not fall below 0.1 at the end of charge (see Fig. 6), we assume xLi = 0 for the DFT calculation (i.e., Li0Ni12Co6Mn30O120), thereby removing the combinatorial complexity due to the Li distribution and greatly reducing the computational effort. A structure where 10 Mn moved to tetrahedral positions in the TM layer (see 4th row from the bottom of Table SVI in the SI) is 50 meV atom−1 more stable than a perfectly layered model with every TM in octahedral sites (bottom row of Table SVI). We found several structural candidates where the diffusion of Ni into octahedral sites of the Li layer further lowered the total energy of the system. In many instances we also observed the concomitant formation of O-Oδ‒ dimers in the TM layer from which the diffusing atom(s) originated (see second to last column in Table SVI). 30 All these structures for Li0Ni12Co6Mn30O120 are within 13 meV atom−1 (see last 9 rows in Table SVI), which is well below the value of kB T at 300 K (25 meV atom−1), and at least 43 meV atom−1 lower in energy than the perfectly layered structure without migrated TMs. This result highlights the complexity of the potential energy surface, where many local minima, even with very different structural features, coexist within an energy range comparable with the thermal energy at room temperature. Therefore, the completely delithiated structure appears to be a very "fluxional" system where many processes can happen at virtually no energetical cost.
We now raise the question of what happens when we reinsert Li into the structure with migrated Ni. The expectation is that, after the first charge, we should generally end up at lower voltages (i.e., energies) than before. Instead, every calculated structure containing 1–2 Ni in the lithium layer at xLi = 0.5 (i.e., for Li30Ni12Co6Mn30O120) is consistently higher in energy (by 9–27 meV atom−1; see Table SVI) than the counterpart where the TMs reside solely in the TM layer. This contradicts our expectation based on the lattice parameter results, where we learned that the structural changes (e.g., TM migration) occur mainly at the end of the charge process. Therefore, we would have expected that the lower voltages/energies of the partially lithiated structure with a lithium content of xLi = 0.5 that lies in the voltage plateau region would correlate with a significant number of TMs migrated into the lithium layer.
Based on our calculations, which however do not comprise an exhaustive screening, we can say that TM migration is only at the fully charged state energetically degenerated. The data do not provide any hint for the lower voltages/energies between the charge and discharge process caused by nickel migration because the TM movements stays unfavorable with increasing lithium content. This means that there is no driving force to energetically maintain a possibly moved TM in the lithium layer after charging the material.
Finally, let us comment on the accuracy of the NiLi amount from our joint Rietveld refinements. Using the example of model 2, all correlations of NiLi are below ≈55% and thus minor for most of the samples (①–④). The level of correlations rises with increasing SOC, reaching up to ≈70% to the L-XPD scale factor and ≈60% to the atomic displacement parameter of the Li layer, b3a,Li, for the high-SOC sample ⑥. In general, the ADPs are in a reasonable range for layered oxides (0.5 < b3a,Li < 2.1, 0.1 < b3b,TM < 0.3, 0.8 < b6c,O < 1.2, all in Å2; see Table SIII in the SI), 39,89 but b3a,Li and b3b,TM run into the lower limit of 0 for sample ⑥. Fixing them intentionally to 1.0 and 0.25 Å2, respectively, changes the NiLi amount in model 2 from 4.48(11)% to 4.90(9)%. This difference is undesirably large and thus emphasizes the strong dependence of SOFs on ADPs. The accurate determination of ADP values needs high-Q diffraction data in the range of ≈10–20 Å−1, as they could be obtained from S-XPD and time-of-flight NPD (TOF-NPD would be most qualified, because the neutron scattering length does not fall off with increasing Q). 39,89
By applying high-quality S-XPD and TOF-NPD data separately to a series of twelve pristine NCM materials, Yin et al. achieved an absolute agreement of 0.1% for the paired anti-site NiLi/LiTM defect between both Rietveld fits (with partially constrained ADP values). 89 In a similar manner, we also tested model 2 individually against every L-XPD, S-XPD, and NPD pattern of the seven co-refined samples (by combining all available data from Figs. 5 and 9). The comparison of the structural parameters in Fig. S9 of the SI shows that z6c,O is fairly invariant among the different datasets, 39 while NiLi and b3a,Li have a significant scatter. The steady increase of NiLi over the course of the two charge/discharge cycles is reflected, on average, in all datasets, but the variation of the NiLi amount for a given sample ranges from 0.2% to 3.8%. We thus think that an accuracy of 0.1% is extremely difficult, if not impossible, to accomplish in our work and related studies about Li- and Mn-rich layered oxides. This type of CAMs is crystallographically more challenging than regular NCMs without over-lithiation, because lithium also resides in the TM layer, where it causes an (imperfect) Li/TM ordering. Both the lithium occupation and the in-plane ordering change upon electrochemical cycling. Furthermore, the atoms of the layered oxides go through different oxidation states during cycling, involving both cationic and anionic redox activities in LMR-NCMs.
This electronic aspect raises the question about the proper choice of X-ray atomic form factors. We applied neutral atoms because they ensure charge neutrality for any (cycled) sample. Using ions, namely Li+, Ni2+, Co3+, Mn4+, and O2−, would yield consistently lower NiLi values by 0.5%–0.9% (see Fig. S10 of the SI). Yin et al. proposed alternatively the combination of neutral metal species with ionic O2−.
89
As the oxidation states are different, but not exactly known at any given SOC, they add an unavoidable bias to the refined NiLi amount of cycled samples. For this reason, Liu et al. proposed to exclude low-Q values from XPD refinements, because different oxidation states have the biggest impact there.
39
Following their suggestion, we tested model 2 again with  = 2.9 Å−1, which ignores the rhombohedral reflections (003), (101), (006), and (102). The comparison of the refinements using atomic form factors with either full or limited QL−XPD range is also provided in Fig. S10 of the SI, yielding by 0.2%–1.1% smaller NiLi values for the latter. Since these variations are within the magnitude which is often discussed in the literature as a meaningful difference when analyzing different CAMs, it is essential to report all these refinement details to enable a minimum of comparability between different publications.
Even though the purpose of Rietveld refinements of diffraction data from Li- and Mn-rich layered oxides is to determine NiLi and site occupancy factors, their quantification is clearly subject to much uncertainty. As there is no generally accepted agreement yet in the literature about the proper choice of instrumentation (e.g., synchrotron vs laboratory diffractometer), X-ray atomic form factors, and structural models, all these uncertainties clamor in our opinion for a systematic study, as it was done for regular layered oxides by Liu et al. 39 and Yin et al. 89 Comparing high-quality diffraction data, preferably S-XPD and TOF-NPD, of over-lithiated CAMs at different SOCs might show a path towards the precise quantification of TM migration. The current efforts to synthesize Co-free LMR-NCM 6,94 would additionally reduce the compositional complexity in diffraction experiments. We hope that this work can serve as a starting point in this respect.
Conclusions
In this work, we investigated the well-known open circuit voltage (OCV) hysteresis in Li- and Mn-rich layered oxides (LMR-NCMs, i.e., Li[Liδ TM1−δ ]O2 with 0.1 < δ < 0.2 and TM = Ni, Co, Mn) on a structural level, using a combination of diffraction techniques and DFT simulations. In the first part, the lattice parameter evolution of a mid-lithium LMR-NCM with δ = 0.17 was monitored within the initial cycles by in-situ X-ray powder diffraction on a laboratory instrument (L-XPD). After passing the activation voltage plateau during the first charge, the lattice parameters a and c as well as the unit cell volume V, from which c can be further divided into the layer heights hLi and hTM, resemble the quasi-reversible hysteresis of the OCV. Here, changes of a and hTM are determined by the cationic redox of the transition metals, while hLi and the overall shape of c are a measure of the anionic redox, O2−/On− with n < 2. These assignments are derived from the literature about stoichiometric NCMs with δ being close to 0, and could be further verified by the comparison of three LMR-NCM with different extents of over-lithiation (ranging from δ = 0.14 to 0.20) with a regular NCM-811. The hysteresis does not occur when LMR-NCMs are cycled in their pre-activated state before the first charge plateau at ≈4.5 V, but it can also be diminished afterwards by narrowing the effective SOC window, as was shown by window opening experiments. When correlated to the OCV instead of the SOC, the path dependence of the lattice parameters c remains for the activated LMR-NCMs, but gets really small for the lattice parameter a. On the other hand, the path dependence of the unit cell volume vanishes completely and gives a linear correlation with OCV with a slope of ca. ‒2 Å3 V−1, independent of the extent of over-lithiation. Therefore, the V-OCV relationship can be seen as universal property, which applies to all here investigated LMR-NCMs.
In the second part, we aimed at quantifying the amount of migrating transition metals (TMs) in the bulk by a joint Rietveld refinement approach of ex-situ L-XPD and neutron powder diffraction (NPD) data of the mid-lithium material. It is often believed in the literature that the reversible TM migration between their native TM layer, TMTM, and the Li layer, TMLi, causes the reversible hysteresis phenomena in LMR-NCMs, whereas the irreversible capture of TMs in the Li layer is attributed to the voltage fade during long-term cycling. 27,30 Due to limitations with regards to the measurement time and the large amount of sample that is required for NDP, we could only look at a few samples within the first two cycles and could hence not resolve an intra-cycle hysteresis loop of TMLi. Furthermore, with the four samples of the second cycle, we could not observe any correlation of the refined NiLi amount to the electrochemical and lattice parameter data. Using a simplified rhombohedral model for which the amount of lithium in the TM layer, LiTM, was constrained and that did not allow for oxygen vacancies (referred to as model 2), the maximum difference of NiLi was 2.4% (absolute) among the investigated samples. In view of all the assumptions and uncertainties associated with the Rietveld refinement of LMR-NCMs, it is in our opinion difficult and speculative to discuss even smaller differences within a subgroup of samples.
A huge variety of structural models is used in the literature, spanning from rhombohedral to monoclinic to composite models, from which we tested the first two under various assumptions. For none of them we observed the hoped-for correlation between voltage hysteresis and TM migration. The error of the refined NiLi values is estimated to be on the order of ±0.5%. Since the maximum difference between the four samples of the second cycle is less than 2% for any of the tested models (using the joint Rietveld refinement approach), we thus assume the reversible intra-cycle ΔNLi to be smaller than 3%. Even though our DFT simulations did also not find any hint that TM migration causes the observed OCV hysteresis, it is actually not known in the literature how much migrated NiLi would be needed to explain the separation of the charge/discharge curves by hundreds of mV. If ≤3% are indeed sufficient, Rietveld refinements are in our opinion not fully established yet to resolve TM migration in LMR-NCMs, but further in-depth work might bring us to the point.
Acknowledgments
We want to acknowledge BASF SE for the support through its Scientific Network on Electrochemistry and Batteries and the BMBF (Federal Ministry of Education and Research, Germany) for its financial support within the ExZellTUM II project (grant no. 03XP0081). We also thank the Heinz Maier-Leibnitz Zentrum (MLZ) for granting beamtime at FRM II (proposal no. 14350 and 14839). Beyond that, we wish to acknowledge the beamline scientist Nicola Casati (Material Science beamline MS-X04SA, Swiss Light Source) for his support during sample preparation, data collection, and data analysis of the ex-situ S-XPD data. Further gratitude is expressed to Franziska Friedrich and Rebecca Wilhelm for their help with the in-situ L-XPD measurements and during the NPD beamtime preparation, respectively.