
Abstract
Hydrogen crossover poses a crucial issue for polymer electrolyte membrane (PEM) water electrolysers in terms of safe operation and efficiency losses, especially at increased hydrogen pressures. Besides the impact of external operating conditions, the structural properties of the materials also influence the mass transport within the cell. In this study, we provide an analysis of the effect of elevated cathode pressures (up to 15 bar) in addition to increased compression of the membrane electrode assembly on hydrogen crossover and the cell performance, using thin Nafion 212 membranes and current densities up to 3.6 A cm−2. It is shown that a higher compression leads to increased mass transport overpotentials, although the overall cell performance is improved due to the decreased ohmic losses. The mass transport limitations also become visible in enhanced anodic hydrogen contents with increasing compression at high current densities. Moreover, increases in cathode pressure are amplifying the compression effect on hydrogen crossover and mass transport losses. The results indicate that the cell voltage should not be the only criterion for optimizing the system design, but that the material design has to be considered for the reduction of hydrogen crossover in PEM water electrolysis.
Export citation and abstract BibTeX RIS

This is an open access article distributed under the terms of the Creative Commons Attribution 4.0 License (CC BY, http://creativecommons.org/licenses/by/4.0/), which permits unrestricted reuse of the work in any medium, provided the original work is properly cited.
For the development of next generation polymer electrolyte membrane (PEM) water electrolysers, the generation of a comprehensive understanding of gas crossover phenomena is necessary. 1–5 Furthermore, the voltage loss mechanisms in the electrochemical polarisation behaviour of PEM water electrolysers are not fully resolved yet and offer possibilities for improvement. For instance, thin membranes are required for the reduction of undesired ohmic voltage losses. 6–8 However, thin membranes also lead to higher concentration gradients of the produced gases across the membrane, which results in enhanced gas crossover. 4,5,9 Hence, the loss of hydrogen leads to reduced faradaic efficiencies and triggers safety issues, which have to be solved for future system designs. 1,4,5,10–12
There are various existing studies dealing with the influence of external operation conditions on hydrogen crossover. In summary, these studies found that increases in cell temperature, in cathode pressure, and in current density result in increased hydrogen crossover. 3–5,9,10,13–15 Further investigations on structural effects were carried out by Trinke et al . 16 and Bernt et al. 9 These show that an increase of the ionomer content within the cathode catalyst layer leads to higher anodic hydrogen volume fractions. It is now understood that the limited transport of evolved hydrogen from the catalyst into the pores translates into increased dissolved hydrogen concentrations, which eventually results in higher hydrogen crossover and higher mass transport losses. 14–16
Recently, Stähler et al., 17 co-authors in this study, have investigated the impact of porous transport layer compression on hydrogen crossover at ambient pressure. They found that the hydrogen in oxygen content increases at higher current densities, the more the porous transport layer on the cathode (PTL-c) was compressed. Based on this and further data, 4,5,10,14,15 Omrani et al. 18 have developed a model for hydrogen crossover in PEM water electrolysers. They concluded that the super-saturation of water with evolved hydrogen is a decisive explanation for hydrogen crossover. However, it was emphasized that the interaction of high compression with other parameters (e. g. high current densities) needs to be further explored.
In this context, we understand that the interface between PTL and catalyst layer needs to be considered as well. Usually, high clamping pressures are chosen in order to allow good electric conductivity across the interfaces, which results in lower ohmic losses. 6,19 However, high clamping pressures have other negative consequences. 20 Especially on the cathode side, where the carbon PTL-c is more compressible than the titanium PTL-a, mass transport limitations are typically found due to reduced permeability of the PTL-c and the catalyst layer. 6,18,19,21,22 This trade-off was already evidenced by Stähler et al. 17
These works highlight that further investigations on the cathodic structural properties are necessary in order to develop a comprehensive understanding of hydrogen crossover in PEM water electrolysers. In order to meet this objective, this study aims to answer the questions whether the experimental findings on the compression effect of Stähler et al. 17 can be validated in a different cell setup and how an increase in cathode pressure in combination with the variation of the cell compression affects hydrogen crossover and voltage losses caused by mass transport. For this, four different compression levels were introduced into the cell setup and the anodic hydrogen in oxygen content was measured at four cathode pressures at each compression level. Moreover, the polarisation behaviour of each compression level and each cathode pressure was measured in order to perform a thorough cell voltage analysis.
Experimental
Material and setup
Catalyst coated membranes
The catalyst coated membranes (CCMs) were fabricated with the decal method that has been described in detail previously. 23,24 First, the anodes were produced by coating an iridium dispersion on a glass fibre reinforced PTFE substrate (140 μm, Saint Gobain) by means of a 200 mm slot die (TSE Troller AG) (anode composition: 70 wt% iridium(IV)oxide (Premion, Alfa Aesar) and 30 wt% Nafion ionomer (Chemours)). Subsequently, the cathodes were produced in the same manner by using a platinum dispersion (cathode composition: 85 wt% platinum supported on high surface area Ketjenblack (60% Pt; EC-300J, PK catalyst) and 15 wt% Nafion ionomer (Chemours)). After drying at 80 °C, the electrodes were cut into pieces of 2 × 2 cm2 and hot pressed on a Nafion 212 membrane at 130 °C and 0.5 kN cm−2. The catalyst loading was 0.20 ± 0.02 mgPt cm−2 for the cathode and 1.05 ± 0.05 mgIr cm−2 for the anode.
Porous transport layers
For the anode side, the same titanium PTL-a (sintered fibers, 350 μm, Bekaert) sputtered with iridium (0.05 mg cm−2) to prevent corrosion, 25,26 was used for all measurements. In order to achieve the most uniform and reproducible compression level possible, a carbon PTL-c sheet (H23I2, Freudenberg) of approximately 30 × 40 cm2 was cut into 2 × 2 cm2 pieces. The thickness of all individual samples was determined with a thickness measuring device (160 kPa contact pressure) and only samples with a thickness of 200 ± 4 μm were used.
Cell setup
The 4 cm2 cell used was designed by Fraunhofer ISE. 27 The current collectors and flow fields are made of gold-coated titanium. The contact force is applied with an adjusting screw perpendicular to the cell's base area and is monitored with a load cell between the screw and the cell (K-14 with GM77, Lorenz Messtechnik GmbH). The applied force after thermal conditioning was 3 kN for every compression level. Figure 1a illustrates the cell unit in an uncompressed state.
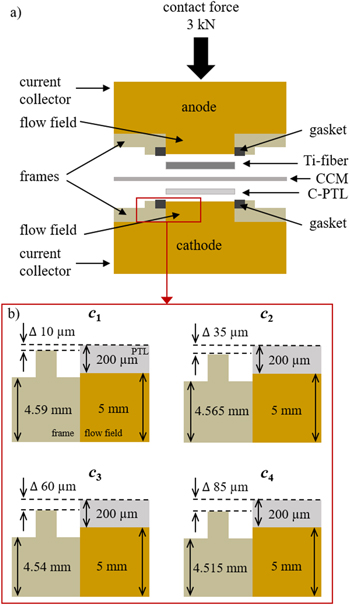
Figure 1. Schematic illustration of the 4 cm2 cell in (a) and the functionality of different compression levels in b). Gaskets between the frame and the flow field are not shown for clarity in b). The compression is increasing from c1 to c4. The shown thicknesses and heights are not true to scale and refer to the uncompressed state. This scheme is published with the permission of Fraunhofer ISE.
Download figure:
Standard image High-resolution imageFor means of isolation and proper positioning of both PTLs, each electrode block is equipped with a frame made of PEEK. The different compression levels were introduced by different thicknesses of the cathode frames. In Fig. 1b, the cell setup is visualized for an uncompressed state. Since an identical anode frame was used in all measurements and the carbon PTL-c is highly compressible, it is assumed that most of the compression acts on the cathodic cell compartment. Further, the cell is sealed with a flat gasket (60 FC-FKM 200, 0.8 mm, Freudenberg) on the frames around the flow fields at both electrodes. The same gaskets were used for all measurements.
In this work, the compression levels are referred in increasing order as c1, c2, c3 and c4. Within the figure, it can be seen that compression level c1 has the thickest frame, resulting in a low excess length of the PTL-c above the frame (Δ 10 μm). Thus, the resulting compression is the lowest. In contrast, c4 has the thinnest frame and the largest PTL-c excess length (Δ 85 μm) which results in the highest compression.
The contact pressure distribution across the active area and the gasket area was determined with measuring films (types LLW, LW and MW, Prescale by Fujifilm). For this, the CCMs were replaced with the measuring films while the PTLs and the gaskets remained in the cell. Then, the contact force of 3 kN was applied at one stroke. The films were evaluated with software provided by Fujifilm.
Testing periphery
The measurements were performed in a E100 test station by Greenlight Innovation. As a current source, a BCS 815 potentiostat (BioLogic) was used. For the analysis of the dried anodic product gas, the anode gas outlet was connected to a gas chromatograph (GC, 490 μGC System, Agilent). Helium was used as the carrier gas. The gas chromatograph is equipped with 5 Å mole sieve columns of 10 m length and a thermal conductivity detector. Prior to the measurement, the system was calibrated with known H2 in O2 mixtures.
As high hydrogen contents were expected at low current densities and high cathode pressures, the anode product gas was diluted with an additional flow of oxygen. The constant mass flow of 0.06 g min−1 ( = 3.125 · 10−5 mol s−1) was supplied with a mass flow controller (EL-flow Prestige, Bronkhorst).
The measured hydrogen content at the GC  is described with Eq. 1, where the evolved O2 flux is equal to
  i is the applied current density and F is the Faraday constant.

Solving Eq. 1 for the molar flux of permeated hydrogen  leads to Eq. 2. Then, the real hydrogen content
  is eventually calculated by Eq. 3.


Measurement protocol
After assembly, the cell was mounted into the test station. Figure 2 shows a schematic summary of the applied measurement protocol for each compression level. Prior to starting the measurements, the cell was thermally conditioned without polarisation for 1 h at 80 °C and 80 ml min−1. Then, the hydrogen crossover and the polarisation behaviour were measured at four different absolute cathode pressures (1 bar, 5 bar, 10 bar and 15 bar), whereas the anode pressure remained at 1 bar. The protocols are described in more detail in the following sections.
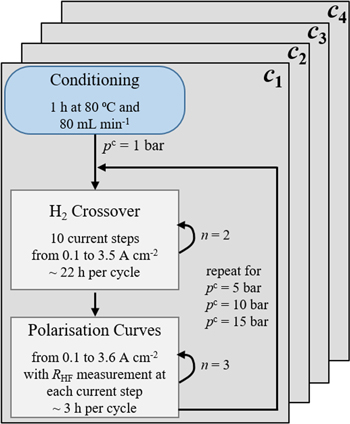
Figure 2. Summary of the used measurement protocol for each compression level, where n is the number of cycles.
Download figure:
Standard image High-resolution imageHydrogen crossover
The hydrogen crossover was evaluated by measuring the anodic hydrogen content with the GC. For this, a galvanostatic step profile was used. One measurement cycle consisted of ten current density steps (4 h at 0.1 A cm−2, 3.5 h at 0.25 A cm−2, 3 h at 0.5 A cm−2, 2.5 h at 0.75 A cm−2, 2 h at 1 A cm−2, 2 h at 1.5 A cm−2, 1.5 h at 2 A cm−2, 1.5 h at 2.5 A cm−2, 1 h at 3 A cm−2 and 1 h at 3.5 A cm−2). The time intervals were chosen by using information from previous studies, until a constant hydrogen in oxygen signal was measured. 15,16,28 Due to low gas production rates, the holding time at low current densities is longer than at higher current densities.
Two cycles were performed at each cathode pressure. At pc = 1 bar, an extra cycle was passed in order to purge the test station. At pc = 15 bar the cycle started at 0.5 A cm−2 for maintaining the safety limits despite oxygen flushing.
Polarisation curves
After the crossover measurements, polarisation curves were recorded from 0.01 A cm−2 to 3.6 A cm−2 in logarithmic current density steps until 2 A cm−2 and steps of 0.2 A cm−2 for higher current densities. The holding time was 10 s at each step. Each current step was followed by an electrochemical impedance measurement in order to determine the high frequency resistance RHF. The frequency range was set from 10 kHz to 100 Hz and a respective current amplitude of 10% was applied. RHF was obtained by interpolating the Nyquist plots at the intercept with the real axis.
This procedure was repeated twice. The average of the three cycles was used for further evaluation of the data. The measurement error was calculated by standard deviation.
Results and Discussion
Influence of compression level
As already introduced above, the cell compression has consequences on the polarisation behaviour of PEM water electrolysis cells and on the material properties. For PEM fuel cells, it is already well known that the compression of the porous materials has negative consequences for the cell performance. The reduced porosity and increased tortuosity of the materials result in a limited mass transport towards the electrodes, which becomes visible in a mass transport dominated region of the fuel cells polarisation curve. 18,19,21,22,29,30
Besides the impact of the external clamping pressure, it is known that mass transport limitations are also affected by the contact pressure distribution on the active area, which are in turn influenced by the flow field design. 31,32 Hence, the contact pressure distribution on the active cell area is evaluated first. The findings are then used to analyse the compression effect on the polarisation behaviour and on hydrogen crossover of the investigated PEM water electrolysis cells.
Contact pressure distribution
As illustrated in Fig. 1, the compression levels c1, c2, c3 and c4 are achieved by different thicknesses of the cathodic isolation frame. We assume that the compression occurs mainly on the cathode side, since the frames were adjusted there and the carbon PTLs-c are highly compressible, especially compared to the titanium PTL-a used at the anode.
Figure 3 shows the resulting contact pressure distribution of the four compression levels. In general, most of the applied force is transferred over the active area for all compression levels. As expected, the thickest isolation frame c1 shows the lowest overall contact pressure and the thinnest isolation frame c4 has the highest contact pressure, and consequently the highest compression level. Additionally, most of the contact pressure acts on the lands of the flow fields for all compression levels, which results in low pressures in the channel areas (≤1 MPa). The resulting pressure differences between the lands and channel areas are increasing significantly with higher compression. For the highest compression level c4, more than 25 MPa are measured at the maximum.
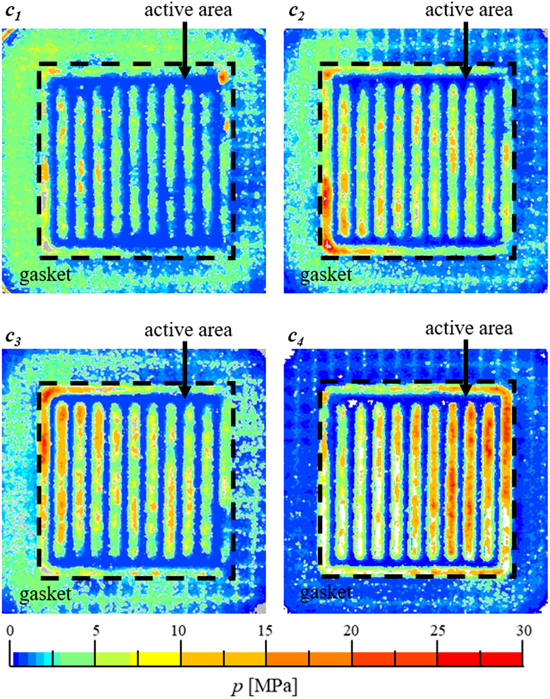
Figure 3. Pressure distribution across the active area and gasket for the four investigated compression levels c1, c2, c3 and c4 in increasing order.
Download figure:
Standard image High-resolution imageIn this regard, it must be emphasized that the contact pressure distributions might be different during electrolysis, as the contact pressure measuring films were integrated into the dry cell, instead of CCMs, at ambient conditions. However, the results indicate that the cell materials are compressed more under the lands than at the channel areas. This means that the resulting strain within the Nafion membrane can be locally very high, leading to membrane deformation. For fully humidified Nafion 212 membranes at temperatures around 80 °C, a Young's modulus between 50 and 100 MPa is reported. 33 Assuming that a wet Nafion membrane is exposed to the same contact pressure distribution as indicated with the pressure measuring films, the resulting strain might be severe. At compression level c4, the maximum stress of 25 MPa would translate to a maximum strain of 25 to 50% and a high local deformation. In contrast, the maximum stress of c1 (∼ 5 MPa) leads to a local strain of only 5 to 10%, which is essentially no deformation. A deeper analysis requires a more detailed investigation of the contact pressure distribution during electrolysis conditions and of the mechanical properties of wet Nafion membranes, which is beyond the scope of this work.
Moreover, it is expected that the porosity of the cathode catalyst layer is affected by the compression levels. 34 As explained earlier, the structural properties of the materials have an impact on the mass transport, 16,35 which is why a compression effect should be noticeable in the polarisation behaviour as well as in the hydrogen crossover. This is examined in the following sections.
Polarisation behaviour
The influence of the compression level on the cell polarisation behaviour and key cell parameters is shown in Fig. 4. In Fig. 4a, the integral cell polarisation is displayed. The cell voltages decrease slightly with increasing compression level. The maximum cell voltage of all compression levels falls below 1.8 V and the deviation at 3.6 A cm−2 is only 30 mV.

Figure 4. Deconvolution of the measured cell voltage at pc = 1 bar for all four compression levels. The integral cell voltage is shown in (a), (b) shows the respective RHF, (c) shows the resulting iRHF-corrected cell voltages and (d) shows ηmtx.
Download figure:
Standard image High-resolution imageFigure 4b shows the obtained RHF values. It is assumed that RHF describes the ohmic cell resistance and is mainly caused by the proton transport resistance of the membrane. It can be observed that an increase in current density leads to a small reduction of RHF. This effect was already reported by others and can be explained by the reduction in resistance due to temperature increases with higher applied current densities. 36,37
With growing compression, RHF is decreasing. This can be explained by a better electric contact between the PTL-c and catalyst layer with increasing contact pressure. This was already reported by others 19,20,22,38 and by Stähler et al. 17 Although they have used a different setup, a resistance RHF = 58 mΩ cm2 is reported for their highest compression level, which agrees well with the values of c4 in this work.
In Fig. 5a, RHF is shown for 1 A cm−2 and 3 A cm−2 as a function of compression. The reduction of RHF with increasing current density can be seen here as well. The compression increase from c1 to c4 leads to a reduction of ∼ 11 mΩ cm2 at both current densities.
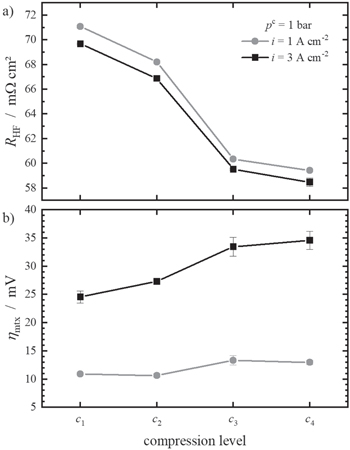
Figure 5. Dependence RHF in a) and ηmtx in b) at 1 A cm−2 (light grey) and 3 A cm−2 (black) on the compression level at pc = 1 bar.
Download figure:
Standard image High-resolution imageIn the next step of the voltage loss analysis, the measured cell voltage is corrected by the ohmic potential drop according to Eq. 4. Figure 4c shows the resulting i RHF-corrected curves.

The effect of the compression level on  is more pronounced at higher current densities (zoom in Fig. 4c). The higher the compression level is, the higher the i
RHF-free voltage is as well. Thus, the compression level has an opposing effect on the i
RHF-free cell voltage than on the integral cell voltage. As the used material was the same in every cell, the differences in the i
RHF-corrected curves are not caused by ohmic losses of the membrane electrode assembly.
is more pronounced at higher current densities (zoom in Fig. 4c). The higher the compression level is, the higher the i
RHF-free voltage is as well. Thus, the compression level has an opposing effect on the i
RHF-free cell voltage than on the integral cell voltage. As the used material was the same in every cell, the differences in the i
RHF-corrected curves are not caused by ohmic losses of the membrane electrode assembly.
In order to explain the opposing trends between the integral and i
RHF-free cell voltage, a Tafel analysis can be performed. For this, the open circuit voltage  at 80 °C is calculated according to Nernst's equation (Eq. 5) and then subtracted from
  (Eq. 6). Assuming a reference pressure of
  = 1 bar and that the evolved gases are saturated with water vapour (
 = 0.47 bar
39
), a value of
= 0.47 bar
39
), a value of  = 1.169 V is determined. The remaining overpotential η is assumed to be the sum of the activation overpotential ηact and other overpotentials such as mass transport losses ηmtx. The latter can be interpreted as a measure of quality for the removal of the two product gases and depends on the structural design of the electrodes.


According to the Tafel analysis, the activation overpotential ηact can be obtained by fitting η against log(i) in its linear regime between 0.01 and 0.1 A cm−2. The obtained Tafel slopes for the four investigated compression levels are quite close to one another, with values of 47.7 ± 0.9 mV dec−1 (Tafel plots are located in supplemental information—Fig. S1 available online at stacks.iop.org/JES/169/014502/mmedia). This implies that the kinetics are identical for all compression levels and consequently fail to explain the visible differences in 
As a last step of the voltage loss analysis, ηmtx is shown in Fig. 4d. Here, clear indications for the divergences in i RHF-free polarisation can be seen. With increasing current density, ηmtx rises. This was reported previously by others 35,37,38 and was also predicted by modelling. 40
Moreover, ηmtx increases with increasing compression level. The effect of compression on ηmtx is more pronounced at higher current densities. In Fig. 5b, ηmtx at 1 A cm−2 and 3 A cm−2 is shown as a function of the compression level. At 1 A cm−2, the effect of increased compression can barely be seen whereas at 3 A cm−2 the increase of ∼ 10 mV from c1 to c4 is significant.
The effect of the compression level on the mass transport losses could be a result of changed structural properties of the cathode. The previously described structural changes of the PTL-c due to compression should also be true for the catalyst layer, in which the pores are even smaller. Perhaps, the diffusive pathways under the lands are completely different from the pathways in between the lands. As the pore volume is reduced, the transition of evolved, dissolved H2 from the catalyst through the ionomer into the gas phase, is hindered. 16,34 Thus, the reduced permeability of both the PTL-c and catalyst layer, and the reduction of the surface between the pore space and the ionomer within the catalyst layer, could result in higher mass transport limitations within the more compressed cells than in less compressed cells. This eventually becomes visible in the mass transport losses (cf. Fig. 4d). 18,19,22
This contrary effect on the cell parameters must be kept in mind when a PEM water electrolyser system is designed. Although high compressions lead to reduced ohmic losses, the mass transport losses increase. Thus, more than one cell parameter, such as low cell voltages or RHF, should be considered for system design, and the trade-off between RHF and ηmtx should be found.
Hydrogen crossover
The anodic hydrogen content and the resulting hydrogen crossover fluxes at pc = 1 bar as a function of the applied current density are shown in Fig. 6. Regarding the H2 in O2 content (Fig. 6a), it is observed that a safe operation begins at 0.25 A cm−2 (H2 in O2 content < 2% or 50% LEL 41 ) and that the contents show a re-ascent with increasing current density. The latter finding was already seen by others. 9,17,28 In the re-ascending content region above 1 A cm−2, the influence of the compression level becomes visible: the higher the compression level is, the higher is the resulting hydrogen content and the slope of the ascent.
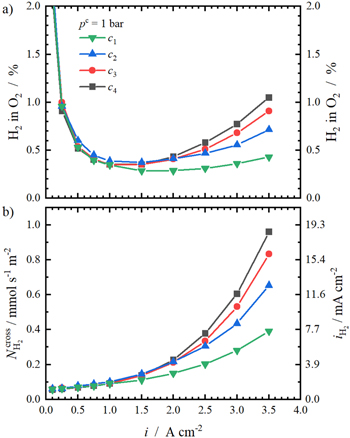
Figure 6. Current dependence of H2 in O2 content for the four investigated compression levels at pc = 1 bar is shown in (a). In (b), the resulting anodic hydrogen flux  and the permeation current density equivalent
  is displayed.
Download figure:
Standard image High-resolution imageFigure 6b shows the resulting hydrogen crossover fluxes calculated according to Eq. 2. Up to 1 A cm−2, the fluxes of all compression levels are nearly identical and show a linear dependence on current density. In a previous study, Trinke et al.
14
have reported on this linear relationship with current density up to 1 A cm−2. The dependence on current density can be explained with the super-saturation of water with evolved hydrogen.
14,18,42,43
Further, the slope is no longer linear and depends on the compression level at higher current densities. The combination of high compression and high currents leads to significant increases in  At the maximum current density of 3.5 A cm−2,
  of c4 is more than the double of the lowest compression c1 (1 mmol s−1 m−2 vs 0.4 mmol s−1 m−2).
As mentioned previously, not only the porosity of the PTL-c and the catalyst layer is reduced with increasing compression, but also the surface between the ionomer and pore volume is reduced. Especially under the lands, the H2 removal from the active sites into the free pore space is hindered and occurs mainly in plane. 34 This results in a higher dissolved gas concentration and accordingly, in a higher hydrogen crossover flux. 34 This effect might be comparable to an ionomer variation within the catalyst layer. Trinke et al . 16 and Bernt et al . 9 varied the ionomer content with the cathode catalyst layer which translated into a reduction in pore space and a thickening of the ionomer film surrounding the catalyst particles with increasing ionomer content. This eventually results in higher mass transport limitations leading to higher dissolved hydrogen concentrations, enhanced hydrogen crossover fluxes and increased ηmtx.
To summarize the section of the compression impact at ambient pressure conditions, the results of the polarisation curves and of the crossover measurements agree well with each other and with the work of Stähler et al. 17 The results indicate that the enhanced compression affects the mass transport at the cathode side. This leads to limitations in hydrogen removal, which becomes visible in higher mass transport voltage losses and in higher hydrogen crossover. Although the compression has a positive effect on the overall cell voltage, these contrary effects need to be considered in the system design.
Influence of cathode pressure
In the first part of this study, the findings of Stähler et al. 17 were validated successfully in a different cell setup. Therefore, the discussed compression effects are qualitatively valid with different cell designs. However, the quantitative course is affected by the different cell designs.
In the next part of this study, the impact of enhanced cathode pressure on top of the compression levels was investigated. The evaluation of the cross-relationships between compression and gas pressure is necessary for gaining an extensive knowledge on the electrochemical and gas transport properties in PEM water electrolysers.
Polarisation behaviour
For the evaluation of the cathode pressure dependence of the cell voltage, the cell voltage will be analysed for different pressures (pc = 1 bar; 5 bar; 10 bar; 15 bar). Since the pressure dependencies are similar for each compression level, the cell voltage analysis shown in Fig. 7 is performed exemplarily for c4. The corresponding figures for c1, c2 and c3 are shown in the Supplemental Information (Figs. S2, S3 and S4).
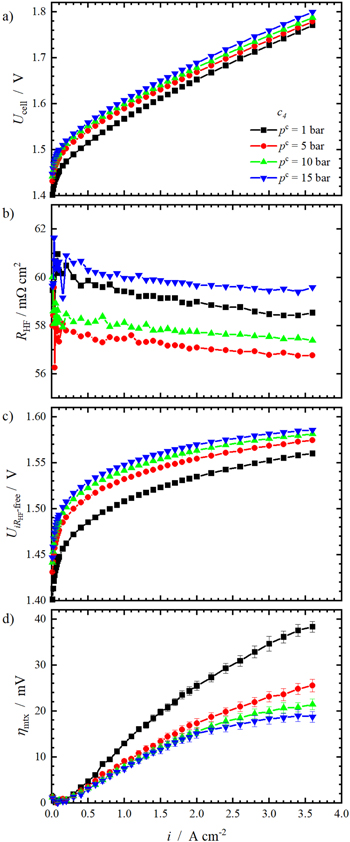
Figure 7. Deconvolution of the measured cell voltage pc = 1 bar, 5 bar, 10 bar and 15 bar for compression level c4. The integral cell voltage is shown in (a), (b) shows the respective RHF, (c) shows the resulting iRHF-corrected cell voltages and d) shows ηmtx.
Download figure:
Standard image High-resolution imageFigure 7a shows the measured cell voltage for the named pressures using c4. It can be observed that the cell voltage is higher with increasing cathode pressures. This agrees well to the reversible cell potential according to Nernst's equation. In Fig. 7b, the respective RHF are shown. As in the previous section, RHF decreases with increasing i at each pressure. Further, RHF is the lowest at pc = 5 bar and the highest for pc = 15 bar, which is also true for the other compression levels (cf. Figs. S2, S3 and S4). This finding will be discussed in more detail at a later point of this section.
From the integral cell voltage and RHF,  is calculated and shown in Fig. 7c. Here, the pressure dependence of the voltage according to Nernst can be seen as well. For the further separation of the overpotentials according to the procedure described previously, the open circuit voltage at the respective cathode pressure levels were calculated according to Eq. 5 and subtracted from
  The purpose of this correction is to avoid an incorrect mapping of the increased reversible cell potentials at elevated cathode pressures to the mass transport losses (cf. Nernst's Eq. 5).
A further analysis of η according to Tafel reveals that the Tafel slopes of all measurements coincide with values of 47.9 ± 0.5 mV dec−1. The respective Tafel plots of all compression levels and pressures are shown in Fig. S1. Hence, neither a dependence of the compression level nor of the cathode pressure on the cell kinetics can be identified.
As a last step of the voltage loss analysis, ηmtx was calculated and displayed in Fig. 7d. As in the previous section, ηmtx rises when the current density increases. Further, ηmtx decreases with enhanced cathode pressure. This positive effect of enhanced pressure on ηmtx was already reported by others. 36,40
In order to compare and discuss the pressure influence on key cell parameters (RHF and ηmtx) together with the impact of compression, RHF and ηmtx at 3 A cm−2 are shown as a function of cathode pressure in Fig. 8. In Fig. 8a, the aforementioned positive effect of enhanced compression on RHF is visible again. This is due to lower interfacial contact resistances with increasing compression 6,19 and applies for all pressures.
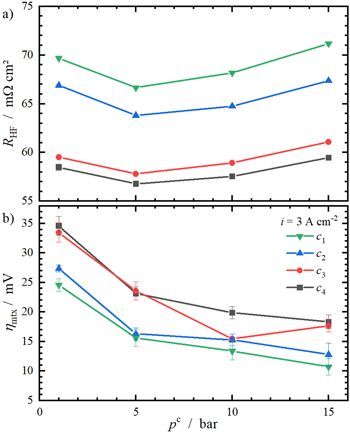
Figure 8. Dependence of ηmtx and RHF at 3 A cm−2 on the cathodic pressure pc.
Download figure:
Standard image High-resolution imageAs mentioned previously, RHF shows a nonlinear relation with pc. For all compression levels, RHF is the lowest at pc = 5 bar. To the best of our knowledge, this was not observed and reported before.
We assume that the contact pressure distribution on the lands and at the channel areas plays an essential role for the nonlinearity of RHF. As shown in a previous section, the contact pressure on the lands is far higher than in between (cf. Fig. 3). Following from this, we propose the following hypotheses for the nonlinearity of RHF with increasing cathode pressure.
First, the structural properties of the cathode might be a function of both, the contact pressure and the cathode pressure. In a previous work of Schuler et al. 37 the influence of the PTL structure on the electrochemical performance of PEM electrolysis cells was investigated. Qualitatively, they found that RHF using highly porous PTLs is higher than with low porosities, since the contact resistances of the catalyst layer-PTL interface rise with increasing porosity. When the porosity of a highly compressed carbon PTL-c is considered to be lower than of a less compressed PTL-c, the same trend is observed in this work. Moreover, we assume that the PTL-c porosity between the lands is higher than at the lands, because the compression force acts mainly on the lands of the flow field. Since the applied cathode pressure is far lower than the contact pressure resulting on the lands, we believe that only the PTL-c areas at the channel areas can be affected by the cathode pressure. Therefore, a slight increase in the cathode pressure might lead to reduced interfacial resistances which would result in lower RHF. In contrast, too high cathode pressures might enlarge the pore space again, leading to a contrary effect.
The second proposed hypothesis addresses the pressure impact on the entire membrane electrode assembly. It is logical that an increase in cathode pressure acts through the membrane to the anode catalyst layer, 44 which could change the contact resistances on the anode side. In order to examine this hypothesis, we conducted a further experiment in which RHF was measured at various symmetric and asymmetric pressure conditions. The experiment has shown that an increase in anode pressure without an increase in cathode pressure (pa = 5 bar ∣ pc = 1 bar) leads to higher RHF than at ambient pressure (pa = pc = 1 bar). However, the measurement of RHF at pa = pc = 5 bar revealed similar values than at pa = 1 bar ∣ pc = 5 bar. From this, we conclude that the anodic pressure dependence of RHF appears to be different than on the cathode side. Perhaps, the membrane and the cathode catalyst layer are deforming more into the channel areas of the cathode flow field, leading to a reduced contact area when the anode pressure is increased. This might result in higher RHF. Possibly, the more rigid titanium PTL-a on the anode prevents the membrane deformation into the channels on this side and thus, the contact resistances between the PTL and the catalyst layer decrease only, when the pressure comes from the cathode side.
As a third hypothesis we propose that the membrane itself might suffer from compression. It was shown previously that the compression of Nafion membranes leads to changes in its nanostructure, reduces the membrane thickness and lowers its proton conductivity. 45–47 In combination with the inhomogeneous thickness distribution within the active area, the resulting RHF might be affected.
Moreover, deviations in temperature can also lead to changes in e. g. proton conductivity and of course, other explanations may apply. Probably, a mixture of multiple hypotheses will explain the nonlinearity of RHF. The fact that this effect was not reported yet can be a result of several aspects, such as the covered pressure range, the used membrane thickness or the cell setup. Further studies are necessary to elucidate this effect.
Besides RHF, Fig. 8 also includes ηmtx of all compression levels at 3 A cm−2 as a function of cathode pressure. Using compression level c4 at ambient pressure results in the highest ηmtx (∼ 35 mV) whereas c1 at pc = 15 bar results in the lowest value (∼ 16 mV).
Further, there are two observable trends for ηmtx. First, ηmtx rises with enhanced compression level at each investigated pressure. Second, ηmtx decreases with increasing cathode pressure. The former was already seen in the previous section in which the compression dependency of ηmtx was discussed. The latter is a result of the logarithmic course of the cathodic half-cell potential  which can be seen from Nernst's equation for the cathodic half-cell reaction (Eq. 7).

The dissolved hydrogen concentration  increases with the applied current density, whereas the hydrogen saturation concentration
  is a function of the hydrogen pressure and rises with the hydrogen pressure. Since the half-cell potential increases logarithmically with the hydrogen concentration
  the mass transport losses decrease at elevated hydrogen pressures.
In summary, the increases in compression and cathode pressure show contrary effects on ηmtx. An increased cell compression leads to higher mass transport losses, whereas higher cathode pressure reduces them.
Hydrogen crossover
In a previous section we have seen that an enhanced compression of PEM water electrolysis cells leads to increased H2 in O2 contents at high current densities. This may be explained by either one or by both of the following effects: First, the pores within the PTL-c and catalyst layer are diminishing with enhanced compression, which results in lower gas permeability and hence, worse gas transport properties. Second, the transition of the dissolved hydrogen gas into the gas phase is hindered, because the surface area between the ionomer and the pores is reduced when the compression is increased.
The first effect depends on the pressure. According to Darcy's law, the gas transport within the porous media is improved at higher gas pressures. Hence, an increase in cathode pressure should counteract the worse gas transport coming from high compressions. If the enhancement of gas pressure due to gas transport within the porous media is dominating, increased cathode pressures should improve the gas transport. Consequently, the increase in crossover at high current densities should be reduced at elevated cathode pressures. However, the opposite effect is reported in literature. 14,15
In contrast, the second explanation describes that the structural change of the porous media with increasing compression leads to higher transfer resistances of the produced gas from the dissolved into the gaseous state. This is explained by the fact that less surface area between the ionomer and pore space is available for the gas transition, when the compression is higher. Thereby, the diffusion path of the dissolved gases through the ionomer becomes longer. As a result, the transfer resistances increase with compression. Thus, if this effect is dominating, it is assumed that the crossover increase with current density will not be reduced at high compression levels in combination with enhanced cathode pressures. 14
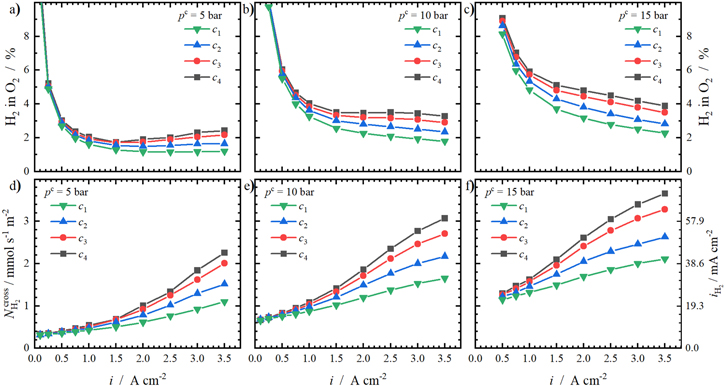
On account of this, we investigated the effect of elevated cathode pressures on top of the compression levels in a next step. In Fig. 9, the H2 in O2 contents of all compression levels at elevated cathode pressures and the resulting hydrogen crossover fluxes are shown. Please refer to Fig. 6 for ambient conditions.
Figure 9. Current dependence of H2 in O2 content at (a) pc = 5 bar, (b) pc = 10 bar, (c) pc = 15 bar and the hydrogen crossover flux  at (d) pc = 5 bar, (e) pc = 10 bar, f) pc = 15 bar. The current density equivalent
  to
to  can be read from the right ordinate in (f).
Download figure:
Standard image High-resolution image
Regarding the hydrogen contents, an increase in compression level results in enhanced H2 in O2 contents at every pressure level. At pc = 5 bar (Fig. 9a), the previously observed increase of the hydrogen concentration at higher current densities (cf. Fig. 6a) is only present for the two higher compression levels c3 and c4. The other two compression levels approach a more hyperbolic trend. Since the H2 in O2 contents stagger around 2 %, safety precautions must be taken. A further increase in cathode pressure leads to even higher H2 in O2 contents. For pc = 10 bar and pc = 15 bar, the re-ascent in concentrations at higher current densities is not present anymore. The resulting high anodic hydrogen concentrations are not only relevant in terms of safety, but also in terms of faradaic efficiency losses.
The data presented in this work was measured in a specific experimental setup. In a previous study by Trinke et al., 14 the importance of the experimental setup on the quantitative results was already highlighted. Slight changes within the setup can therefore lead to other quantitative results. For example, Bernt et al. 9 measured the H2 in O2 content at 80 °C and asymmetric pressure conditions in a similar system as used in this work (Nafion 212, PTL-a made of titanium, PTL-c made of carbon). However, their H2 in O2 contents are much lower than those measured in this work. These differences highlight that the chosen experimental setup has severe consequences on the quantity of results, although the qualitative trends are comparable. Hence, a careful and thorough report of all experimental conditions is inevitable for a meaningful comparison of data in order to develop a comprehensive understanding of hydrogen crossover.
The resulting hydrogen crossover fluxes from the H2 in O2 contents are calculated according to Eq. 2. The respective fluxes at elevated cathode pressures are shown as a function of current density in Figs. 9d–9f. Clearly, the relation between the hydrogen flux and the current is nonlinear for every compression and pressure level. At low current densities, the curves are approaching one another. The extrapolation of the converging curves to i = 0 A cm−2 equals to the expected pure diffusive hydrogen crossover at the corresponding cathode pressure. This basic value rises with the applied pressure because the hydrogen concentration gradient through the membrane increases and results in a higher driving force. 16
At higher current densities, the impact of the compression level becomes visible again. According to the discussed hydrogen contents, the increase of the compression level is followed by higher hydrogen crossover fluxes. At pc = 5 bar, for example,  of c4 is more than the double than of c1 (2.25 mmol s−1 m−2 and 1.10 mmol s−1 m−2, respectively).
Moreover, the absolute crossover gain with the applied current density increases with rising cathode pressures. For example, the crossover gain between 0.5 A cm−2 and 3.5 A cm−2 for the highest compression level c4 at atmospheric conditions is 0.89 mmol s−1 m−2 and increases with pressure: 1.86 mmol s−1 m−2 (at 5 bar), 2.24 mmol s−1 m−2 (at 10 bar) and 2.37 mmol s−1 m−2 (at 15 bar). In contrast, the respective crossover gains at the lowest compression level c1 with cathode pressure are much lower (0.29 mmol s−1 m−2 (at 1 bar), 0.74 mmol s−1 m−2 (at 5 bar), 0.90 mmol s−1 m−2 (at 10 bar) and 0.96 mmol s−1 m−2 (at 15 bar)), but still rise with the cathode pressure.
In summary, the effect of the compression level on hydrogen crossover is amplified by elevated cathode pressures. This observation contradicts a transport limitation in the gas phase, because the gas transport is improved at higher pressures. However, a reduction in hydrogen crossover is not observed but it rather becomes more pronounced. This implies that the steady increase in the dissolved hydrogen concentration explains the progressing increase of hydrogen crossover with greater compression and cathode pressure to a better extent. Furthermore, the resulting anodic hydrogen contents indicate that the operating pressure has a greater impact on the faradaic efficiency than the compression level. A more detailed comparison with regards to the specific energy demand of the usable hydrogen amount at each compression and pressure level is given in the Supplemental Information.
Conclusions
In this study, the cell compression and cathode pressure were varied in order to examine their influence on the cell polarisation behaviour and on hydrogen crossover on pristine materials in a PEM water electrolysis cell.
It was shown that an enhanced cell compression reduces the obtained cell voltages due to lowered interfacial contact resistances. However, a detailed cell voltage analysis revealed that the mass transport losses increase with higher compressions. These mass transport restrictions also become visible in increased H2 in O2 contents, which are increasing at higher current densities at ambient pressure. This is explained with a reduced pore volume in the carbon PTL-c and cathode catalyst layer at higher compressions. In terms of the catalyst layer, the reduction of the surface area between the ionomer and the pore space leads to a restricted removal of dissolved hydrogen and higher dissolved hydrogen concentrations. Consequently, the hydrogen concentration gradient across the membrane increases and results in a higher hydrogen crossover.
Furthermore, the impact of enhanced cathode pressures in addition to the compression was evaluated. In terms of the polarisation behaviour, the results show a contrary effect of the two parameters on cell voltage parameters. As a consequence of Nernst's equation, the cell voltage rises with increased pressures, whereas higher compressions are reducing the cell voltage. However, the pressure increase is also lowering the mass transport losses. Moreover, this study shows a first report on the pressure dependence of RHF with an optimal value at medium cathode pressures of pc = 5 bar. Several hypotheses are proposed to explain this observation. Certainly, further investigations on the pressure dependence of RHF are needed to understand this phenomenon.
With regards to hydrogen crossover, it was shown that the pressure increase amplifies the compression influence. Especially at high current densities, the combination of high cathode pressures and high compressions leads to explosive gas mixtures due to high hydrogen crossover fluxes. As mentioned previously, the restricted removal of hydrogen caused by the reduced porosity in the catalyst layer leads to higher dissolved hydrogen concentrations. This increases the driving force for hydrogen crossover.
The presented findings highlight the importance of the structural design of the PTL-c and catalyst layer. Regarding the electrochemical parameters, both layers should be designed in such a way that the interfacial resistances are small, while the mass transport losses are also kept to a minimum. These improvements would lead to reduced cell voltages and lower hydrogen crossover. Besides the structural changes of cell materials, the cell design itself might also be optimized. Other flow field designs, for example, might help to achieve the improvements.
The findings presented here offer a systematic analysis of hydrogen crossover in PEM water electrolysis cells. Since the resulting anodic hydrogen contents measured in our setup lead to a reduced hydrogen output and exceed technical safety limits, improvements are necessary. The structural optimization of the cell materials (e. g. catalyst layer structure) might improve both aspects. However, other strategies such as the integration of a recombination catalyst in the cell could also be a possibility to meet the demands. Both suggestions should be investigated in future in order to generate a comprehensive understanding of hydrogen crossover and to propose an optimal design for PEM water electrolysers.
Acknowledgments
LUH gratefully acknowledges funding of Niedersächsisches Ministerium für Wissenschaft und Kultur within the project InnoEly (grant no. ZN3771).