
Abstract
The impact of graphite materials on capacity retention in Li-ion cells is important to understand since Li inventory loss due to SEI formation, and cross-talk reactions between the positive and negative electrodes, are important cell failure mechanisms in Li-ion cells. Here, we investigate the impact of five graphite materials from reputable suppliers on the performance of NMC811/graphite cells. We show that natural graphites (NG) here have a mixture of 3R and 2H phases, while artificial graphites (AG) were 2H only. We find that there are differences between the N2 BET surface area and the electrochemically-accessible area where redox reactions can take place and it is the latter that is most important when optimizing graphite-containing cells. Part I of this 2-part series investigates physical and electrochemical differences between the graphite materials of interest here, as well as room temperature cycling to probe improvements in capacity retention. We demonstrate that advanced AG materials with small accessible surface areas can improve safety, 1st cycle efficiency (FCE) and long-term cycling compared to NG materials with higher accessible surface areas. Part II of this work examines elevated temperature cycling, cell swelling, and makes lifetime predictions for the best NMC811/graphite cells.
Export citation and abstract BibTeX RIS

This is an open access article distributed under the terms of the Creative Commons Attribution 4.0 License (CC BY, http://creativecommons.org/licenses/by/4.0/), which permits unrestricted reuse of the work in any medium, provided the original work is properly cited.
To address the demands of electric vehicles (EVs) and grid energy storage, Li-ion cells with both high-energy density (for EVs) and long lifetimes (for grid energy storage) are needed, two things that do not often go hand in hand. 1–4 Current research on Ni-rich cells focuses on increasing energy densities via the use of dopants or cathode coatings. 5,6 However, Ni-rich materials exhibit a dramatic lattice volume change during charge-discharge cycling that contributes to particle microcracking and subsequent parasitic reactions with the electrolytes, thus contributing to cell failure. While promising strategies have been demonstrated to mitigate the instability of Ni-rich materials at high voltages, 7–9 the emphasis on ultra-long lifetimes needed for grid storage applications (i.e., decades-long time scale) is lacking since such studies are extremely resource-intensive.
The onset of particle microcracking in Ni-rich materials has been shown to contribute to cell failure, 10 which is greatly reduced by using single-crystal particles in other NMC grades. 11 While particle cracking would be detrimental to the cell, a dominant failure mechanism is Li inventory loss at the negative electrode due to continuous solid electrolyte interphase (SEI) growth. 1 Successful strategies to inhibit Li loss have been demonstrated, primarily the use of electrolyte additives that can dramatically hinder parasitic reactions in the cells and yield long-lived cells. 12 Besides additives, the choice of graphite material influences SEI growth and the rate of parasitic reactions. 13,14 The two main types of graphites materials on the market are natural graphites (NG) and artificial, or synthetic, graphites (AG). While NGs are typically mined from the Earth's crust, AGs are synthesized using a carbon precursor—often petroleum coke—that is heated in an inert atmosphere at temperatures near 3000 °C. 15 NG materials typically have a slightly higher specific capacity due to the presence of fewer turbostratically misaligned graphene sheets compared to AG materials, which allows for more Li to be intercalated. However, it is thought that the higher "p-value" of AG materials resulting, from a higher degree of turbostratic misalignment, helps pin adjacent graphene layers together, thus minimizing exfoliation and improving lifetime. 16
The impact of graphite choice on the lifetime of NMC811 cells has not been extensively studied since most current research focuses on the cathode material side. However, the graphite electrode greatly affects the rate capability, SEI composition and passivation, Li loss, gas formation, and lifetime, 2,14,17,18 so understanding the interplay between NMC811 and various graphite materials is important. In this work, we study the impact of three NGs and two AGs from reputable suppliers on the lifetime of NMC811 cells with "bimodal" cathode morphology, 19 and compare it to previous data collected on NMC811/graphite cells that used Kaijin AML400 graphite (referred to as AGA here). 20 Table I summarizes some of the physical properties of the graphite materials in this work as provided by the suppliers or measured by us. NG materials are called NGA through NGC and AG materials are called AGA (Kaijin AML400) through AGC. The N2 BET specific surface areas of NGA and NGB, as well as AGB and AGC were very similar, while NGC and AGA had the highest specific surface area in their respective categories. The BET surface areas are important to note here because later on they will be shown to have little to no correlation with the accessible surface area that the electrolyte molecules can access, which highlights a challenge with screening graphites for high performing cells based on physical properties alone. In Part I of this work, we examine the graphite material properties with XRD and SEM, evaluate their contribution to Li-ion cell safety with accelerated rate calorimetry (ARC), examine the composition and volume of gases generated in pouch cells during formation, and evaluate their performance using long-term cycling at ambient room temperature (RT). Powder XRD was used to determine the degree of crystallinity of the different graphites (turbostratic misalignment, Pr), the presence of the 3R rhombohedral phase, and the suspected presence of a surface coating on NGs. ARC measurements were used to probe the reactivity of lithiated graphites with the electrolyte to probe the impact of surface area on safety. Additionally, gas formation in the pouch cells was studied with in situ gas measurements and GCMS to rank the electrochemically-active surface in the various graphites.
Table I. Some physical properties of the graphite materials in this work.
| Material | D50 (μm) | Surface area (m2 g−1) | Tap density (g cc−1) |
|---|---|---|---|
| NGA | 17.33 | 1.46 | 1.07 |
| NGB | 16.59 | 1.50 | 1.20 |
| NGC | 16.40 | 1.67 | 1.09 |
| AGA | 16.02 | 1.29 | 1.08 |
| AGB | 17.94 | 1.08 | 1.40 |
| AGC | 15.64 | 1.00 | 1.12 |
Experimental Methods
Pouch cells and electrolyte
Machine-made pouch cells with ∼240 mAh nominal capacity were received from LiFUN (Hunan province, China) with no electrolyte. The positive electrode material was a mixture of polycrystalline NMC811 and single crystal NMC811 where the smaller single crystal particles were able to fit in the spaces between the larger polycrystalline particles, hence the designation "bimodal NMC811." Cells were cut open in an Ar glovebox and dried at 120 °C under dynamic vacuum prior to filling with 0.85 ml (∼1 g) of electrolyte. The electrolyte used was a solvent blend of ethylene carbonate (EC), ethyl methyl carbonate (EMC), dimethyl carbonate (DMC) in a 25:5:70 wt. ratio and 1.5 M LiPF6 salt. Additive blends used were 2 wt.% vinylene carbonate (VC) and 1 wt.% ethylene sulfate (DTD) referred to as 2VC1DTD here, or 2 wt.% fluoroethylene carbonate (FEC) and 1 wt% lithium difluorophosphate (LFO) referred to as 2FEC1LFO. Cells were held at 1.5 V for 24 h after electrolyte filling to allow for proper wetting of the jelly roll, then underwent a C/20 charge-discharge formation cycle between 3.0 to 4.06 or 4.2 V at 40 °C. After the formation cycle, cells were charged to 3.8 V for electrochemical impedance spectroscopy (EIS) as described below. Cell and electrolyte specifications are listed in Table SI.
Scanning electron microscopy (SEM)
SEM imaging was done using a NanoScience Phenom Pro G2 Desktop Scanning Electron Microscope. A small piece of each graphite electrode was taken from pouch cells and mounted onto adhesive carbon tape.
X-ray diffraction (XRD)
XRD patterns were collected with a Bruker D8 diffractometer equipped with a Cu target X-ray tube and a diffracted beam monochromator. Samples were measured in the scattering angle (2θ) range of 10°–110° in 0.05° increments with 20 s per step, and 1° divergence and 1° anti-scatter slits were used. The CARBONXS program developed by Shi et al. was used to fit the XRD patterns to quantify turbostratic misalignment, Pr, and preferred orientation, Po. 21
Half-cell coin cells
Graphite electrodes were taken from the pouch cells described above and 12.5 mm disks were punched from the single-sided region of the electrode. Half-cell coin cells were then assembled with a Li foil counter electrode and one Celgard separator as described previously. 22 Graphite half cells were cycled at C/20 between 0.005–1.5 V on ultra-high precision chargers (UHPC) at 40 °C.
Accelerating rate calorimetry (ARC)
ARC measurements were done using the procedures described by MacNeil et al. 23 NMC811/Graphite pouch cells were prepared as described previously and cycled at C/20 between 3.0–4.20 V at 40 °C with a 12 h hold at top of charge at cycle 3 to ensure uniform Li intercalation in the graphite. After cycling, cells were cut open at the charged state in a glovebox, where ∼200 mg of lithiated graphite was scraped off the negative electrode and added to ∼200 mg of 2VC1DTD electrolyte in an ARC sample tube as described by MacNeil et al. Samples then underwent a heat-wait-search protocol, where they were heated at 10 °C min−1 from 40 °C to 260 °C, or until a self-heating event was detected during the 10 min wait period.
In-situ gas measurements
In-situ gas measurements were made using the apparatus and procedure described by Aiken et al. 24 Cells were suspended in silicone vacuum pump oil and the change in weight was measured using sensitive strain gauges during electrochemical cycling in a 40.0 ± 0.1 °C temperature-controlled box. In-situ gas cells underwent a C/20 formation cycle, followed by x5 C/3 cycles between 3.0 and 4.2 V and a 12 h. hold top of charge.
Gas-chromatography mass spectrometry (GCMS)
A Bruker GCMS was used to identify the gases formed in the cell during formation. Pouch cells were fitted a "gas extraction port" as described by Schmiegel et al. which allowed for non-destructive sampling of the gas generated in the cell. 25 Cells were charged to a certain UCV at C/100 and 40 °C, then 100 μl of gas was injected into the GCMS column with an air-tight syringe. The MS detector used was sensitive to CO, CO2, and light hydrocarbons.
Long-term cycling
Long-term cycling tests on NMC811 li-ion cells were done on a Neware cycler (Shenzhen, China). Cells were cycled at ambient RT between 3.0 and an upper cut-off voltage (UCV) of 4.06 or 4.2 V at C/3 rate with constant-current (CC) charge with a constant-voltage (CV) hold until the current dropped to C/20 current, and CC discharge, with a C/20 "checkup" cycle every 100 cycles to monitor low-rate capacity retention.
Results and Discussion
Material properties
Figure 1 shows SEM images of the top surface (which would touch the cell separator) of fresh graphite electrodes taken from pouch cells. The NG materials had a spherical particle morphology, while the AG materials had flake-like particles and were more densely packed than the NG materials.

Figure 1. SEM images of the different graphite electrodes in this work.
Download figure:
Standard image High-resolution imageTo determine the degree of crystallinity of the various graphites, powder XRD was used and the XRD patterns were fitted to extract the Pr value using the CARBONXS program. 21 Figure 2 shows the powder XRD patterns for all materials in this work except AGA (no powder was available for this material) in the 40°–90° range. The data is shown in black, and the fitted pattern is shown in orange, while the dashed lines show the positions of peaks associated with the rhombohedral 3R phase.

Figure 2. XRD patterns for different the graphite powders (black) and fits using CARBONXS (orange) in the 40°–90⁰ region. Dashed lines show the positions of peaks corresponding to 3R graphite which are absent in AGs.
Download figure:
Standard image High-resolution imageFigures 2a–2b show that AG materials have little to no 3R phase and that it is primarily 2H graphite. On the other hand, Fig. 2c–2e show that NGs have a significant 3R component (dashed lines). Fitting the XRD spectra shows that AGB and AGC have ∼8.8 and 10.5% probability of turbostratic misalignment, and a preferred orientation factor, Po, of 1.66 and 3.36, respectively. NGs on the other hand showed a significantly higher degree of crystallinity with only 3%–4% probability of turbostratic misalignment. The parameter, Pt, denotes the probability of finding a graphene layer in the "C" position after two layers which were stacked AB. Pt, therefore, indicates the probability of finding a 3R stacking sequence within the 2H phase. Since NGs had a significant 3R phase, the fitting parameters were varied manually to get best agreement (denoted with *) since CARBONXS is designed to fit 2H graphite with stacking faults and cannot reliably fit a mixed phase graphite spectrum automatically. The impact of the 3R phase on the performance of NG materials, if it persists during cycling, is unclear. Figure 2 highlights the crystallographic differences between AGs and NGs, and Fig. S1 (available online at stacks.iop.org/JES/168/110543/mmedia) shows the full XRD spectra between 10°–110°, where close inspection of the 002 peak at ∼25° showed the presence of a hump in the NG spectra. Zheng et al. demonstrated that carbonaceous materials heated at 500 °C–1000 °C have a hump around 25° in the XRD pattern, suggesting that the NGs in this work have some form of carbon coating applied at low temperature. 26 Figure 3 shows the results of fitting the 002 peaks for the different graphites to estimate the weight ratio of the carbon coating. Fityk version 0.9.8 was used to fit the 002 peaks with normalized Pseudo-Voigt functions to estimate the amount of coating in the NGs. Fitting parameters are indicated in the panels in Fig. 3. It appears that AGs did not have any low-temperature carbon coating applied to them, while NGs appear to have a substantial coating. The fitting results in Figs. 3c–3e suggests that the coating applied to NGs accounts for ∼5 wt.% of the material. It has been shown before that carbon-coated NG have an improved performance compared to uncoated materials. 27–29 For example, Ding et al. showed that a CVD carbon-coating applied at 1000 °C led to improved CE, specific capacity, capacity retention in NGs, while also decreasing the BET surface area. 27 Yoshio et al. showed that the CE of spherical NG particles increased with the amount of carbon coating which was attributed to decreased electrolyte reduction. 28
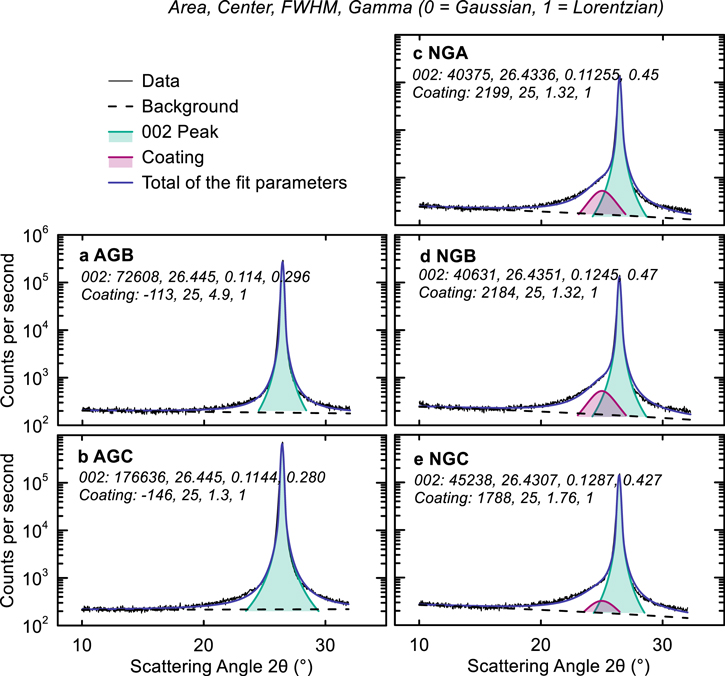
Figure 3. Graphite 002 peak fitting. Peak area, center, FWHM, Gamma (0 = Gaussian, 1 = Lorentzian) for 002 peak and hump around 25° are shown in each panel. Peak fitting was done using Fityk 0.9.8 with a normalized Pseudo-Voight function.
Download figure:
Standard image High-resolution imageHalf cell data and ARC
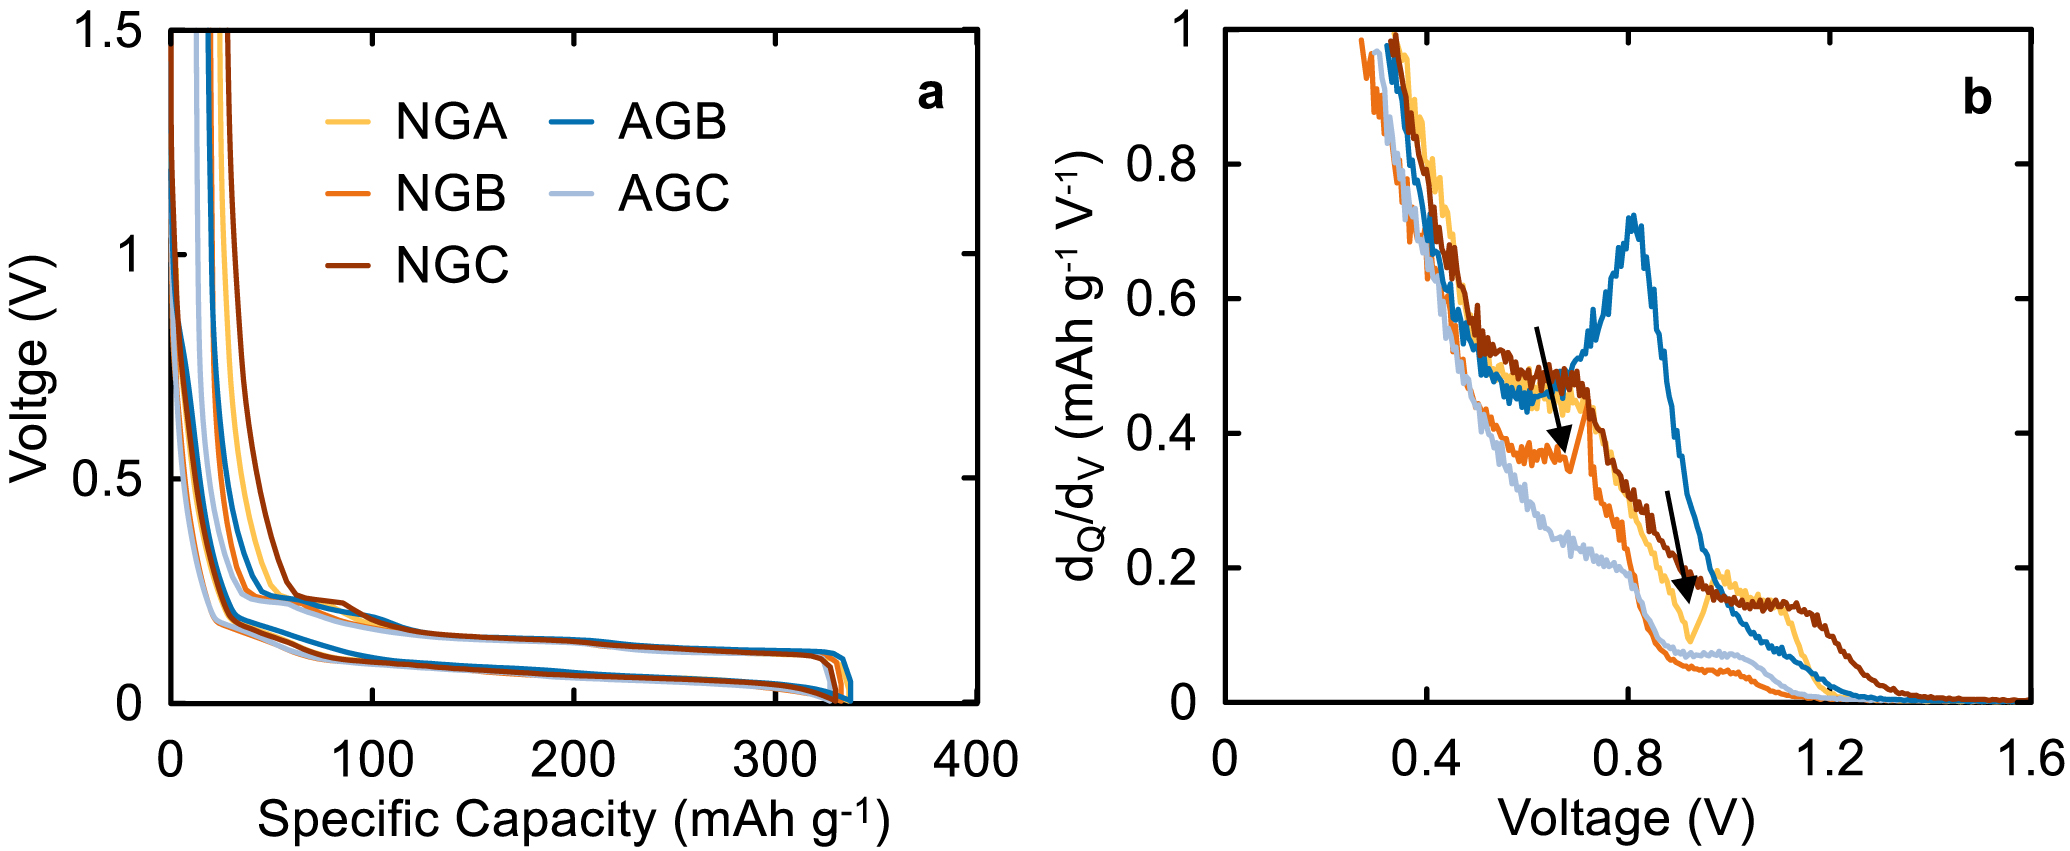
Figure 4 shows the half cell data for graphite materials studied here. Figure 4a shows the typical graphite voltage curve with plateaus corresponding to the different coexisting phase regions between graphite stages. 30 The specific capacities in Fig. 4a were between 330–345 mAh g−1 which is lower than the theoretical graphite capacity of 372 mAh g−1 and can be attributed to defects in the structure such as turbostratic misalignment and to incomplete lithiation due to diffusion limitations. 31 Figure 4b shows peaks in the dQ/dV vs V plot that correspond to electrolyte reduction activity; and the area under these peaks corresponds to the degree of electrolyte reduction. Table I shows that AGB and AGC had similar N2 BET surface area, thus it was expected that these graphites would have comparable electrolyte reduction activities. However, Fig. 4b shows that this is not the case, where the dQ/dV peaks for AGC were much smaller than AGB, highlighting the discrepancy between the active surface area accessible to N2 molecules and the larger electrolyte molecules. While it is difficult to directly measure the electrochemically active surface area that the electrolyte can access, it can be qualitatively ranked by examining electrolyte reduction peaks in dQ/dV plot, as well as the 1st cycle efficiency (FCE), gas evolution during formation, and parasitic heat flow, all of which will be discussed later. Graphite with large electrochemical surface area will consume more electrolyte and Li inventory during SEI formation, thus lowering first cycle efficiency Fig. 4b shows that less reactive graphites can hinder electrolyte reduction and we will further investigate the impacts of this small accessible area on cell performance.
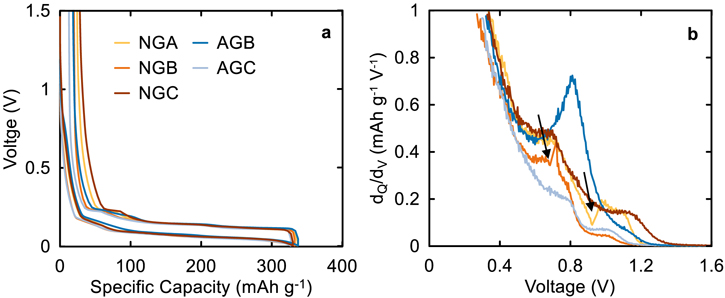
Figure 4. (a) Voltage (V) vs specific capacity (mAh g−1), and (b) dQ/dV vs voltage (V) for Graphite/Li coin cells with 2VC1DTD electrolyte cycled between 0.005–1.5 V vs Li/Li+ at 40 °C. Cells were cycled at C/20 rate on UHPC cyclers. Black arrows indicate a glitch in the data due to a power failure caused by inclement weather.
Download figure:
Standard image High-resolution imageAnother consequence of electrolyte reactivity with the charged graphite material is poor cell safety. MacNeil et al. evaluated the safety of various carbon materials using ARC and correlated their self-heating rate (SHR) to BET surface area. 23 Using the same approach as MacNeil et al., we examined the reactivity of lithiated graphite powders taken from pouch cells with 2VC1DTD electrolyte. Figure 5 shows the ARC results from lithiated graphite material taken from NMC811/Graphite pouch cells. Figure 5a shows the bomb temperature vs time for the 5 different graphites, where self-heating events correspond to a rise in temperature during the holding periods. Materials with improved safety will experience self-heating at higher bomb temperature that corresponds to SEI breakdown and reactions between the electrolyte and intercalated Li. Figure 5b shows the change in temperature with time (dT/dt) vs bomb temperature. It is clear in Fig. 5b that AGB and AGC experience self-heating rates similar to the NGs but at higher bomb temperatures. By taking the bomb temperature at a given SHR, say 0.2 °C min−1 (dashed line), we can compare the differences in safety that these materials exhibit. Figures 5c- 5d shows bomb temperature at 0.2 °C min−1 vs first cycle efficiency (FCE) and BET area. Figure 4b points to a distinction between BET and electrochemically accessible surface areas, so Fig. 5c–5d examine the relationship between safety and the different surface area metrics, where FCE is taken as an indicator of electrochemically accessible area since electrolyte reduction on the graphite surface will impact FCE. Here, FCE was measured in NMC811/Pouch cells formed between 3.0–4.20 V at 40 °C and C/20 charge-discharge currents as described in the experimental section above. It is clear that there is no correlation between bomb temperature at 0.2 °C min−1 and FCE, but there is some correlation with BET area. MacNeil et al. 23 also showed a correlation between reactivity of lithiated graphites and BET surface area.

Figure 5. (a) Bomb temperature (°C) vs time (min.) and (b) log(dT/dt) (°C min−1) vs bomb temperature (°C) obtained from ARC safety tests on a 1:1 weight mixture of 2VC1DTD electrolyte and lithiated graphite powder taken from a charged pouch cell. Cells underwent x3 C/20 cycles between 3.0–4.2 V with a 12 h. CV hold at top of charge prior to harvesting the graphite electrode for ARC tests.
Download figure:
Standard image High-resolution imageSEI passivation and RT cycling
The graphite choice plays an important role in cell lifetime since significant capacity loss in Li-ion cells comes from Li inventory loss at the negative electrode. 1 Therefore, a well passivated graphite with a robust SEI will lead to a slower rate of parasitic reactions in the cell. Numerous reports showed that gas generation is a consequence of unwanted parsitic reactions, 12,32 so examining gas generation can be indicative of graphite passivation. Figure 6 shows in-situ cell volume vs time in NMC811/Graphite cells with 2VC1DTD electrolyte during cycling at C/3 and 40 °C with periodic holds at top of charge (4.20 V). To evaluate the passivation of each graphite, the cell volume after formation was subtracted from the volume during cycling so that irreversible changes to cell volume can be largely attributed to gases produced after SEI formation. AGB, AGC, NGB all showed very minimal increase in cell volume and gas generation after formation (<0.2 ml), while AGA, NGA, and NGC showed more gas production after the C/20 formation cycle. The NMC811/NGC cell produced ∼0.5 ml of gas after only 225 h of cycle-hold testing at 40 °C, which is in stark contrast to AGB or AGC which had <0.1 ml of gas, demonstrating that the NGC electrode was not sufficiently passivated during formation with the electrolyte chosen here. It is not clear whether changes to the electrolyte or to the amounts and types of additives could passivate NGC completely and a significant number of future experiments would be required to determine this. The results in Fig. 6 and the values in Table I demonstrate that BET surface area is not a reliable measure of the surface area that the electrolyte can access, since NGC had a similar BET area to NGA and NGB but these natural graphites showed varying degrees of gas production (0.1–0.6 ml) with the same electrolyte. To understand the differences in SEI passivation for each graphite, it is important to identify the gases produced during formation.

Figure 6. Voltage (V, black) and volume change during cycling (ml, orange) vs time for NMC811/Graphite pouch cells. Cells were cycled at C/20 (first cycle) and C/3 (subsequent cycles) between 3.0–4.2 V at 40 °C with a 12 h CV hold at top of charge. The gas generation during the C/20 formation cycle was subtracted from subsequent C/3 cycles to probe the efficacy of graphite passivation against further electrolyte reduction.
Download figure:
Standard image High-resolution imageFigure 7 shows the change in cell volume with respect to voltage (dVol./dV) and dQ/dV vs voltage for NMC811/Graphite cells with 2VC1DTD that underwent a C/100 formation cycle between 3.0–4.20 V at 40 °C with in-situ volume monitoring. Peaks in the dQ/dV vs V plot at 2.5 and 2.9 V correspond to VC and EC reduction, respectively, both of which generate gaseous by-products upon reduction. 33,34 Therefore, dQ/dV peaks associated with gas production events should correlate to peaks in dVol./dV where changes in cell volume are measured. Indeed, Fig. 7 shows a correlation between electrolyte reduction events and gas generation for all NMC811/Graphite cells. Here, the differences in electrolyte reduction across the different graphites became very clear. For example, AGC showed very minimal reduction activity and no EC reduction peak, suggesting that it has very small accessible surface area that is fully passivated by VC reduction during SEI formation. On the other hand, AGB with a similar BET area showed substantially more electrolyte reduction activity and a prominent EC reduction peak at 2.9 V. Similarly, Fig. S2 shows the correlation between volume change and electrolyte reduction for 2FEC1LFO electrolyte. The gas generation in the 2FEC1LFO case was very small overall, and similar trends can be seen compared to Fig. 7. By knowing precisely at what voltage can we expect gas generation during formation, we can sample the gaseous species formed at different voltages to learn about the extent of passivation brought forth by a certain additive loading for different graphite materials. This approach showed that the first onset of gas generation in 2VC1DTD and 2FEC1LFO electrolytes are ∼2.6 and 2.75 V, respectively.

Figure 7. Change on volume with respect to voltage (dVol./dV, ml V−1, black) and dQ/dV (orange) for NMC811/Graphite pouch cells. Cells were filled with 2VC1DTD electrolyte and cycled between 3.0–4.2 V at C/100 and 40 °C. A 7-point running average of dVol./dV is plotted to reduce the noise in the data.
Download figure:
Standard image High-resolution imageFigure 8 Shows the gas chromatograms for gas samples taken from NMC811/Graphite pouch cells equipped with a gas sampling port as described by Schmiegel et al. 25 Cells with 2VC1DTD or 2FEC1LFO were charged at C/100 to 2.6 or 2.75 V at 40 °C, respectively, so that the gas in the cell only corresponds to the first onset of gas generation shown in Figs. 7 and S2. For all cells in Fig. 8 CO2 and C2H4 gases were the dominant gases detected, along with Ar since the cells were filled with electrolyte in an Ar glovebox. [Hydrogen is expected to be produced during formation, but we could not detect it with the mass spectrometer detector used.] Zhang et al. showed that cells with VC generate more CO2 (similarly with FEC) which is attributed to VC reduction, while reduction of EC produces C2H4. 34 Therefore, a SEI formed in the presence of VC will lead to more CO2 in the cell compared to a SEI that is not properly passivating the graphite and further reducing EC to produce C2H4. The ratio of C2H4/CO2 in the cell after formation can thus be used as a marker for graphite passivation in the presence of VC or FEC (both of which produce CO2 upon reduction), with lower C2H4 content corresponding to a decrease in EC reduction. To investigate the relationship between gas composition and first cycle efficiency (FCE), the ratio of C2H4/CO2 was extracted from the peak area in the gas chromatograms in Fig. 8 and correlated to FCE.
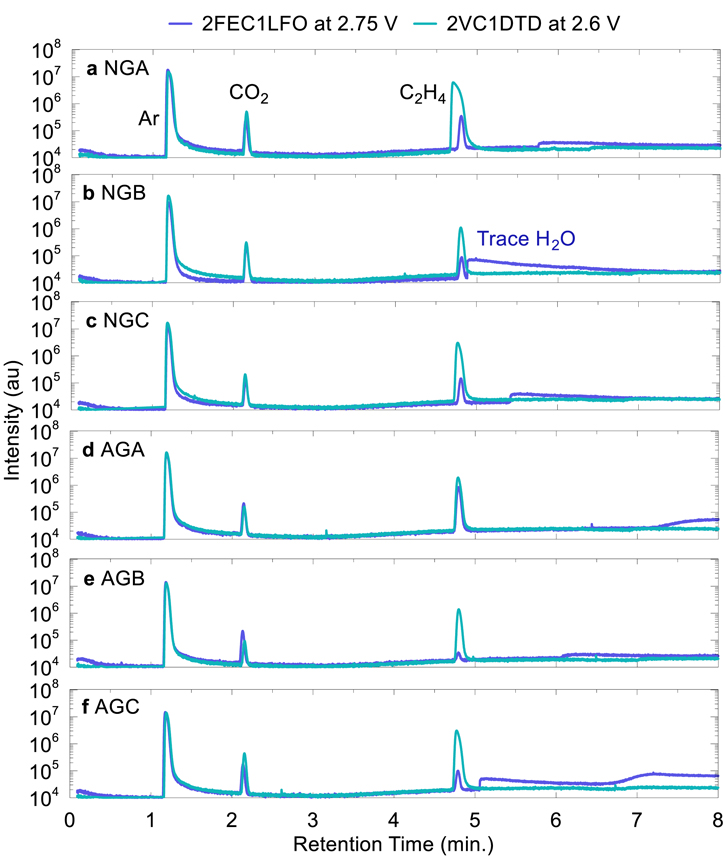
Figure 8. Gas chromatograms for 2FEC1LFO and 2VC1DTD cells with a gas sampling port. Cells were charged to 2.75 or 2.6 V during the formation cycle for 2VC1DTD and 2FEC1LFO, respectively, and the generated gas was extracted from the pouch cells. Cells were charged at C/100 and 40 °C.
Download figure:
Standard image High-resolution imageFigure 9 shows the C2H4/CO2 ratio plotted vs FCE for NMC811/Graphite cells with 2VC1DTD and 2FEC1LFO formed to either 4.06 or 4.20 V UCV at 40 °C. It is clear in Fig. 9 that higher C2H4 content is related to lower FCE from poor SEI passivation. Graphites that are passivated by 2FEC1LFO or 2VC1DTD additive blends, such as AGC, AGB, and NGB, have the highest FCE which highlights the robustness of their SEI and is consistent with the decreased electrolyte reduction shown in Figs. 7 and S2. The C2H4/CO2 ratio for 2VC1DTD cells is higher than 2FEC1LFO case since the reduction of DTD produces C2H4 and CO2, but the ethylene content in the 2VC1DTD case will increase with EC reduction since DTD produces a 1:1 ratio of C2H4 to CO2. 33

Figure 9. C2H4/CO2 peak area ratio vs FCE for NMC811/graphite cells formed at C/20 and 40 °C for cells with (a), (b) 2VC1DTD and (c), (d) 2FEC1LFO formed between 3.0 and 4.06 (a), (c) or 4.20 V (b), (d).
Download figure:
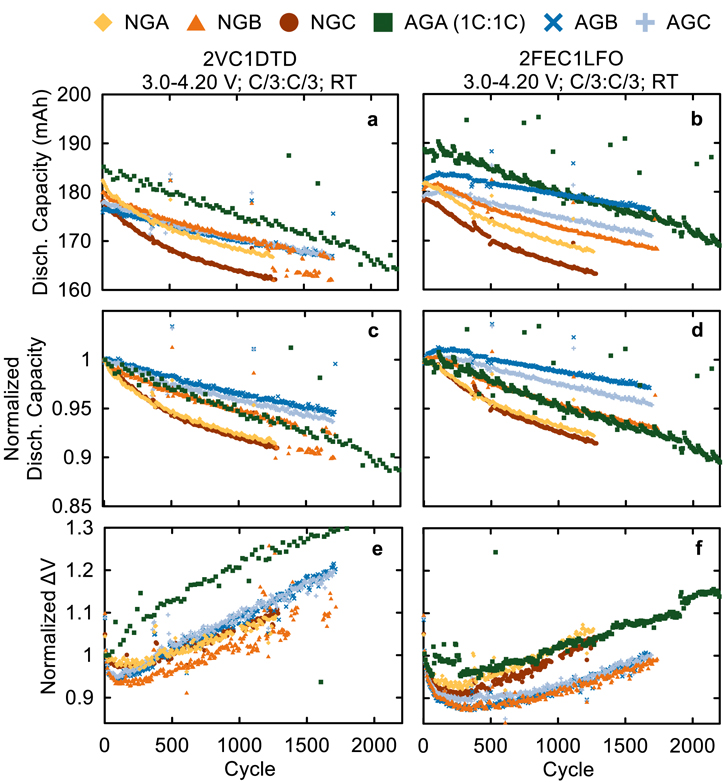
Standard image High-resolution imageHaving established some of the electrochemical and physical differences between the graphite materials in this work, we proceeded to examine their long-term cycling performance to see which material is most compatible with NMC811 cells. Figure 10 shows the discharge capacity (mAh), normalized discharge capacity, and normalized ΔV for NMC811/Graphite pouch cells with 2VC1DTD and 2FEC1LFO cycled at room temperature (22 °C ± 2 °C). Here, ΔV is the difference between the average charge voltage and the average discharge voltage of the cells. Increases in ΔV during cycling indicate an increase in cell internal resistance. The cells in Fig. 10 were cycled to an UCV of 4.06 V at C/3:C/3 charge:discharge rates with a C/20 "checkup cycle" every 100 cycle to check the low-rate capacity retention. The data for AGA cells were collected at 1C:1C and have been previously reported by Song et al. and are included here as a comparator since AGA (Kaijin AML400) is the baseline graphite material used by our group. 1,20 The cells in Fig. 10 are all showing excellent RT performance which is expected for cells with state-of-the-art materials and excellent additive blends, however, some differences can still be seen between the different graphite materials. NGA and NGC graphites are showing the worst capacity retention with 2VC1DTD and 2FEC1LFO compared to NGB, AGB, and AGC—these three had comparable excellent performance at 4.06 V and RT. Unfortunately, these cells were tested at ambient RT with no temperature control, so noisy data due to temperature fluctuations introduces uncertainties (such as an apparently increasing capacity for AGC with 2FEC1LFO). We will examine long-term cycling at elevated temperature in temperature-controlled boxes in part II of this work to clearly distinguish any differences between the materials.
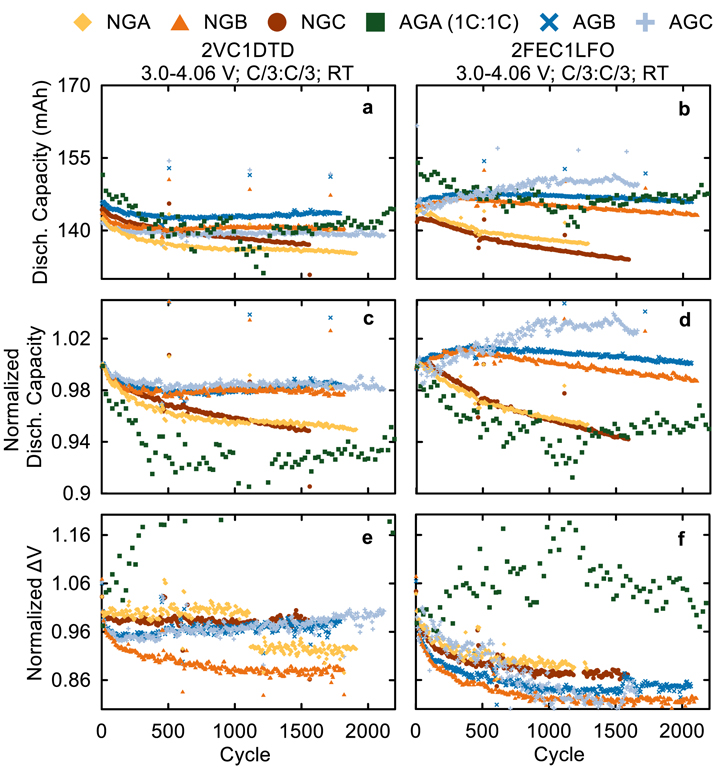
Figure 10. (a)–(b) discharge capacity (mAh), (c)–(d) normalized discharge capacity, and (e)–(f) normalized ΔV vs cycle number for NMC811/graphite cells with 2VC1DTD (left) and 2FEC1LFO (right) electrolytes. Cycling was done at RT with C/3 CCCV charge and C/3 CC discharge between 3.0–4.06-V, and a C/20 checkup cycle every 100 cycles.
Download figure:
Standard image High-resolution imageNi-rich materials such as NMC811 are known for their poor performance at high voltages where large lattice volume change takes place. 35 Therefore, we cycled NMC811/Graphite cells at 4.20 V as well to compare their performance to the 4.06 V counterparts where no dramatic lattice volume change is occurring. Figure 11 shows the discharge capacity (mAh), normalized discharge capacity, and normalized ΔV for NMC811/Graphite pouch cells with 2VC1DTD and 2FEC1LFO cycled at room temperature (22 ± 2 °C). The cells in Fig. 11 were cycled to an UCV of 4.20 V at C/3:C/3 charge:discharge rates with a C/20 "checkup cycle" every 100 cycles to check the low-rate capacity retention, while the 1C:1C AGA data was obtained from Song et al. for comparison. 20 Similar to Fig. 10, the RT performance of these cells at 4.20 V UCV was fairly competitive, with <10% capacity loss after ∼1800 cycles for the worst cells (NGA and NGC). Here, we can clearly see the improvement in capacity retention brought forth by AGB and AGC when compared to AGA or NGB. Additionally, the 4.20 V UCV cells showed ΔV increases between 10 and 20% after ∼1800 cycles, compared to the negligible increase in ΔV at 4.06 V (Figs. 10e–10f). For the NMC811/graphite cells with the 2FEC1LFO additive blend in Fig. 11, NGB, AGB, AGC had the smallest ΔV increase compared to NGA and NGC. In Fig. 10–11, the difference in cycle performance between 2VC1DTD and 2FEC1LFO is fairly small, but the impact of graphite choice is clear, with AGB and AGC yielding the best performing cells. In part II of this work, we will study long-term cycling at elevated temperature where parasitic reactions are accelerated and differences between the graphite materials will be more significant.
Figure 11. (a)–(b) Discharge capacity (mAh), (c)–(d) normalized discharge capacity, and (e)–(f) normalized ΔV vs cycle number for NMC811/graphite cells with 2VC1DTD (left) and 2FEC1LFO (right) electrolyte cells. Cycling was done at room temperature with C/3 CCCV charge and C/3 CC discharge between 3.0–4.20 V, and a C/20 checkup cycle every 100 cycles.
Download figure:
Standard image High-resolution image
Conclusions
In part I of this work, we studied the physical and electrochemical differences between five graphite materials from prominent suppliers in the Li-ion industry in order to improve the performance of NMC811 cells. We showed that all NG materials in this work had a significant 3R phase, while AGs were primarily 2H phase only. Additionally, we suggest based on XRD data that NGs in this work had a surface coating accounting for ∼5% by weight while the AG materials did not seem to have any carbon-based surface coatings applied temperatures below 1200 °C. Coin cell and pouch cell data demonstrated the AGC and NGB had very low electrolyte reduction activity in dQ/dV, and we highlighted the discrepancy between N2 BET area and the electrochemically accessible surface area that the electrolyte can access, which influences FCE, gas evolution during formation and long-term performance. We studied the graphite passivation in NMC811/Graphite pouch cells using in situ gas measurements, where NGC materials showed the worst passivation as evident from the gas generation during cycling at 40 °C after SEI formation. We then used In-situ gas measurements to identify at what voltage the gases are generated during formation, which correlated to electrolyte reduction peaks in dQ/dV and allowed us to determine the composition of the formation gas using GCMS. Furthermore, we showed that cells with good passivation and high FCE have low C2H4/CO2 ratio during formation, which is consistent with reduced consumption of EC in the presence excellent graphite passivation by VC or FEC. Finally, we examined the long-term cycling of NMC811/Graphite cells at RT with an UCV of 4.06 and 4.20 V with 2VC1DTD and 2FEC1LFO additive blends. Here, NGB, AGB, and AGC materials showed superior capacity retention, consistent with their high FCE and low C2H4/CO2 ratio during formation, compared to NGA and NGC. Part II of this work will focus on long-term cycling at elevated temperatures, ultra-high precision coulometry (UHPC) experiments, isothermal microcalorimetry (TAM) tests to study parasitic heat flow, in situ stack pressure growth, and lifetime projections for NMC811/AGC cells with the improved graphite material shown here.
Acknowledgments
This work was funded under the auspices of NSERC/Tesla Canada Industry Research Chair program. A. E. acknowledges scholarship support from Vanier CGS program, Killam Foundation, and the Nova Scotia Graduate scholarship program. E. Z. acknowledges scholarship support from the Killam Foundation and the Nova Scotia Graduate scholarship program.