
Abstract
In the current research, we developed and printed by fused-filament fabrication polylactide-polyethylene-oxide blended membranes. The influence of relative content of polymers on the ease of extrusion and printing processes was studied. Ionic liquid N-butyl-N-methylpyrrolidinium bis(trifluoromethane-sulfonyl)imide (Pyr14TFSI) with dissolved LiTFSI salt was infused into the membranes to produce free-standing films of quasi-solid polymer electrolytes. The printed membranes were characterized by ESEM, DSC, XPS, NMR and EIS methods. Neat-printed PLA (polylactide) membrane exhibited poor wetting and low uptake of ionic liquid. However, the XPS tests of 3D-printed PLA-PEO membrane infused with LiTFSI solvated ionic liquid show evidence of the interaction between lithium cations with both, PEO (polyethylene oxide) and PLA. The measurements of diffusion coefficients by PGSE-NMR suggest that the Li+ ions are coordinated by the PEO segments in the polymer blend. Increase of the PEO content at the expense of PLA polymer, leads to more than one order of magnitude improvement of bulk conductivity, approaching 0.2 mS cm−1 at 60 
Export citation and abstract BibTeX RIS

This is an open access article distributed under the terms of the Creative Commons Attribution 4.0 License (CC BY, http://creativecommons.org/licenses/by/4.0/), which permits unrestricted reuse of the work in any medium, provided the original work is properly cited.
Since the beginning of the new millennium, we have witnessed an accelerated growth and development of portable electronic devices (PEDs), e.g. cellular phones, laptops and wearable sensors. These devices rely on high-energy and long-life high-power sources, which are provided by lithium-ion batteries (LIBs). To meet the requirements of continually decreasing sizes and shape diversity of PEDs, considerable attention should be paid to battery-form factors and deformability. In the meantime, conventional batteries are fabricated by winding or stacking electrodes and separators, packaging these components into cylindrical- or rectangular-shaped metallic containers or pouch envelopes, followed by the injection of liquid electrolyte. 1 Conventional battery materials, the processes of electrodes fabrication, as well as current technology of assembly of all battery constituents, limit the mechanical flexibility of batteries, thus hampering their integration into complex-shaped electronic devices.
It is possible to fabricate free-form-factor energy-storage devices by employing 3D printing, which offers an ideal way to achieve a desirable cell architecture. In recent years, 3D printing has received increasing attention owing to its implementability in various applications. Inkjet printing, the more traditional technique, utilizes a droplet of viscosity ink on paper, plastic, or other substrates. Sun, K. et al., developed a high-resolution 3D-printing technology based on the pneumatic direct writing of high-aspect-ratio micro-arrays of anode (LTO) and cathode (LFP) that are interdigitated on a submillimeter scale. 2 More recently, this research group described a fully 3D-printed LIB, which includes a separator ink composed of ceramic-filled polymer composites that can be UV-cured upon direct ink writing. 3 Liangbing Hu's group developed graphene-oxide (GO)-based composite inks and solid-state electrolyte inks to fabricate all component 3D-printed LIBs, with a specific capacity of 160 mAh g−1 which was obtained at low charge/discharge rate. 4,5 Despite the recent advances in the development of unconventional form-factor batteries, most prototype-fabrication methods are limited to curved or flat surfaces. The next-generation electrochemical- energy storage devices constitute a novel class of free-form-fabrication technologies, which utilize the fused-filament-fabrication (FFF) technique. This technique, which employs thermoplastic polymers, has been utilized over the past 30 years for rapid-prototyping and mold-casting applications. The FFF method bears a variety of possibilities for rapid creation of complex free-standing architectures at lower cost than conventional methods. It will also facilitate the free-form production of electrodes and other components of customized design, shape, porosity and chemical composition. One of the first steps toward achieving FFF 3D-printed batteries has been taken by Foster et al., 6 who developed a 3D graphene-based polylactic acid (PLA) filament comprising only 8% graphene and 92% PLA. The authors tested the printed anodes with a lithium-metal counter electrode in a coin-cell setup and achieved a volumetric capacity in the range of 1.36−35.8 mAh.cm−3,6 . C. Reyes et al. 7 presented a complete 3D Li-ion battery printed by the FFF technique, with all battery components based on PLA. Anode- and cathode-active materials were chosen to be Li4Ti5O12 (LTO) and LiMn2O4 (LMO) respectively. However, because of the low ionic conductivity of PLA, the separator, which was 100% PLA, swelled in the carbonate solvent and commercial electrolyte. The ionic conductivity of the PLA separator was said to increase by a factor of four compared to pristine PLA. 7 In our previous work, we described a 3D-microbattery fabricated by employing FFF. 8 The reversible electrochemical cycling of 3D-printed lithium-iron-phosphate and lithium titanate composite polymer electrodes has been demonstrated in cells containing conventional non-aqueous LiPF6 EC:DEC and ionic-liquid (IL) (LiTFSI Pyr14TFSI) electrolytes; Celgard 2035 was used as a separator.
As mentioned above, one of the critical limitations in creating 3D-printable LIBs is manifested by the fact that the polymers typically used for FFF 3D printing (such as PLA), possess poor ion-conducting properties. In order to overcome this obstacle, polyethylene oxide (PEO), a well-established ion-conducting polymer host is introduced to the printed membranes. Printing of PLA-PEO-LiTFSI salt solid electrolyte has been recently reported by our group.
9
The material exhibited poor mechanical properties, caused by its highly amorphous structure and thus it was unprintable. However, the addition of a small amount of ceramic nanoparticles to the polymer blend facilitated printing ability as a result of the reinforcing effect of ceramic filler, reported previously.
10
The flexible all-solid LiTFSI-based electrolyte exhibited bulk ionic conductivity of 3.1 × 10⁻⁵ S.cm−1 at 90  With the use of TOFSIMS analysis it was shown that both PLA/Li and PEO/Li complexes are formed. Evidence of the interaction between carbonyl groups of PLA and Li+ was presented in the work of Osada et al. who conducted FTIR measurements on PLA-LiTFSI mixtures.
11
Recently Armand's group reported FFF printing of PEO-LiTFSI electrolyte.
12
Substantial modifications to the 3D-printer were implemented in order to facilitate printability of this poor-mechanical-properties electrolyte. The printed electrolyte exhibited ionic conductivity of 2.2 × 10⁻³ S.cm−1 at 90
With the use of TOFSIMS analysis it was shown that both PLA/Li and PEO/Li complexes are formed. Evidence of the interaction between carbonyl groups of PLA and Li+ was presented in the work of Osada et al. who conducted FTIR measurements on PLA-LiTFSI mixtures.
11
Recently Armand's group reported FFF printing of PEO-LiTFSI electrolyte.
12
Substantial modifications to the 3D-printer were implemented in order to facilitate printability of this poor-mechanical-properties electrolyte. The printed electrolyte exhibited ionic conductivity of 2.2 × 10⁻³ S.cm−1 at 90 
A known method to enhance the ionic conductivity of polymer electrolyte is by introduction of plasticizers. Previous publications have reported enhancement of ionic conductivity up to values of about 10−3 S.cm−1 at ambient temperature, which is the accepted threshold for different applications.
13–16
Promising materials for this purpose are ionic liquids, which are molten organic salts at room temperature. They are also characterized by low vapor pressure and reduced flammability, while maintaining high thermal and electrochemical stability compared to hazardous organic solvents. Another important attribute is their high ionic conductivity compared to solid polymer electrolytes. Addition of plasticizer to semi-crystalline polymers such as PLA-PEO is expected to reduce crystallinity as a result of increased segmental motion of the polymer chains and thus hinder the mechanical properties of the composite. Osada et al.
11
reported the fabrication by hot-pressing of IL containing polymer electrolyte with composition of PLA-LiTFSI-Pyr14TFSI. Though significantly lower ionic conduction values were received for the PLA-based electrolyte (2.1 × 10⁻⁴ S.cm−1 at 60  ) compared to a PEO-based one (1.5 × 10⁻³ S.cm−1 at 60
  ), a lithium-metal polymer battery with a composite LFP cathode was successfully cycled with this electrolyte.
The major goal of our current research, presented in this manuscript was the development and characterization of plasticized 3D-printed polymer electrolytes, based on PLA/PEO blends. Here we address the FFF preparation of PLA-PEO membranes, study the effect of relative content of polymers, molecular weight of PEO, and LiTFSI: Pyr14TFSI on their morphology, thermal and electrochemical properties. The novelty of the research lies in the following: we study for the first time the complex interplay between the LiTFSI-Pyr14 and printed by-fused-filament-fabrication membrane composed of the blend of two polymers- PLA and PEO. We elucidate the interactions between Li+ cation and each polymer, which influence phase transitions, conductivity and self-diffusion coefficients. We show that the approach of plasticization of printed electrolyte is advantageous for better cycleability of printed batteries.
Experimental
Four polymer samples containing PLA:PEO(MW 5 × 10⁶):PEO(MW 2 × 10³) were fabricated at the following concentrations: 25:40:35, 40:30:30, 40:40:20, 0:50:50% (w/w), respectively. A commercial PLA filament was used for comparison. PLA pellets (PLA L-175 Purac® Corbion) were dissolved in 1,3-dioxolane (Sigma-Aldrich) with stirring for 12 h at room temperature. The PEO powders of high molecular weight (hPEO 5 × 10⁶) and low molecular weight (lPEO MW 2 × 10³) (Sigma-Aldrich) were dissolved in acetonitrile with stirring for 24 h. Both solutions (PLA & PEO) were mixed with stirring for 12 h according to the desired composition mentioned above. After complete dissolution, the mixture was poured on a Teflon plate and dried for 12 h at room temperature. After drying, each cast was crushed to small pellets to be used for the fabrication of filaments. Each composite was extruded with a Felfil Evo Filament Extruder (Italy) to form a filament suitable for use as feedstock in a fused-deposition 3D printer. With appropriate choice of the nozzle diameter (in the range of 1.4–1.7 mm) and careful control of the nozzle temperature (typically in the range 175 °C–190  ) and the extrusion speed, filaments were produced with a circular cross section of average diameter 1.75 mm and a typical standard deviation of 0.02–0.03 mm. Each filament was printed with the use of the Up-Plus2 printer (Tiertime). Printed disc-shape samples with a diameter of 18 mm and a thickness of 200 μm were used as the separators/membranes. The printed samples were dried under vacuum at 100
  for 12 h in order to remove residual solvent and moisture. Calculation of %porosity and top-side surface area was made for pure PLA and PLA-PEO printed separators. This was done according to the separators' measured weight and calculated volume, considering the surface profile viewed in ESEM images. The length of protruded spiral was calculated according to:
N is the number of turns given by:

where D0 and D1 are the inner and outer diameters respectively, of the printed circle, h is the thickness of the spiral.
For the conductivity tests, the cells, comprising 3D-printed polymer membranes sandwiched between two non-blocking lithium electrodes were assembled in 2032 coin-cell setup. The 3D printed separators were vacuum-impregnated with 0.3 M (or 1 M) LiTFSI–Pyr14TFSI as IL electrolyte (20 μl) for five minutes prior to cell construction. The electrolyte was completely absorbed by the membranes, forming free-standing plasticized quasi-solid films. All handling of these materials took place under an argon atmosphere in a MBraun glove box containing less than 1 ppm water and oxygen.
Electrochemical-impedance spectroscopy (EIS) tests were carried out at 30 °C to 100 °C with a VMP3 potentiostat (Biologic Instrument) at a setting of 100 mV amplitude and a frequency range of 1 MHz to 0.01 Hz.
The differential-scanning-calorimetry (DSC) tests were carried out with a TA Instruments Research-Grade DSC with Modulation and Tzero cell module Q2000 MDSC. The samples, weighing 5 to 15 mg, were hermetically sealed in Alodine-Al pans in the glovebox and their spectra were recorded at a scan rate of 10  min−1 from −80
  up to 200
Surface morphology was evaluated with a Quanta 200 FEG Environmental Scanning Electron Microscope (ESEM). The samples were sputtered with a thin gold film (6–10 nm) prior to the scanning.
X-ray Photoelectron Spectroscopy (XPS) measurements were performed in UHV (2.5 × 10⁻¹⁰ Torr base pressure) with the use of a 5600 Multi-Technique System (PHI, USA). The sample was irradiated with an Al Kα monochromatic source (1486.6 eV) and the emitted electrons were analyzed by a Spherical Capacitor Analyzer with a slit aperture of 0.8 mm. The sample was analyzed at the surface only. C1s at 285.0 eV was taken as an energy reference for all the peaks.
NMR diffusion experiments on filaments were performed with a 300 MHz Varian spectrometer under a magnetic field of 7.05 T with a DOTY Z-gradient diffusion probe. The pulsed field gradient (PFG) NMR stimulated echo sequence was used to measure the self-diffusion coefficients of 7Li, 1H, and 19F nuclei, corresponding to cations, Li+, PYR14
+ and TFSI− ions, at variable temperatures, covering the 25°–85  range. Gradient strength, g, was arrayed (32 values, linear increase, g = 0–1380 G cm−1) for each experiment. Gradient-pulse duration was δ = 1–4 ms and diffusion delay was Δ = 40–300 ms. The self-diffusion coefficients, D, were then extracted by fitting the echo signal decay with the Stejskal–Tanner equation;

where I is the amplitude of the attenuated echo signal, I0 is the initial amplitude of the NMR signal, Δ and  are delays and D is the diffusion constant,
  is the gyromagnetic ratio and g is the gradient strength.
Results and Discussion
Bearing in mind that lithium-ion transport in polymer electrolytes is closely connected to the flexibility and relaxation of polymer chains, we blended PLA with high- and low-molecular-weight PEO. All four compositions of the PLA:hPEO:lPEO samples were successfully extruded at 160  Reducing the PLA content in the membrane resulted in a much more flexible filament than that of neat PLA, but printing of those filaments was more challenging. As can be seen in the ESEM micrographs (Fig. 1a), closely packed spherulites can be easily distinguished in a printed neat PLA sample. Blending of PLA with PEO destroys spherulitic morphology; instead, a needle-like structure with some flat surface inclusions, is formed (Fig. 1c). We attribute the appearance of these irregularities to the PEO-rich entities distributed in a continuous, PLA matrix plasticized by PEO in agreement with.
17
Previous work of Wittman and Manley
18
showed the needle-like morphology in the blend of a polyester and a crystallizable monomer (trioxane) at a hypoeutectic composition. Since there is no phase diagram for PLA-hPEO-lPEO films, known to us, we cannot for certain attribute this morphology to the formation of eutectic structure, but neither can we ignore this possibility. It is worth mentioning that the films do not exhibit phase separation. Zooming into the cross-section image of 100% PLA (Fig. 1b) reveals a smooth morphology with little plastic deformation. The PLA-hPEO-lPEO membrane (Fig. 1c) appears to be more ductile, as seen by the apparently more significant plastic deformation.
Reducing the PLA content in the membrane resulted in a much more flexible filament than that of neat PLA, but printing of those filaments was more challenging. As can be seen in the ESEM micrographs (Fig. 1a), closely packed spherulites can be easily distinguished in a printed neat PLA sample. Blending of PLA with PEO destroys spherulitic morphology; instead, a needle-like structure with some flat surface inclusions, is formed (Fig. 1c). We attribute the appearance of these irregularities to the PEO-rich entities distributed in a continuous, PLA matrix plasticized by PEO in agreement with.
17
Previous work of Wittman and Manley
18
showed the needle-like morphology in the blend of a polyester and a crystallizable monomer (trioxane) at a hypoeutectic composition. Since there is no phase diagram for PLA-hPEO-lPEO films, known to us, we cannot for certain attribute this morphology to the formation of eutectic structure, but neither can we ignore this possibility. It is worth mentioning that the films do not exhibit phase separation. Zooming into the cross-section image of 100% PLA (Fig. 1b) reveals a smooth morphology with little plastic deformation. The PLA-hPEO-lPEO membrane (Fig. 1c) appears to be more ductile, as seen by the apparently more significant plastic deformation.
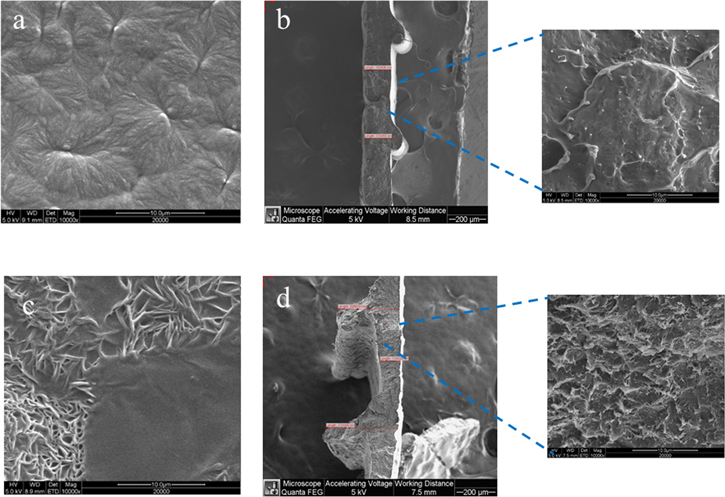
Figure 1. ESEM images of printed samples: Neat PLA (a), (b), PLA25:hPEO40:lPEO35 blend (c), (d) (b) and (d)—cross-sectional view).
Download figure:
Standard image High-resolution imageCalculated porosity of the printed neat PLA and blended polymer membranes was very low, not exceeding 4% for all the compositions, indicating that the membranes are dense and contain little or no pores. On the other hand, the surface roughness differs significantly with PLA-hPEO-lPEO being more coarse, thus having more intimate polymer-IL contact area, which enhances the wettability and facilitates good absorption of IL 0.3 M LiTFSI Pyr14TFSI electrolyte. Miscibility of polymer with IL also influences the absorption. According to Ref.,14 the PLA is not miscible with Pyr14TFSI, which means that these compounds do not interact well with each other. Tsurumaki et al. 18 investigated the miscibility of 12 different ionic liquids with PEO and found that Pyr14TFSI has moderate miscibility with PEO. This could also account for the enhanced absorption ability of the membranes containing PEO, expressed in improved uptake. The uptake of IL electrolyte (Pyr14TFSI with 0.3 M LiTFSI) by printed membranes was tested by dripping 20 μl IL on each separator and monitoring the change in mechanical properties and liquid absorption for six days. The as-printed membranes that contained PEO absorbed the IL very well, while the absorption by the 100% PLA sample was poor. The separators that had absorbed the liquid became flexible.
The effect of IL impregnation on the thermal properties of membranes of different composition was measured by DSC. The DSC tests were conducted at a heating/cooling ramp of 10 deg min−1. The results of the DSC tests shown in Fig. 2a and Table I are of the filaments. The DSC thermograms of neat high- and low-molecular-weight PEO and of neat PLA are displayed for comparison. The onset point of the lPEO endotherm is at 56.6  and that of hPEO at 73.2
  This higher melting temperature is caused by a longer macromolecule. Melting of PLA occurs at 180.7
  The endothermic peak of hPEO:lPEO filament appears between the endotherms of neat polymers. Unexpectedly, small endothermic transition is detected in the DSC trace of this filament at 170
  which may indicate that a small amount of PLA remained inside the extruder. The higher the PLA content of the filament, the smaller the melting enthalpy of the low-temperature endotherm. The opposite behavior is observed for the high-temperature melting peak. Since there are no additional endothermic transitions in the filaments, as compared to neat polymers, it can be deduced that the original materials constituting polymer-blend samples have kept their properties, implying that no new inter-polymeric phases were created upon extrusion.
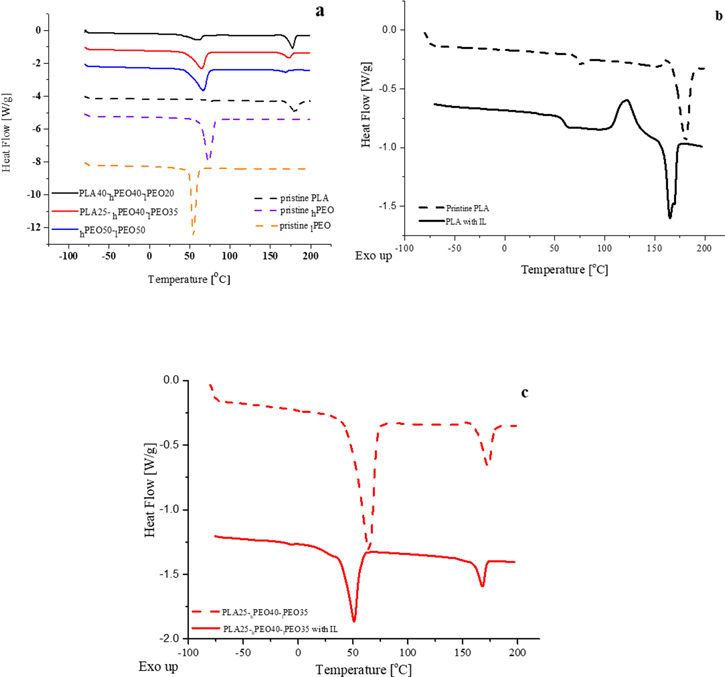
Figure 2. DSC thermograms for filaments of various compositions compared to neat polymers (a); 3D printed pristine PLA (b); PLA25:hPEO40:lPEO35 (c) (%wt) with and w/o IL.
Download figure:
Standard image High-resolution imageTable I. DSC data of polymers and plasticized electrolytes.
| Tg °C | Tcc °C | ΔHcc J g−1 | Tm °C | ΔHm J g−1 | FWHM °C | Height W g−1 | Crystallinity % | |
|---|---|---|---|---|---|---|---|---|
| PEO 5*106 powder | −12.6 | — | — | 73.2 | 160.9 | 9.4 | 2.6 | 82.1 |
| PEO 2*103 flakes | −13.0 | — | — | 56.6 | 173.3 | 6.2 | 4.0 | 88.4 |
| PLA pellets | 67.9 | 162.6 | 2.5 | 180.8 | 39.6 | 8.5 | 0.6 | 39.7 |
| PLA40-hPEO40-lPEO20 filament | — | — | — | 58.6 | 27.5 | 12.8 | 0.3 | 23.4 |
| 177.2 | 35.6 | 7.2 | 0.8 | 95.1 | ||||
| PLA25-hPEO40- lPEO35 filament | −0.1 | — | — | 64.5 | 87.1 | 13.1 | 1.0 | 59.3 |
| 155.4 | 0.9 | 172.3 | 19.6 | 9.3 | 0.3 | 79.9 | ||
| PLA25-hPEO40-lPEO35 print +20ul IL | −8.5 | — | — | 51.1 | 34.0 | 9.7 | 0.5 | 23.1 |
| — | — | 168.1 | 7.5 | 5.8 | 0.2 | 32.1 | ||
| hPEO50-lPEO50 filament | −3.8 | — | — | 66.6 | 118.5 | 14.4 | 1.2 | 60.5 |
| hPEO50-lPEO50 print + 20ul IL | −17.0 | — | — | 55.3 | 53.5 | 7.4 | 0.9 | 27.3 |
| PLA (100) print + 20ul IL | 57.5 | 122.5 | 24.7 | 165.1 | 36.4 | 9.1 | 0.6 | 12.5 |
The percentage of crystallinity of each polymer was calculated from the equation:
Where ΔHm is the value of the melting enthalpy, ΔHcc is the cold-crystallization enthalpy, ΔH100 is the enthalpy of the completely crystalline polymer and w is the weight fraction of polymer in the sample. The values of ΔH100 for PLA and PEO are 93.6 19 and 196.0 20 J g−1, respectively. The results obtained for the melting temperature (Tm), the enthalpy of melting (ΔHm) and the degree of crystallinity (Xc) of each polymer, as well as the peak temperature (Tcc) and enthalpy (ΔHcc) of cold crystallization of PLA are reported in Table I. The samples of filaments and printed membrane of the same composition (without IL) were tested and found to have similar DSC behavior. PLA domains in the blend filaments (PLA40-hPEO40-lPEO20 and PLA25-hPEO40-lPEO35) exhibit a higher crystallinity percentile (95.1 and 79.9% respectively) as compared to pristine PLA pellets (39.7%). Such behavior is described in the work of Y. Hu et al. 21 who studied the morphology of solidified PLA-PEG blends. It was found that blending with polyethylene glycol (MW 8,000) and slow cooling of the blend, accelerated crystallization of PLA in the form of large spherulites. Glass-transition temperatures (Tg) also differ between the different samples, from 67.9 °C of the PLA pellets to close to zero in the blended filament.
On the other hand, the crystallinity of the PEO phase is lower (23.4%) in the filament of high PLA content (40% wt). We relate this to the spatial disturbance and disorder induced by PLA, which gives rise to the creation of amorphous PEO regions.
Adding IL to the printed samples has a significant plasticizing effect on their thermal properties. As can be seen from the DSC traces in Fig. 2b, the addition of IL to pristine PLA causes a shift of the glass-transition and melting temperatures towards lower values by 10.4  and 15.6
  respectively. The enthalpy of the endotherm decreases from 39.6 to 36.4 J g−1, the full width at half maximum (FWHM) increases from 8.5 °C to 9.1
  and the height of the peak remains the same with a value of 0.6 W g−1. The degree of crystallinity is lower by 27.2% as a result of the pronounced cold-crystallization process occurring before the melt. The enthalpy of the cold-crystallization exotherm increases upon addition of IL by almost one order of magnitude, from 2.5 to 24.7 J g−1. Wetting by IL of printed polymer-blend membranes is followed by similar phase-transition trends (Table I). With the PLA40-PEO blend a shift of Tg by 8.4
  was detected as compared to the IL-free membrane. The melting temperature of the PEO phase was decreased by 13.4
  and its crystallinity was lower by 36.1%. The melting temperature of the PLA phase decreased by 4.2 °C and its crystallinity dropped by 47.9%.
The plasticizing effect of IL, which is reflected in the decrease of Tg and the widths and heights of the endothermic transitions of all the membranes, is likely to promote more homogeneous orientation of polymer chains in the crystalline regions of the separators upon printing. The lowering of the glass-transition temperature is interpreted as an increase in the polymer segmental motion, which is an important factor influencing the ionic conductivity of the polymer electrolytes. Such plasticizing effect of IL was previously reported by Osada et al. 11 who incorporated Pyr14TFSI-LiTFSI IL into a PLA matrix to obtain solid polymer electrolyte. It was demonstrated that the addition of IL causes a significant decrease in the glass-transition temperature. The plasticizing effect of IL was also demonstrated in the work of Desai et al. 22 who incorporated P14TFSI (n-butyl-3-methylpyridinium trifluoromethanesulphonylimide) into PEO matrix to produce gel-polymer electrolytes (GPE).
To determine if there is a difference between the chemical environment at the surface of the plasticized PLA-PEO membrane and that in its bulk we carried out depth-profile XPS tests, i.e., XPS scan after a short sputter. In Fig. 3 we present the high-resolution spectra of pristine PLA in the C 1s and O1s binding energy regions. As expected, in the C 1s spectrum (Fig. 3a) we find prominent peaks, in most cases assigned to polymers: carbonyl groups (O–C=O) at 289.1 eV, C–O bonds at 287 eV, as well as a small contribution at 284.8 eV, typical of poly(lactide). 22,23 After sputter, the PLA and polymeric C–O bonds of PEO (286.2 eV) remain but the carbonyl bond diminishes (Fig. 3e). The carbonyl bond reflects the C–O skeletal structure of both PEO and the PLA. 24–26 This characteristic polymeric environment is also shown in the O1s spectrum (Fig. 3b) having typical oxygen-carbon bonds such as O–C–O at 533.6 eV, C=O at 532.3 eV, and polymeric bonds at 531.9eV. 22 The wetting of the membrane by the ionic liquid electrolyte is evident by the appearance of a C–N peak at 286.4 eV together with a TFSI− peak at 292.5 eV in the C 1s region (Fig. 3c). 27,28
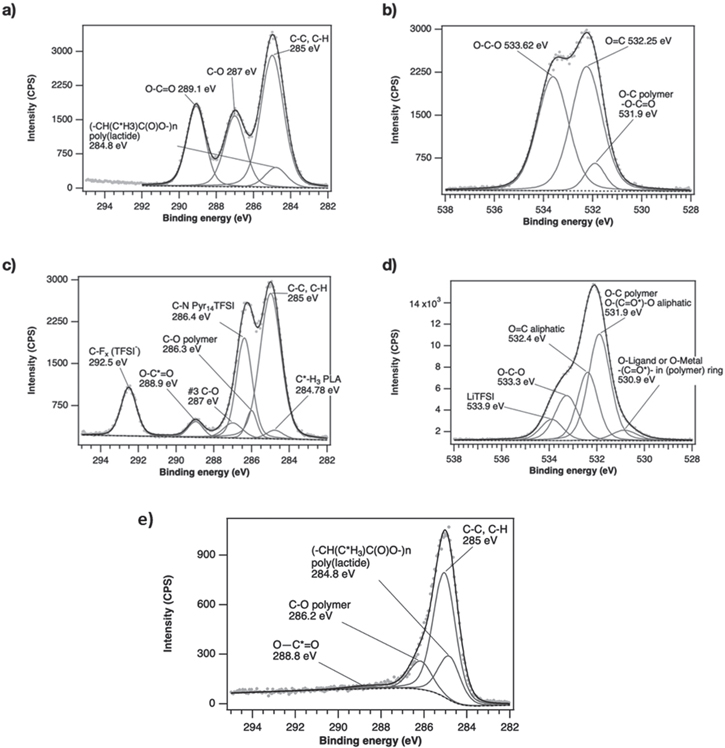
Figure 3. XPS spectra of the plasticized membrane (a) in the C 1s, and (b) O1s regions, and the (c) C 1s, and (d) O1s energy regions after infusing the 10 μl of 0.3 M LiTFSI Pyr14-TFSI. in the membrane.
Download figure:
Standard image High-resolution imageWhen we examine the variations induced in the O1s spectrum following the addition of the 0.3 M LiTFSI Pyr14TFSI ionic liquid (Fig. 3d), we tend to conclude that Li ions form complexes not only with PEO, but with the PLA, as well, e.g., Li⤑:O = C–O bond. There is a low O1s peak at ∼530.9 eV that is not present in the neat PLA scan and can be associated with the interaction of a Lewis base (here the non-bonding electron pairs of oxygen-containing groups) with a metal atom or ion acting as a Lewis acid. 29 A similar shift to a lower binding energy in the O1s region due to cation-oxygen Lewis-base interaction was reported by Tseng et al., for the bonding of Pt+ to a C–OH group. 30
The charge-transport dynamics in the 3D-printed electrolytes have been investigated by pulsed-field gradient-diffusion nuclear magnetic resonance (PGSE-NMR) with the use of the probe nuclei 1H, 7Li, and 19F, corresponding to the PYR14
+, Li+, and TFSI− ions. The self-diffusion coefficients as a function of temperature are shown in Fig. 4. The values of diffusion coefficients are compiled in Table II. As expected, the diffusion coefficient increases as the temperature rises, and this trend is consistent through all the samples. A linear fit (R2 > 0.98) to reciprocal temperature is in agreement with the Arrhenius Law. In spite of the fact that the Li+ cation is the smallest ion in the system, it exhibits the lowest diffusion coefficient, followed by TFSI− and PYR14
+, whereas PYR14
+, constituting the largest ion, shows the highest diffusion coefficient over the whole temperature range (Table II). On the basis of ion sizes, PYR14
+ > TFSI− > Li+, and on the Stokes−Einstein equation, one would predict that the order of the self- diffusion coefficients should be  This indicates that, whereas the larger PYR14
+ cation diffuses as a single ion, neither the TFSI− anions nor the Li+ cations diffuse as single ions. It is a clear indication that Li+ cations and TFSI− anions are forming aggregates, as observed in many other Li-IL systems.
31
This trend is observed for all samples, except that in the PLA-IL-LiTFSI sample, all three diffusion coefficients become nearly equal at the highest temperature.
This indicates that, whereas the larger PYR14
+ cation diffuses as a single ion, neither the TFSI− anions nor the Li+ cations diffuse as single ions. It is a clear indication that Li+ cations and TFSI− anions are forming aggregates, as observed in many other Li-IL systems.
31
This trend is observed for all samples, except that in the PLA-IL-LiTFSI sample, all three diffusion coefficients become nearly equal at the highest temperature.
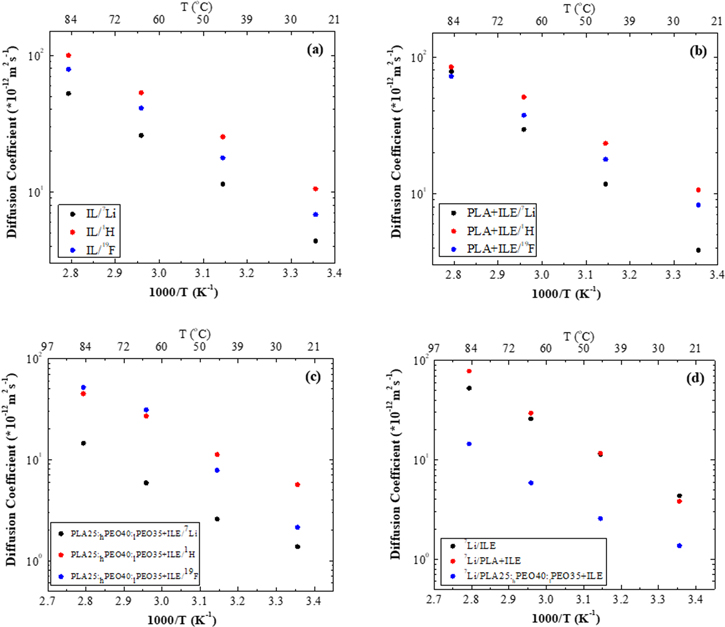
Figure 4. Temperature dependence of the self-diffusion coefficients of Li+, TFSI− and PYR14 + in IL/Li (a), neat PLA + IL/Li (b) and PLA25:hPEO40:lPEO35 + IL/Li (c); temperature dependence of the self-diffusion coefficients of Li+ for all three samples (d).
Download figure:
Standard image High-resolution imageTable II. Self-diffusion coefficients (D) of Li+, TFSI− (F) and PYR14 + (H) in IL, neat PLA + IL and PLA25:hPEO40:lPEO35 + IL at different temperatures.
T 
| Samples |


|


|


|


|


|


|


|
|---|---|---|---|---|---|---|---|---|
| 25 | IL/Li | 4.37 × 10⁻¹² | — | 6.80 × 10⁻¹² | — | 1.05 × 10⁻¹¹ | — | — |
| Neat PLA/IL/Li | 3.84 × 10⁻¹² | — | 8.22 × 10⁻¹² (87%) | 8.87 × 10⁻¹³ (13%) | 1.06 × 10⁻¹¹ (66%) | 2.46 × 10⁻¹³ (34%) | — | |
| PLA-hPEO-lPEO/IL/Li | 1.37 × 10⁻¹² | — | 2.13 × 10⁻¹² (37%) | 4.86 × 10⁻¹³ (63%) | 5.66 × 10⁻¹² (11%) | 1.23 × 10⁻¹² (49%) | 1.14 × 10⁻¹³ (40%) | |
| 45 | IL/Li | 1.14 × 10⁻¹¹ | — | 1.89 × 10⁻¹¹ | — | 2.53 × 10⁻¹¹ | — | — |
| Neat PLA/IL/Li | 1.17 × 10⁻¹¹ | — | 1.78 × 10⁻¹¹ (87%) | 2.23 × 10⁻¹² (13%) | 2.33 × 10⁻¹¹ (57%) | 1.16 × 10⁻¹³ (43%) | — | |
| PLA-hPEO-lPEO/IL/Li | 2.58 × 10⁻¹² (45%) | 8.19 × 10⁻¹³ (55%) | 7.82 × 10⁻¹² (59%) | 2.69 × 10⁻¹² (41%) | 1.12 × 10⁻¹¹ (25%) | 1.51 × 10⁻¹² (50%) | 1.80 × 10⁻¹³ (25%) | |
| 65 | IL/Li | 2.59 × 10⁻¹¹ | — | 4.10 × 10⁻¹¹ | — | 5.33 × 10⁻¹¹ | — | — |
| Neat PLA/IL/Li | 2.95 × 10⁻¹¹ | — | 3.75 × 10⁻¹¹ (72%) | 1.48 × 10⁻¹² (28%) | 5.09 × 10⁻¹¹ (54%) | 8.50 × 10⁻¹³ (46%) | — | |
| PLA-hPEO-lPEO/IL/Li | 5.88 × 10⁻¹² (92%) | 6.81 × 10⁻¹³ (8%) | 3.11 × 10⁻¹¹ (50%) | 1.24 × 10⁻¹¹ (50%) | 2.33 × 10⁻¹¹ (31%) | 3.20 × 10⁻¹² (39%) | 3.96 × 10⁻¹⁴ (30%) | |
| 85 | IL/Li | 5.26 × 10⁻¹¹ | — | 7.90 × 10⁻¹¹ | — | 1.00 × 10⁻¹⁰ | — | — |
| Neat PLA/IL/Li | 7.82 × 10⁻¹¹ | — | 7.21 × 10⁻¹¹ (55%) | 2.25 × 10⁻¹² (45%) | 8.45 × 10⁻¹¹ (49%) | 1.75 × 10⁻¹² (51%) | — | |
| PLA-hPEO-lPEO/IL/Li | 1.45 × 10⁻¹¹ (67%) | 4.97 × 10⁻¹² (33%) | 5.19 × 10⁻¹¹ (59%) | 2.26 × 10⁻¹¹ (41%) | 4.49 × 10⁻¹¹ (29%) | 5.48 × 10⁻¹² (40%) | 3.50 × 10⁻¹⁴ (31%) |
In the case of the IL-LiTFSI, classic single-component diffusion is apparent for all the ions. Diffusion results obtained for the polymer samples display two or three diffusing components, for all 1H, 7Li and 19F nuclei. In the sample consisting of the IL electrolyte imbedded in the PLA matrix, 19F and 1H spectra clearly show two diffusion components. According to the observed data for 7Li, it is less clear if 7Li has one or two components of diffusion, as a result of the lower signal-to-noise ratio. However, it was only possible to get an accurate value for the fast-diffusion component.
From observed data of the IL-plasticized PLA25- hPEO40-lPEO35 sample, 19F and 7Li nuclei clearly show two-exponential diffusion, but 1H shows three-component diffusion. One component is diffusing rapidly, and is assigned to the IL cation inside the polymer. The other is considerably slower and is likely attributable to the lower MW PEO. This is most likely an indication of material structural heterogeneity on a scale of one to several microns (the length scale of the NMR measurement).
Satisfactory fitting of the two- and three-component diffusion, was obtained by adding one and two exponential terms respectively, to the standard Stejskal–Tanner expression;


where 
 and
and  are the diffusion constants for the diffusion components A, B and C.
Diffusion Arrhenius plots are displayed separately for each sample in Figs. 4a–4c and the numerical values of the diffusion coefficients estimated by least-squares fitting are summarized in Table II. These results show that diffusion coefficients of all components in IL-plasticized PLA25-hPEO40-lPEO35 electrolyte are considerably reduced compared to their values in the IL with 0.3 M LiTFSI, even though the ionic conductivity exhibited an acceptable value. Interestingly, in the PLA-IL-LiTFSI sample, the diffusion of all three nuclei is close to those in the IL/Li electrolyte. Also, 7Li diffusion in neat PLA-IL-LiTFSI exhibits a steeper increase with temperature than in the liquid electrolyte (Fig. 4d). Considering the observation of fast 7Li diffusion in neat PLA membrane plasticized by IL, we suppose that this results from poor wetting and low uptake of IL, which weakens their interaction and the signal, therefore, contains a significant contribution of cation diffusion in the "free" IL. Figure 4c displays the diffusion coefficients of the PLA25-hPEO40-lPEO35. While the 7Li values are the lowest of all samples, the 19F values actually exceed those of 1H at the highest temperatures. This suggests that the Li+ ions are coordinated by the PEO segments, thereby freeing the TFSI− ions to a certain extent.
Figure 5a shows typical Nyquist plots for the cells comprising plasticized by 0.3 M and 1 M IL PLA25-hPEO40-lPEO35 electrolyte, sandwiched between two non-blocking lithium electrodes. The plots are represented by two partially overlapping depressed semicircles. The interpretation of the impedance spectrum is often based on equivalent-circuit models that are used to approximate the physicochemical processes that occur in the cell. Interpretations of the plots is done in the following manner—Rbulk is extracted from the intercept of the fitted semicircle in the high-frequency branch with the x-axis (R1). This semicircle is presumed to contain two overlapping arcs. The first arc, in the higher frequency range, with nF-capacitance is attributed to grain-boundary conduction in blended polymer electrolyte (R2 = RGB). The second (lower frequency) arc, with μF-capacitance values, represents SEI on lithium electrodes.
32
R3 is extracted from the real part of the fitted semicircle and divided by two to calculate the RSEI, which is the same for the two identical lithium electrodes. Another semicircle, evident at low frequencies and more pronounced in low-content PLA electrolytes (maximal frequency of 5 Hz and capacitance of 4 mF) can be related either to the formation of ion-pairs or to limited diffusion of the ions in the separator, as found by Strauss et al.
33
Strauss observed this phenomenon in composite polymer electrolytes (CPEs) with EO:Li ratio ranging between 1.5 to 80 for the SPEs reported. W5 in the equivalent circuit is the Warburg element associated with unlimited diffusion of ions in the excess of IL electrolyte. An arc, which appears in the high-frequency region for all the electrolytes containing PLA at all temperatures, diminishes with temperature in PLA-free electrolytes until it vanishes completely at 60  The electrolyte containing PLA alone exhibits about one order of magnitude lower bulk conductivity as compared to the one containing PEO. Increase of the PEO content of both high and low molecular weight (MW 5 * 106 and MW 3000) at the expense of PLA polymer, leads to great improvement of bulk conductivity, increasing from 6 × 10⁻³ mS cm−1 for neat PLA-IL to 0.15−0.18 mS cm−1 for 25 and 40%wt. PEO (Fig. 5b) at 60°C. Grain-boundary conductivity increases from 0.1 to 1.9−2.2 mS cm−1 (Fig. 5c). Increasing the concentration of lithium imide salt in PLA25-hPEO40-lPEO35 electrolyte from 0.3 M to 1.0 M leads to bulk-conductivity increase from 0.18 mS cm−1 to 0.31 mS cm−1 at 60
  which follows the three-fold increase in the number of charge carriers. In all probability, the conductivity could be further enhanced. However higher LiTFSI concentration causes increase of the viscosity of IL, which deteriorates wetting and absorbance of the printed membranes by IL, as reported by Nadherna et al.
34
An inflection point appearing at about 60
which follows the three-fold increase in the number of charge carriers. In all probability, the conductivity could be further enhanced. However higher LiTFSI concentration causes increase of the viscosity of IL, which deteriorates wetting and absorbance of the printed membranes by IL, as reported by Nadherna et al.
34
An inflection point appearing at about 60  in Arrhenius plots is related to the melting of PEO. An apparent activation energy at above 60
  varies from 7 to 9 kcal mol e−1; while below 60
  it is 14 and 9 kcal mole−1 for 1 M IL and 0.3 M IL, respectively. The slope of the BC segment in the plot may be interpreted as the apparent activation energy of the solid electrolyte. However, the slope of the AB segment is associated with many processes: conduction in the solid and in the molten phases, ionic association in the molten phase, etc Fig. 5d exhibits SEI layer resistance vs temperature for the plasticized printed electrolytes. Again, it is clear that the SEI resistance values are much lower in the lithium cells containing IL-plasticized polymer membranes. This is likely to be due to the better wettability of the ductile PEO-containing membranes, allowing better contact of the printed films with lithium electrodes. The grain-boundary-conductivity values of printed electrolytes and the RSEI were found to be scarcely affected by the concentration of lithium imide salt in the IL electrolyte.
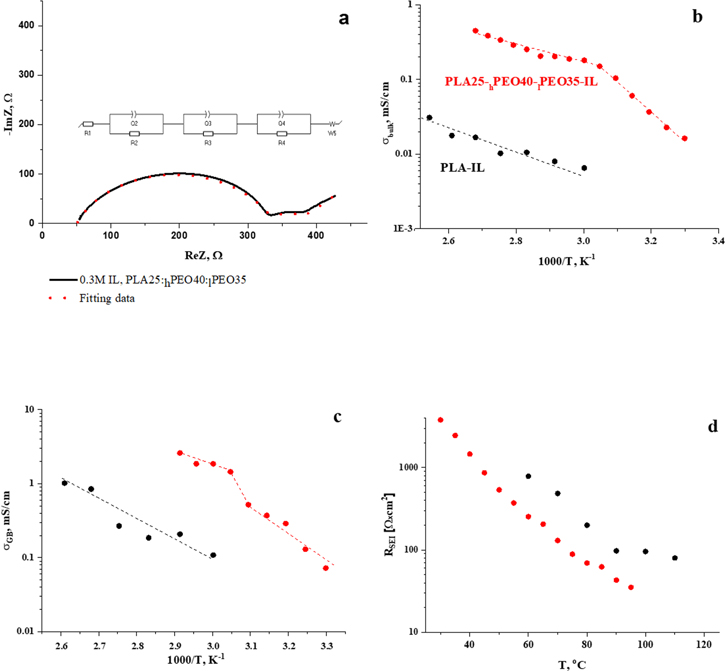
Figure 5. Nyquist plots, equivalent electrical circuit and corresponding fitting data for various Li/membrane-IL/Li conductivity cells. Comparison of bulk (b); grain boundaries (c) conductivities; and SEI layer resistivity (d).
Download figure:
Standard image High-resolution imageLithium transference number is an important parameter for electrolytes, for the reason that the higher the tLi+, the better it can mitigate the anion accumulation in the vicinity of the electrode/electrolyte interface by relieving the concentration polarization. The tLi+ value of 3D printed plasticized electrolyte, measured by a combination of potential polarization and EIS at 60 °C, 35 showed that it is close to 0.2, lower than the values reported for neat LiTFSI-Pyr14 ionic liquid electrolyte. 36 There are two possible reasons for a low tLi+ value of t+. One is the relatively low concentration of lithium cations in small amount of IL-electrolyte (20 μl) used for the plasticization, which promotes concentration polarization. The second reason could be the reduced molar ratio between Li+ and the functional groups of PLA and PEO, which participate in the complexation, and the slow relaxation of which influences ion transport. The interfacial stability of the electrolyte with Li anode was further elucidated by galvanostatic Li plating/stripping on symmetric Li∣PLA-PEO-IL∣Li cells. The tests were carried out at 25 and 50μA cm−2 at voltage range of ±1 V. The prolong cycling shows that, the cell presents a stable profile with relatively low polarization with no indication of Li dendrite growth on the Li metal surface (Fig. 6). The developed plasticized polymer electrolyte was tested in the half cell, composed of metallic lithium anode and 3D printed LFP-based cathode. As one can see from the plots (Fig. 7), the operating voltage is similar to that of the batteries with commercial electrodes. The higher charge/discharge overpotential is attributed to the high impedance of the cell with printed cathode, which contained only poor-conducting PLA polymer, as the binder of LFP. In addition, since the amount of IL incorporated in the printed plasticized electrolyte (PPE) was very small, it was insufficient to provide low-resistant printed electrode/PPE interfacial contacts. Despite this, four times increase of the current density did enable reversible cycleability of the cell.
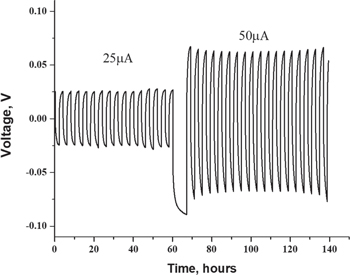
Figure 6. Charge/discharge profiles of symmetrical Li/Li cell comprising plasticized printed electrolyte.
Download figure:
Standard image High-resolution image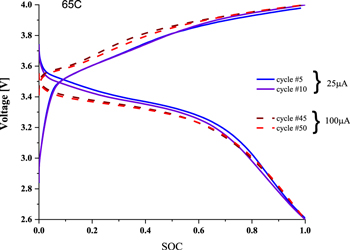
Figure 7. Charge/discharge profiles of Li/LFP cell composed of plasticized printed electrolyte and printed cathode.
Download figure:
Standard image High-resolution image
Finally, we would like to mention that we have recently presented for the first time all-solid-state LFP/LTO battery, in which all the components were printed by fused filament fabrication. 9 However, the electrochemical performance of these cells was poor due to high internal impedance. Aiming at the enhancement of conductivity of printed polymer electrolyte, we started the development of intrinsically-plasticized solid filaments prepared by one-shot dry-processing extrusion procedure. The research, presented in the current manuscript, is the first step of this development. At this point we studied the effect of vacuum infusion of LiTFSI-Pyr14 IL electrolyte to the printed membrane and characterized this system by SEM, DSC, XPS, NMR and EIS methods. Of particular importance for us was using as small, as possible amount of IL in order to keep the printed samples in the easy-processable solid state and to enable further printing of intrinsically plasticized filaments. The study described in the manuscript enabled us to unravel the complex interplay between the IL uptakes (absorption of IL by PLA and PEO) and Li-PEO vs Li-PLA interactions, which influence phase transitions, conductivity and self-diffusion coefficients.
When comparing the electrochemical characteristics of all-solid 9 and quasi-solid electrolytes in Li/Li cells at 60 °C it is noticeable that bulk conductivity is one order of magnitude higher (1.1 × 10⁻² vs 0.18 mS cm−1), and grain-boundary conductivity (1.4 × 10⁻² vs1.9 mS cm−1) is two orders of conductivity higher in the cells with quasi-solid electrolyte. The significantly enhanced conductivity is attributed to the plasticizing effect of the ionic liquid Pyr14TFSI, leading to higher molecular mobility and better ion transport. In addition, the RSEI is lower in the cell with quasi-solid electrolyte, which is reflected in better electrochemical performance of Li/LFP cells.
The research of free-form-factor battery with all-fully printed components based on intrinsically-plasticized solid filaments is in progress and the results will be published elsewhere.
Conclusions
This study reports the fabrication of 3D-printed quasi-solid PLA-PEO electrolytes infused with LiTFSI ionic liquid. There is a complex interplay between the IL uptakes (absorption of IL by PLA and PEO) and Li-PEO—Li-PLA interactions, which influence phase transitions, conductivity and self-diffusion coefficients. The quasi-solid printed electrolyte showed higher bulk-conductivity values with increased content of PEO and of the concentration of lithium imide salt. Clear demonstration of the plasticizing effect of the ionic liquid is shown by DSC measurements, which are exhibited by the reduced melt and glass-transition temperatures of the polymers and diminished crystallinity. XPS data of 3D printed pristine PLA infused with LiTFSI solvated by ionic liquid show evidence of some kind of the interaction between of PLA- and lithium cation in addition to the well-known formation of PEO-Li complexes. By this is meant that PLA not only promotes thermal robustness up to 120  but it may also induce additional conduction paths to the quasi-solid printed electrolyte. On the other hand, when comparing ionic-conduction properties of quasi-solid-state 3D-printed electrolyte plasticized by ionic liquid of pristine PLA and PLA-PEO printed blends, we can conclude that neat PLA exhibits poor Li ion conduction, yielding a bulk-conductivity value of 7 × 10⁻⁶ S.cm−1. Whereas, being mixed with PEO the ion conduction increases by almost one-and-a-half orders of magnitude, approaching 0.2mS.cm−1 at 60
  Increasing the number of charge carriers causes the bulk conductivity to increase (4 × 10⁻⁴ S.cm−1 at 60
  ). However, conduction through grain boundaries and solid-electrolyte-interphase resistance seem to be unaffected.
The self-diffusion coefficients in PLA-IL samples measured by PFG -NMR were found to be close to the neat IL electrolyte, but they were lower in the blended PLA-PEO-IL electrolytes. This disagreement can be attributed to the different ion-transport-length scales probed by NMR and AC impedance tests, with the former addressing micron-scale motion occurring during the several millisecond timeframes of the PFG experiment with the latter requiring minutes-long tests. Moreover, incomplete wetting of the printed PLA may leave small regions of IL electrolyte, which are invisible to the eye, but PFG detectable. And finally, the NMR measures all mobile species, including neutral ion pairs and higher aggregates, the former of which do not contribute to the conductivity. Cycling of symmetrical lithium cell with printed plasticized electrolyte for 140 h shows that, the cell presents a stable profile with relatively low polarization with no indication of Li dendrite growth. The operating voltage of LFP/Li cell was found to be similar to the to that of the batteries with commercial electrodes. The higher charge/discharge overpotential is caused by high impedance of the cell with printed cathode, which contained only poor-conducting PLA polymer, as the binder of LFP. In addition, since the amount of IL incorporated in the printed plasticized electrolyte (PPE) was very small, it was insufficient to provide low-resistant printed electrode/PPE interfacial contacts. Despite this, four times increase of the current density did enable reversible cycleability of the cell.
Acknowledgments
This research was funded by Israel Ministry of Science and Technology, grant 81485. Nishani Jayakody acknowledges financial support from the U.S Office of Naval Research.