
Abstract
Micro-mechanical properties of electrodeposited cobalt films were investigated by micro-compression tests for application in miniaturized magnetic electronic devices. FCC and HCP crystal structures were both present in the electrodeposited cobalt. Nanotwins were also confirmed in the HCP lamellas. The average grain size was ranged from 13.8 to 15.4 nm obtained from the Scherrer equation. Yield strengths of the micro-pillars were ranged from 948 to 1075 MPa, which were about twice that of the bulk cobalt. The high yield strength obtained from the micro-compression test was a result of the fine grain size and the small sample size used in the compression test, which correspond well to the Hall-Petch relationship and the sample size effect, respectively.
Export citation and abstract BibTeX RIS

This is an open access article distributed under the terms of the Creative Commons Attribution 4.0 License (CC BY, http://creativecommons.org/licenses/by/4.0/), which permits unrestricted reuse of the work in any medium, provided the original work is properly cited.
Miniaturization of electronic devices is always a research interest, such as microelectromechanical systems (MEMS) devices having smaller size, lighter weight and faster start-up than conventional electromechanical systems. 1–3 The small size and lightweight are advantageous in lowering the power consumption and heat generation in the working state, which are important properties in a diverse range of applications including the aerospace and automotive industries, robotics, biomedical engineering and smart wearable devices. 4–7 MEMS magnetic actuators are driven by Lorentz force exerted by a magnetic field. High force, large displacement and low voltage are the most important features provided by MEMS magnetic actuation devices. 8–10 Cobalt can fulfill the demand as a promising material in the magnetic actuation field, which exhibits a high coercivity and high saturation magnetization as a pure element material. 11,12
Mechanical property evaluation of materials to be used as the movable components in actuators is critical to ensure the structure stability of the movable component and eventually the lift-time of the device. Components in miniaturized electronic devices are expected to have small size, and the size could be in micrometer scale or smaller. Mechanical properties of metallic materials, such as cobalt, are known to have the sample size effect, 13–17 which strengthening is observed following a reduction in the size of the sample used in the mechanical property evaluation, especially when the sample size is reduced to micrometer scale. Therefore, for application in miniaturized electronic devices such as MEMS, the mechanical property evaluation has to be conducted using sample sizes similar to those used in application.
Electrodeposition is a low cost, versatile, and powerful method in fabrication of electronic components having complex structures, 12,18 and the average grain size of electrodeposited materials can be simply adjusted by the applied current density to refine the average grain size to nanometer scale. 19 Grain boundaries in metallic materials play an important role in the strengthening. The grain boundary could restrict movement of dislocations and results an increase in the overall strength. As the average grain size decreases, the number of grain boundaries increases and leads to an increase in the yield strength following the Hall-Petch relationship. 20,21 When the average grain size decrease to about 10 nm, a reversed Hall-Petch relationship is observed for some nanocrystalline materials. 22,23 When the volume of the triple junctions in metallic materials exceeds the volume of the grain boundaries, the yield strength is suggested to be mainly determined by the yield strength of the triple junctions instead of the grain boundaries, hence a reversed Hall-Petch relationship would be observed. 24
Micro-mechanical properties of electrodeposited metallic materials commonly used in electronic devices, such as gold, nickel and copper, are reported in previous studies. 13–15 Micro-mechanical properties of electrodeposited cobalt toward miniaturized electronic devices are still not well studied. This could be because cobalt has two stable crystalline structures at room temperature, which are face-centered cubic (FCC) and hexagonal close-packed (HCP) structures, 25,26 and mixing of the two crystalline structures is also possible. These lead to complexity in micro-mechanical property evaluation of electrodeposited cobalt.
In this study, relationships between the yield strength of electrodeposited cobalt evaluated by micro-compression test and the average grain size and crystal structure are reported. The average grain size and the crystal structure are manipulated by the applied current density. Vickers hardness of the electrodeposited cobalt films is also evaluated as a comparison.
Experimental
Cobalt films were electrodeposited on pure copper (99.99%) substrates having a dominant {111} crystal orientation, Pure platinum (99.99%) was used as the anode electrode. Both copper and platinum substrates have dimensions of 10 mm × 20 mm × 0.3 mm. Composition of the electrodeposition bath was 350 g l−1 of CoSO4 · 6H2O, 45 g l−1 of CoCl2 · 6H2O and 40 g l−1 of H3BO3. The electrodeposition temperature was 303 K. Different current densities at 5, 10, 12, and 15 A dm−2 (ASD) were used, and the deposition time was adjusted to produce cobalt films having a thickness of about 100 μm when assuming 100% of the current efficiency.
Surface morphology and crystal characteristics of the electrodeposited cobalt films were examined by a scanning electron microscope (SEM, Nova NanoSEM 450, US) using 15 kV. The crystal characteristics were evaluated by X-ray diffraction (XRD, Ultima IV, Rigaku, Japan) with Cukα radiation at 40 kV and 40 mA, step size of 0.01° (2θ) and scan rate of 0.2° min−1. The XRD patterns were analyzed using a MDI Jade software for the value of the full width at half maximum (β, FWHM). Average grain size of the film was calculated using the Scherrer equation shown in the following: 27

Where K is the Scherrer constant, generally about 1.0 for spherical particles; λ is the X-ray wavelength, Cukα = 0.15418 nm; β is the FWHM in radians; θ is the peak position (2θ/2), in radians. Transmission electron microscopy (TEM, JEM-2100F, JEOL, Japan) and selected area electron diffraction (SAED) equipped in the TEM were also used to characterize the crystal structure. The Vickers hardness was tested on a micro hardness tester (MHT, HMV-G20S, Shimadzu, Japan) at a load of 0.01 kg and a loading time of 15 s. The Vickers hardness value reported in this study were averaged using 5 points obtained from each cobalt film.
Micro-pillars were fabricated from the cobalt films using focused ion beam (FIB, FB-2100, Hitachi, Japan). Details of the micro-pillars fabrication method are reported in a previous work. 28 The micro-pillars had a square cross-section and dimensions of 10 μm × 10 μm × 20 μm, and the square cross-section was perpendicular to the cobalt/copper interface. The micro-compression was conducted at a constant strain rate of 5.0 × 10⁻³ s−1 using a piezo-electric actuator.
Compression of bulk-size cobalt was also conducted as comparisons with the micro-compression test. The test samples had dimensions of ϕ 3 mm × 3 mm were fabricated from a hot-rolled cobalt plate (99.98%) by wire cutting. The average grain size was about 1 μm. The compression was performed on a universal test machine (UTM, UTM5305H, Suns, China) at the same strain rate with micro-compression test.
Results and Discussion
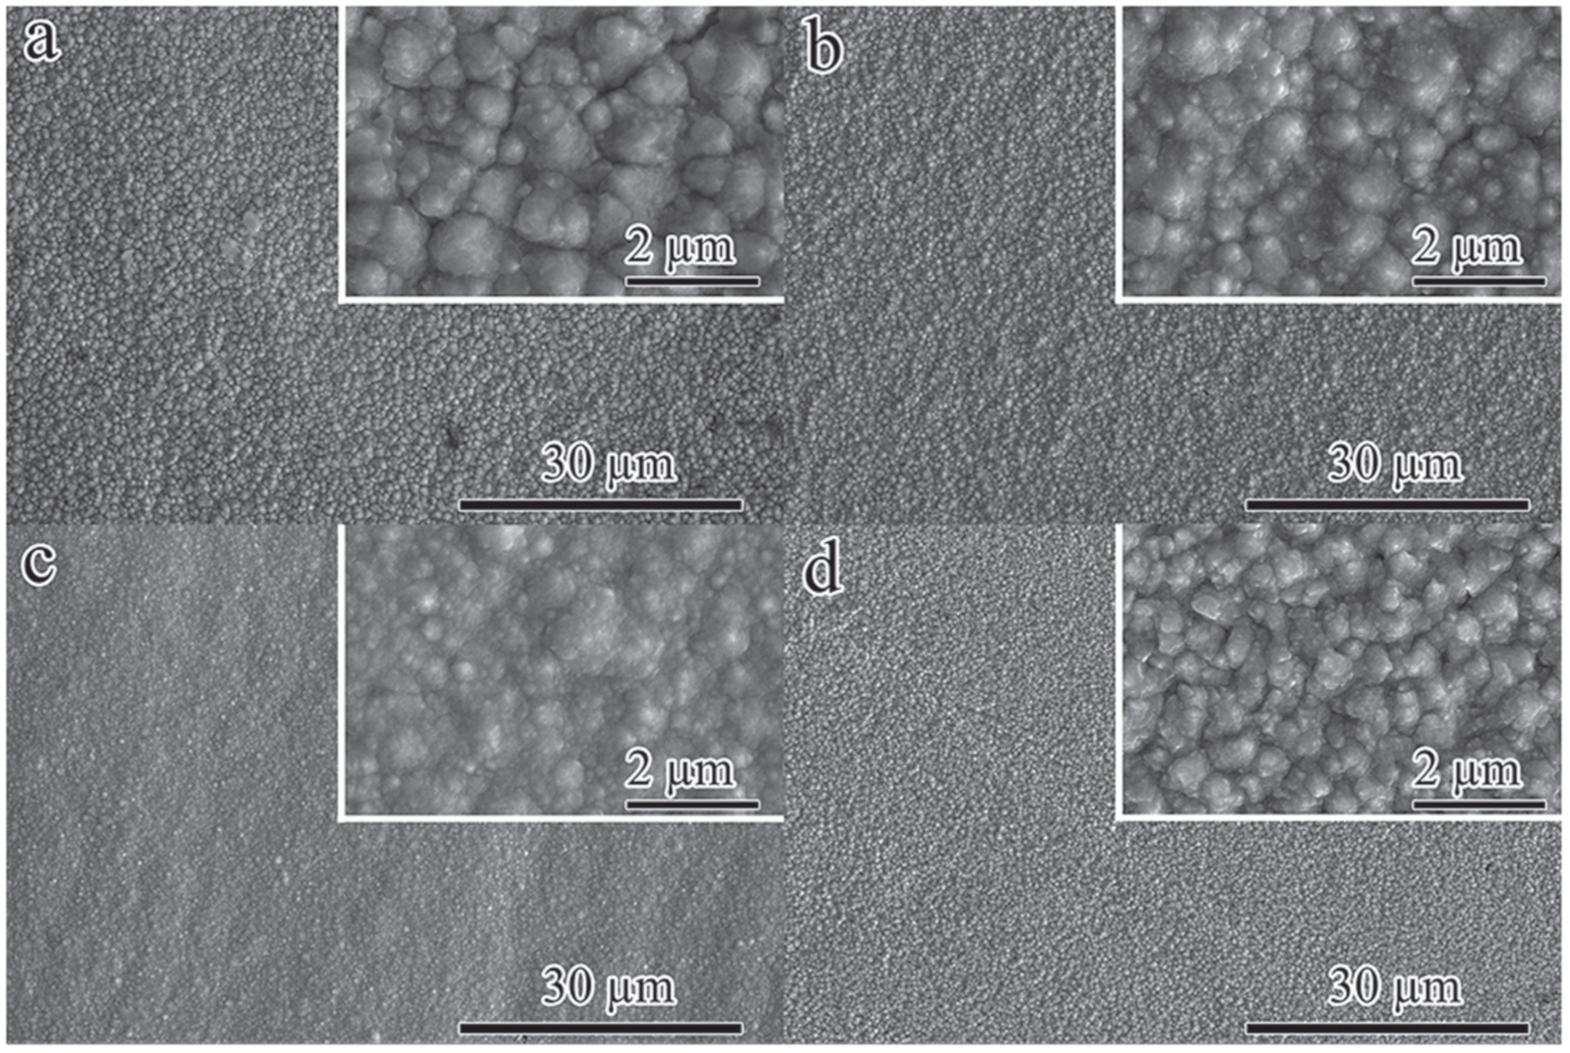
The surface morphology of the electroplated cobalt films is shown in Fig. 1. The surfaces were composed of particle-like structures. The cobalt particles grew spirally along one or more screw directions on the surface to form particles as polygonal cones by the spiral growth mechanism. 29 When these particles grow up and connect to each other, they merged into a new particle, and this could lead to formation of defects as pores between them. It was clear that the average particle size became smaller and the pore-like features between the inter particles became shallower following an increase in the current density. The refined particle size was suggested to be a result of the promoted overpotential and the nucleation rate as the current density increased. The particles growth changed from the layer-by-layer growth advantage to the spiral growth advantage as the current density increased from 5 to 12 ASD. 29 At higher current density, the surface morphology was more uniform and smoother, and amount of the surface defects was reduced. At 15 ASD, due to the excessive current density, cobalt particles began to form at edges of the copper plate with abnormally large sizes, which reveal an uneven distribution of the current density from the edge to middle area of the copper substrate.
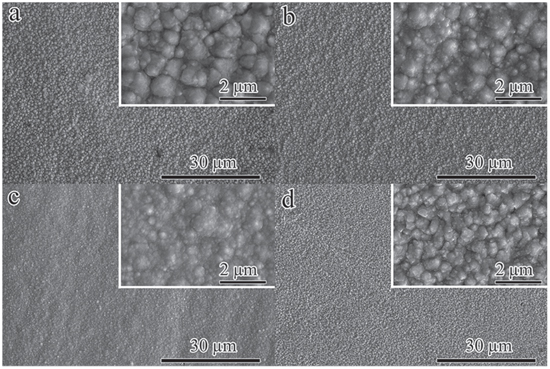
Figure 1. SEM images of the cobalt films electrodeposited at 303 K and at (a) 5, (b) 10, (c) 12 and (d) 15 ASD. The insert image shows magnified view of each images.
Download figure:
Standard image High-resolution imageBoth HCP and FCC crystal structures of cobalt were observed in the electrodeposited cobalt prepared in this study as shown in in X-ray diffraction (XRD) patterns in Fig. 2. FCC and HCP crystal structures of cobalt had two same diffraction peak positions, {002}HCP//{111}FCC and {110)HCP//{220}FCC. In Fig. 2, {002}HCP//{111}FCC diffraction angle was close to {111}FCC of the copper substrate. In Fig. 2, the XRD patterns of electrodeposited cobalt films at 5, 10, 12, 15 ASD were also compared. A decrease in the peak intensity of the {100}HCP was observed following an increase in the current density. At 12 ASD, the peak intensity of the {200}FCC increased, which indicated an increase in ratio of the FCC crystal structure in cobalt film at high current density.
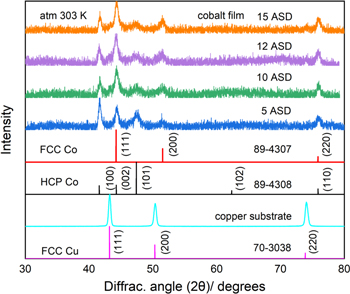
Figure 2. XRD of the cobalt films electrodeposited at 303 K and at 5, 10, 12, 15 ASD and XRD of copper substrate.
Download figure:
Standard image High-resolution imageAverage grain sizes of the cobalt films were calculated separately from the {100}HCP, {002}HCP//{1 1}FCC, {101}HCP, {200}FCC and {110}HCP//{220}FCC peaks by the Scherrer equation and presented in Fig. 3, and the values obtained from the five peaks were average by the least squares method.
30
The values estimated from the {101}HCP showed a faster decreasing trend following an increase in the current density than those of the {002}HCP//(1
1}FCC, {101}HCP, {200}FCC and {110}HCP//{220}FCC peaks by the Scherrer equation and presented in Fig. 3, and the values obtained from the five peaks were average by the least squares method.
30
The values estimated from the {101}HCP showed a faster decreasing trend following an increase in the current density than those of the {002}HCP//(1 1}FCC. On the other hand, the values estimated from the {100}HCP and {200}FCC gradually increased with the current density. The {101}HCP and {002}HCP//{1
 1}FCC are close-packed planes. This implies that electrodeposition at a high current density promoted the nucleation and limited the grain growth, which resulted the grain refinement and formation of small approximately equiaxed grains transformed from the elongated grains.
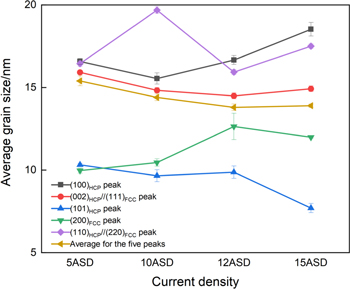
Figure 3. Average grain size of cobalt films estimated by different peaks at 303 K.
Download figure:
Standard image High-resolution imageSAED and TEM observation were conducted to further understand the crystal structure of the electrodeposited cobalt. The results are shown in Fig. 4. The Laue diffraction patterns are shown in Fig. 4b. According to the distance and angles of the Laue diffraction spots, the crystal planes corresponding to the spots can be calculated as (100), (001) and (101) of HCP cobalt, intersecting at the [010] zone axis. The TEM observation revealed the electrodeposited cobalt film was composed of HCP crystal structure without FCC crystal structure. From [010] zone axis, parallel to the electron beam, the TEM image surface in Fig. 4a is (010). Several lamellas on (010) facet were observed, and the angles between the lamellas in two directions were about 120 degrees. The lamellas in the two directions are (10 ) & (001) facet and (101) & (001) facet by calculation, respectively. The positional relationship of the facet was showed in Fig. 4c. The lamellas are suggested to be nanotwins in Fig. 4a, which is reported in cobalt with low stacking fault energies under proper conditions.
31,32
Cobalt grains grew spirally around screw directions and along crystal planes such as (10
) & (001) facet and (101) & (001) facet by calculation, respectively. The positional relationship of the facet was showed in Fig. 4c. The lamellas are suggested to be nanotwins in Fig. 4a, which is reported in cobalt with low stacking fault energies under proper conditions.
31,32
Cobalt grains grew spirally around screw directions and along crystal planes such as (10 ), (001) and (101) to form regular hexagonal cone-shaped particles.
29
When the crystal grows, nanotwin boundaries may be formed at the interface.
), (001) and (101) to form regular hexagonal cone-shaped particles.
29
When the crystal grows, nanotwin boundaries may be formed at the interface.

Figure 4. Bright field TEM images of (a) the cobalt films electrodeposited, (b) corresponding SAED pattern of the cobalt films. (c) SEM image of HCP cobalt.
Download figure:
Standard image High-resolution imageRelationship between the average grain size and Vickers hardness of the cobalt films are plotted in Fig. 5. Averaged values of the five XRD peaks were used in the plotting. The average grain size was ranged from 13.8 to 15.4 nm as the current density varied. 0.2% proof strength of single crystal of cobalt is reported to be 432 MPa, and the Hall-Petch slope is 1900 MPa*nm1/2 for pure cobalt.
33
The yield strength estimated by Hall-Petch equation using the average grain size obtained in this study was 916, 933, 942 and 943 MPa. The change in the yield strength was not significant as the grain size varied from 13.8 to 15.4 nm. For the cobalt films evaluated in this study, the Vickers hardness increased significantly as the current density increased, which the Vickers hardness was found to be ranged from 3138 to 4288 MPa. The Vickers hardness can be converted to the yield strength using the Tabor factor, and the Tabor factor is approximately three.
34
After doing the conversion, values of the Vickers hardness obtained in this study were all higher than the yield strengths estimated from the Hall-Petch equation. The Hall-Petch relationship came from Karimpoor's
35
research data for bulk tensile samples with about 2.5 × 10⁻³ of strain rate by tensile test for polycrystalline and nanocrystalline cobalt. Cobalt is HCP structure, {10 2} twins causes metals with the HCP structure to exhibit significantly different yield strength by tensile and compression test. This is tension-compression yield asymmetry (TCYS).
36
The yield strength from the Hall-Petch relationship is an approximate value, lower than the yield strength by micro-compression test. The yield strength obtained by the tabor factor is also an approximate value. The Vickers hardness approximates to three times of the ultimate tensile strength,
34
and reflects the elastic deformation and plastic deformation of the materials. This method uses the yield strength to be approximately equal to ultimate tensile strength. For insufficient work-hardened materials, the difference between the yield strength and the ultimate tensile strength causes the tabor factor to deviate from three. Internal compressive stress exists on the electrodeposited cobalt films. The internal residual stress enhanced hardness and ultimate tensile strength more than the yield strength. So the yield strength obtained by the tabor factor is higher than the yield strength by micro-compression test for internal compressive stress.
2} twins causes metals with the HCP structure to exhibit significantly different yield strength by tensile and compression test. This is tension-compression yield asymmetry (TCYS).
36
The yield strength from the Hall-Petch relationship is an approximate value, lower than the yield strength by micro-compression test. The yield strength obtained by the tabor factor is also an approximate value. The Vickers hardness approximates to three times of the ultimate tensile strength,
34
and reflects the elastic deformation and plastic deformation of the materials. This method uses the yield strength to be approximately equal to ultimate tensile strength. For insufficient work-hardened materials, the difference between the yield strength and the ultimate tensile strength causes the tabor factor to deviate from three. Internal compressive stress exists on the electrodeposited cobalt films. The internal residual stress enhanced hardness and ultimate tensile strength more than the yield strength. So the yield strength obtained by the tabor factor is higher than the yield strength by micro-compression test for internal compressive stress.
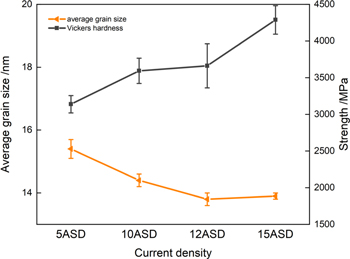
Figure 5. Average grain size and Vickers hardness of the cobalt films.
Download figure:
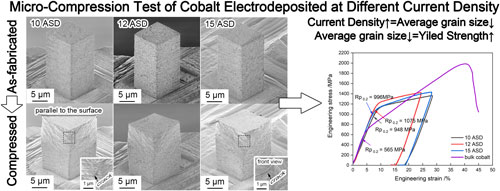
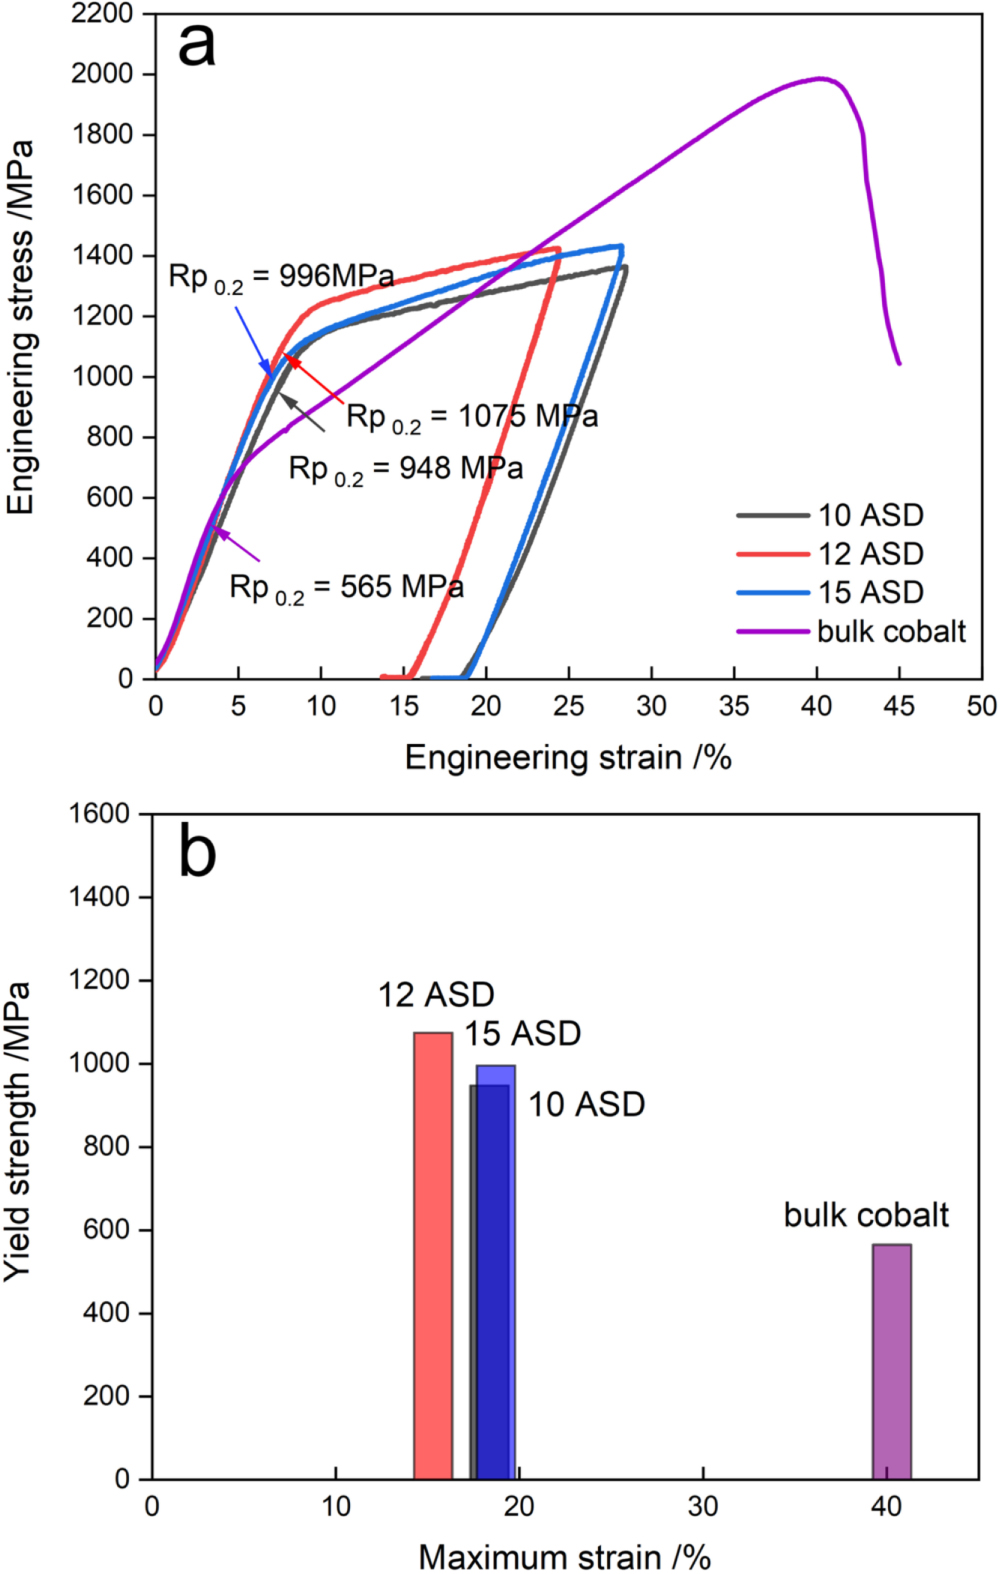
Standard image High-resolution imageImages of the micro-pillars fabricated from the electrodeposited cobalt films are shown in Fig. 6. The micro-pillars were fixed at the bottom ends only, which resulted severe deformations near the top ends of the micro-pillars. At middle part of the micro-pillars, slips were observed, and the slips were at roughly 45 degree angle with respect to the compressive direction. The deformed micro-pillars showed a drum-like shape with no fractures but some cracks on side edge, and bended slightly in the direction perpendicular to the cobalt/copper interface. Engineering stress-engineering strain (SS) curves generated from the micro-compression test and the compression test of bulk cobalt at a constant strain rate of 5.0 × 10⁻³ s−1 are plotted in Fig. 7a. The yield strength (0.2% proof strength) was determined from the SS curves, and the values for cobalt micro-pillars were 948, 1075, and 996 MPa for the cobalt film prepared at 10, 12 and 15 ASD, respectively. For the bulk cobalt, the yield strength was 565 MPa. The highest yield strength was obtained from a micro-pillar fabricated from the cobalt film electrodeposited at 12 ASD, which was about twice the value of bulk cobalt. The promoted strength was suggested to be mostly caused by the fine grain size at 13.8 nm according to the Hall-Petch relationship and the sample size effect. All the micro-pillars had a beyond 20% maximum strain without fracture in Fig. 7b. They were lower than the ∼40% maximum strain of the bulk cobalt, because finer grains have poorer maximum strain. However, the maximum strain values obtained from the micro-compression tests conducted in this study were all higher than the elongation (∼10%) of bulk ultrafine-grained (200 nm grain size) cobalt at a constant strain rate of 1.0 × 10⁻³ s−1 by a combination of high-energy ball milling and subsequent spark plasma sintering. 26 The micro-pillars and bulk cobalt exhibited typical strain hardening across the entire region of plastic deformation, and the micro-pillars exhibited weaker strain hardening when compared to the bulk cobalt.
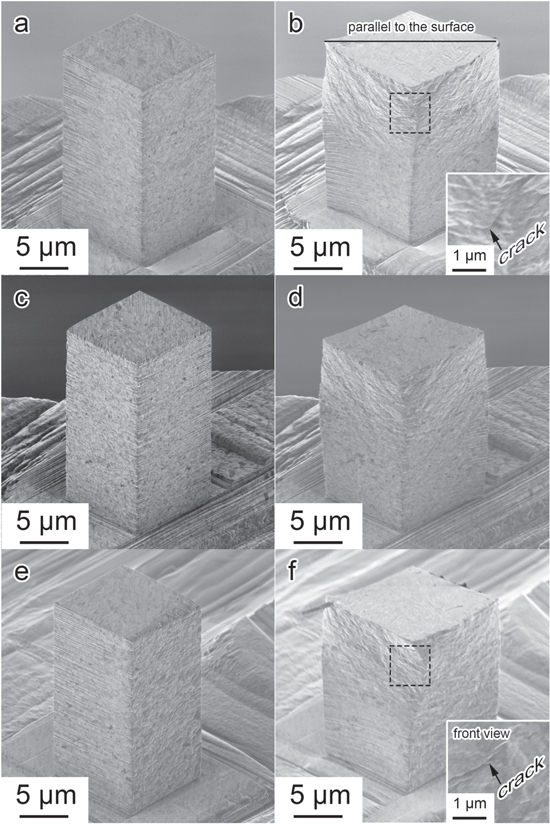
Figure 6. SEM images of the micro-pillars by the micro-compression test (a) before test at 10 ASD; (b) after test at 10 ASD; (c) before test at 12 ASD; (d) after test at 12 ASD; (e) before test at 15 ASD; (f) after test at 15 ASD.
Download figure:
Standard image High-resolution image
Figure 7. (a) Stress-strain curves of micro-pillars by micro-compression test and bulk cobalt by compression test; (b) Yield strength and maximum strain of the micro-pillars and bulk cobalt.
Download figure:
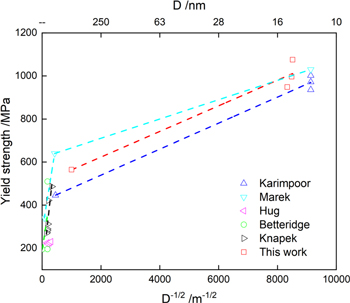
Standard image High-resolution imageThe yield strengths of cobalt by tensile or compression test from Karimpoor, 35 Marek, 26 Hug, 37 Betteridge, 38 Knapek 39 and this work were compared with the average grain size as shown in Fig. 8. The trends of the yield strength and the average grain size is in good agreement with the Hall-Petch relationship with a pronounced different stages. 37 A Hall-Petch relationship equation was obtained by linear least-squares fitting of the yield strength data obtained from bulk cobalt and micro-pillars in this study as listed in following:

Where σy is the yield strength. D is the average grain size. The equation is similar to the equations with bulk cobalt from Karimpoor and of Marek. This indicates that the micro-compression yield strength and average grain size of cobalt micro-pillars are also applicable to the Hall-Petch relationship of bulk crystalline cobalt. When compared with the yield strength estimated from the Hall-Petch equation, the yield strengths obtained from the micro-compression test were all higher. The electrodeposited cobalt films evaluated in this study were composed of both FCC and HCP crystal structures. This might be the main reason causing the difference.
Figure 8. Average grain size of cobalt films and yield stress of micro-pillars by micro-compression.
Download figure:
Standard image High-resolution image
Conclusions
In this study, cobalt films were prepared by electrodeposition at current densities ranged from 5 to 15 ASD. The cobalt films were found to be composed of both HCP and FCC crystal structures from XRD. The electrodeposited cobalt films grew spirally along the (10 ), (001) and (101) planes, forming regular hexagonal particles, and nanotwins were observed in the HCP lamellas. The average grain sizes were evaluated from the XRD information and the Scherer equation, and refinement of the average grain size was observed following an increase in the current density. The Vickers hardness reached 4288 MPa, and the relationship with the average grain size followed the Hall-Petch relationship well. Micro-pillars were fabricated from the electrodeposited cobalt films by FIB and underwent micro-compression testing at a constant strain rate of 5 × 10⁻³ s−1. The micro-pillars showed the yield strength from 948 to 1075 MPa, which were about twice of the yield strength of bulk cobalt at 565 MPa. The high yield strength was mainly caused by the grain boundary strengthening and the sample size effect.
Acknowledgments
This study was supported by the Research Center for Biomedical Engineering, the National Natural Science Foundation of China (No. 51764005, 52064010) and the project from Youth Science and Technology Personnel Training Program of Education Department of Guizhou Province - Guizhou Institute of Technology (QJH-KY-2017222).