
Abstract
Lithium ion battery thermal runaway constitutes a severe inhibitor for the spread and application of electric vehicles and widespread adoption of renewable energy. Reliable and early warning of thermal runaway calls for a technique capable of detecting abnormal response well in advance of the critical event and being effective to the module when a single cell in it has safety issues. In this study, electrochemical impedance spectrum (EIS) dependence on cell temperature and deformation is exploited to generate a two-staged warning method with three indicators in three frequency ranges. Specifically, the first stage utilizes the high sensitivity of EIS at the intermediate-frequency range to abnormal cell internal temperature rise, which is before self-heating temperature, as an early indicator for safety issues. The second stage utilizes the abrupt changes in EIS behaviors due to cell deformation in high- and low-frequency ranges, which are more sensitive than cell voltage change, as indicators for the thermal runaway onset temperature. The potential and issues of such an EIS-based method for both reliable and early warning of thermal runaway in field application, including measurement feasibility, versatility in various scenarios and the difference between the experimental and actual situation, are discussed.
Export citation and abstract BibTeX RIS
Lithium ion batteries (LIBs) have become the leading power and energy source for electric vehicles and energy storage systems. However, the safety anxiety, especially when ternary materials are used to achieve high energy and power density, still constitutes a pressing concern. 1–4 The warning of thermal runaway in the battery management systems (BMS) becomes increasingly important. 5 Previous studies on the warning of thermal runaway looked for the abrupt changes in multi-physics indicators, including voltage, pressure, temperature, etc. 3,6 These abrupt changes result from the solid-electrolyte interface (SEI) decomposition, 7–9 the reaction between the anode and the electrolyte, the decomposition of cathode, the decomposition of electrolyte, etc. 10,11 They immediately precede the accident and leave less time for prevention and escape. In addition, most warning methods rely on sensors placed on a single cell. 12 They are only effective for the single cell and surrounding cells. It is still an open question how to realize early and reliable warning of thermal runaway.
Firstly, considering the earliness of the warning method, most of the existing warning methods for thermal runaway depended on detecting the critical events. The critical events exhibited abrupt changes in various physical parameters, which immediately preceded the battery thermal runaway. For example, the time lag (15 ∼ 40 s) between the internal short circuit temperature and thermal runaway onset temperature in a 25 Ah battery was used for the warning. 3,13–15 The first short voltage drop resulting from separator shrinkage in the thermal runaway process was adopted to alert fire accidents. The voltage platform causing by the balance of voltage between the overcharging and the internal short circuit was taken as a warning indicator. 12–17 These warning methods, even when successful, leave little time for escape and reversible handling of the battery system. Information from non-critical events could be exploited to warn, such as abnormal temperature rise beyond the allowed upper limit by considering the driving conditions, environment temperature, state of charge and state of health. For example, when the temperature is higher than 60 °C for 3 s, 18 the battery management system (BMS) warns that the temperature of the battery pack is too high to work. However, there are two kinds of temperature differences in the battery pack, the difference (5 ∼ 8 °C) among the batteries 19,20 and the difference (1.1 ∼ 10 °C) between the internal and surface of a battery. 21–23 These two temperature differences delay the time of thermocouple detection. It is preferable to develop an early warning method based on the non-critical events and the internal temperature of the battery.
On the other hand, the reliability of the warning methods also needs to be paid attention to. The reliability of warning methods means that they can detect all the possible thermal runaway. A method with multiple indicators reflecting critical and non-critical events at multiple stages and sensitivity to multiple cells containing safety hazards is reliable. For the BMS, the thermocouples were used to monitor the temperature of the battery. Only a very limited amount of thermocouples were installed in module. 19 They cannot monitor all the batteries. In addition, smoke sensors are used to warn thermal runaway in the EVs and energy storage systems. They are only capable of detecting abnormal events from multiple nearby cells due to the limited space. 24 These methods cannot reliably monitor the safety of every battery. For multiple stages, the abnormal events took place before the self-heating onset temperature stage. The abrupt events occured at the self-heating stage and preceding the battery thermal runaway onset temperature stage in accelerating rate calorimeter (ARC) experiments. The existing warning methods only applied a single indicator, such as potential drop, 13,16 to monitor one stage temperature preceding the battery thermal runaway. Therefore, it is desirable to achieve reliable warning by monitoring multi-indicators and multi-stages of every battery.
The electrochemical impedance spectroscopy (EIS), a powerful method capable of separating physico-chemical processes at different time scales, was also exploited to warn of battery thermal runaway. EIS is sensitive to the temperature and the deformation of the batteries. The internal temperature was estimated by EIS-derived indicators in different single frequency measurements, such as the phase shift at 40 Hz, 25 an Arrhenius-type expression to fitting imaginary impedance 26 and the real part of EIS at 215 Hz. 23 These methods can realize early warning. However, the single frequency measurement indicators provided a warning for only one stage of temperature. It is inadequate in the reliability of the warning method.
This paper aims to develop a reliable and early warning method for lithium ion battery thermal runaway in an improved EIS-based technique. Two stages were exploited from the abnormal cell internal temperature rise stage and well before the abrupt temperature rise stage. Three indicators were derived from the EIS in three frequency ranges: intermediate-frequency, low-frequency, and high-frequency. Three indicators included the sensitivity of EIS to cell internal temperature indicator at intermediate-frequency (SEN-T-IF), the sensitivity of EIS to cell deformation indicator at high-frequency (SEN-D-HF), and the sensitivity of EIS to cell deformation indicator at low-frequency (SEN-D-LF). After that, the field application of the reliable and early warning method was discussed, including measurements feasibility, versatility in various scenarios, and the difference between the experimental and actual situation.
Experimental
In our experiments, three kinds of fresh LIBs were used (Fig. 1a), including one pouch cell (LiNiCoMnO (NCM) 622/graphite, 3.24 Ah) and two cylindrical batteries (18650 liNiCoAlO (NCA)/Si-C (red), 3.4 Ah, and 18650 NCA/graphite (green), 3.3 Ah). The state of charge (SOC) of these new batteries was adjusted to 100% using a MACCOR Series 4000 in an environment chamber GDJW-225 (Yashilin, Beijing, China), which was set to 25 °C. The cells were transferred to the ARC equipment (Thermal Hazard Technology (THT), UK) shown in Fig. 1c. All the experimental devices were assembled according to the schematic (Fig. 1b).
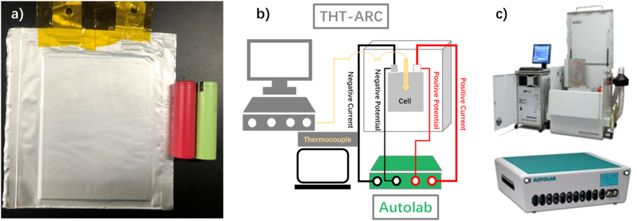
Figure 1. (a) Photo of batteries, (b) the experimental schematic and (c) the equipment. Three types of batteries (one pouch cell, NCM622/graphite, 3.24 Ah, and two cylindrical cells, red 18650 battery, NCA/Si-C, 3.4 Ah and green 18650 battery, NCA/graphite, 3.3 Ah), the experimental schematic for ARC and EIS, and the devices including EV-ARC (made by THT) and Autolab (made by Metrohm).
Download figure:
Standard image High-resolution imageARC equipment was used to manage the cell temperature according to the heating-waiting-seeking-tracking program. The starting temperature was 25 °C. The temperature was raised in a stepwise manner by 10 °C. The heating stage was followed by a waiting period of 60 min for equilibration and the EIS measurement. Then, another period of 10 min was set for searching, and the self-heating rate threshold was 0.02 °C·min−1. If the temperature rising rate surpassed the threshold during the searching period, the equipment management system tracked the temperature. If the temperature was under the heating rate threshold 0.02 °C·min−1 or there was no temperature rising, a new temperature stage was carried out. The system shutdown criteria were executed when the temperature was over 450 °C or the operating mode changed to cool down. In the whole ARC testing process, the temperature of the LIB went through several stages, including rising, holding and decreasing.
EIS measurements were conducted during the ARC measurement. The EIS was carried out in the potentiostatic mode with the Autolab PGSTAT30 (METROHM) shown in Fig. 1c. The frequency range was from 0.1 (10−1) Hz to 10000 (104) Hz. The amplitude of the perturbation voltage was set at 5 mV. The 10 frequency points per decade (100.1) were sampled. There was a 15 min time interval between the two EIS. The Autolab workstation was introduced to obtain continuous EIS results. With the temperature rise, a series of EIS results were obtained.
Results and Discussion
EIS and ARC results
Figure 2 shows the results of ARC and EIS measurements of fresh batteries at 100% SOC, including a pouch cell (NCM622/graphite), a 18650 (NCA/Si-C) battery and a 18650 (NCA/graphite) battery. There are noticeable differences between the pouch cell and cylindrical batteries for the ARC results in Figs. 2a, 2c, 2e. Both the self-heating onset temperature (Ton) and internal short circuit temperature of three batteries are listed in Table I. The internal short circuit temperature of 18650 batteries is lower than the temperature of the pouch cell. This difference can be ascribed to mechanical pressure. In the thermal runaway process, the battery swells due to the vaporization of solvent. Higher mechanical pressure hinders the battery swelling and facilitates the internal short circuit. The cylindrical batteries are confined with steel cases, which withstand higher mechanical pressure. Another striking difference is the time interval (Δt) between the internal short circuit and thermal runaway (Table I). The Δt depends on the internal short circuit temperature and the energy of the battery. The Δt of the NCA/Si-C battery (≈4.9 h) is shorter than the NCA/graphite battery (≈8.1 h) due to the energy difference between the two batteries. Pouch cells have a higher internal short circuit temperature. Therefore, they have a faster reaction rate and a short Δt (≈10 min).

Figure 2. Experimental results of ARC measurements and EIS measurements for fresh pouch cell (a), (b), red 18650 battery NCA/Si-C (c), (d) and green 18650 battery NCA/graphite (e), (f). (a) (c) (e) temperature and voltage changing with time in ARC; (b) (d) (f) Nyquist plots changing with temperature.
Download figure:
Standard image High-resolution imageTable I. Three parameters, Ton, internal short circuit temperature and Δt, from ARC results of three types of batteries.
| Batteries | Ton | Internal short circuit temperature (°C) | Δt (min) |
|---|---|---|---|
| Pouch cell (NCM622/graphite) | 97.9 | 161.5 | 10 ∼ 20 |
| 18650 battery (NCA/Si-C) | 68.1 | 101.6 | 200 ∼ 300 |
| 18650 battery (NCA/graphite) | 77.7 | 101.0 | 400 ∼ 500 |
The Nyquist plots of EIS during the ARC test are shown in Figs. 2b, 2d, 2f. With the temperature rise, the larger semicircle in Nyquist plots decreases significantly. The whole impedance spectrum shifts to the left, indicating a decrease in impedance. The turning point comes when the temperature arrives at 55 °C for the pouch cell. The impedance contribution from Ohmic resistance is minimum at this temperature. The whole impedance spectrum shifts to the right, indicating an increase in impedance. When the temperature is higher than 83 °C for the pouch cell, the whole spectrum migration become apparent. Similar trends are obtained from the other two 18650 batteries. This phenomenon depends on the electrolyte amount. The electrolyte is consumed to react and form new SEI at this temperature. When the temperature is higher, the Nyquist plots get messy (Fig. S1 available online at stacks.iop.org/JES/168/090529/mmedia) due to the strong reaction in the battery. The phase angle-frequency Bode plots changing with temperature of three batteries are shown in Fig. S2. They are roughly divided into three frequency ranges based on the temperature sensitivity: low-frequency, intermediate-frequency and high-frequency. Phase angle in both low-frequency and high-frequency ranges remain unchanged at different temperatures. Phase angle in the intermediate-frequency range shows a high sensitivity to cell internal temperature. As the temperature increases, the phase angle in intermediate-frequency converges. The change of phase angle-frequency curves with temperature could be explained by the Ref. 27. Firstly, phase angle results from the phase difference between the voltage signal and current signal. There is a time constant of an interfacial electrochemical process. The peak in intermediate-frequency is depressed. The Ohmic resistance is considerably larger than resistance in the resistance-capacitance (RC) equivalent circuit. On the other hand, considering the mathematical analysis, the phase shift could be obtained from Eq. 1 in Ref. 25:

The magnitude of phase angle approaches 0. From the Nyquist plots (Figs. 2b, 2d, 2f), the angle in the frequency gradually shrink or the imaginary part decreases. These results are reproducible in the other two types of 18650 batteries.
Early warning indicators
As evident in Fig. 3a, the Nyquist plot can be divided into three frequency ranges: intermediate-frequency, high-frequency and low-frequency based on the temperature sensitivity difference. Three warning indicators are derived, including SEN-T-IF, SEN-D-HF and SEN-D-LF. The low-frequency results (Warburg) and the high-frequency results (inductance) could be separated. Intermediate-frequency is selected by fitting the parameters. The EIS in different SOC are examined for pouch cell to determine the intermediate-frequency, as shown in Fig. 3b. The equivalent circuit model is used to fit the EIS results (Fig. S3a). The fitting results are shown in supporting information (Figs. S3b–S3d), including QC1, nC1 and RC1. Three fitting parameters represented the SEI impedance show SOC insensitivity. EIS in the intermediate-frequency are insensitive to SOC. The inset of Fig. 3b shows insensitivity to SOC in the frequency range 30 ∼ 500 Hz. The intermediate-frequency has the highest sensitivity to internal cell temperature (Fig. S2). Similar results were presented in reference 25 that the impedance was insensitive to the SOC in the frequency range 30 Hz ∼ 1 kHz.
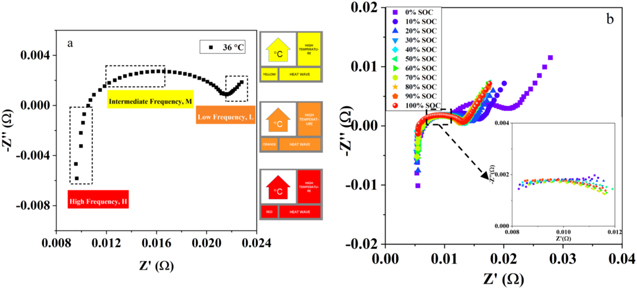
Figure 3. EIS and fitting results based on the equivalent circuit model. (a) Nyquist plot is divided into three frequency ranges: intermediate-frequency (yellow), low-frequency (orange), high-frequency (red); (b) EIS results in different SOC for pouch cell (NCM622/graphite) and the EIS results at 30 ∼ 500 Hz in different SOC (inset).
Download figure:
Standard image High-resolution imageIntermediate-frequency analysis
The first early warning stage is derived from the intermediate-frequency range for abnormal temperature rise. The phase angle at 31.62 (101.5) Hz is selected to analyze the relationship with temperature. The phase angle at 31.62 Hz changing with temperature is shown in Figs. 4a–4c. When the temperature is higher than a specific temperature, the phase angle converges to one value and it also means that the curve changes to be a straight line. By fitting the curves of the higher temperature, a turning point is obtained based on the 5% standard deviation confidence interval. Additionally, the early warning temperature is fitted (labeled in the blue box). The SEN-T-IF indicator is obtained before the self-heating onset temperature. Based on the relationship between phase angle and temperature, the state of the battery could be detected before the self-heating stage. Applying the SEN-T-IF, the early warning signal can be issued to activate the batteries thermal management system (BTMS) to cool the battery temperature. This early warning method can reversibly handle battery status from the edge of danger.
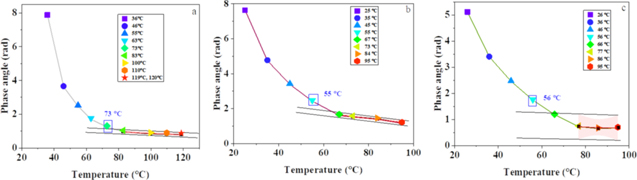
Figure 4. The SEN-T-IF derived from the changes of phase angle with temperature at 31.62 Hz for three types of batteries in (a) (b) (c), and the early warning temperature are linearly fitted based on the 5% confidence interval. (a) pouch cell (NCM622/graphite), (b) cylindrical 18650 (NCA/Si-C) battery, (c) cylindrical 18650 (NCA/graphite) battery.
Download figure:
Standard image High-resolution imageHigh-frequency analysis
EIS results in the high-frequency range are used for the second stage warning. Complementally, Huang et al. 28 exerted a graphical fitting method to analyze the high-frequency EIS results and attain the inductive impedance. The inductive effect was believed to arise from the metallic elements in the cell and the wires connecting the cell and the device. The constant phase elements (CPE) in the equivalent circuit model (Fig. S3a) are employed to fit the inductive impedance in the high-frequency range. The fitting results show that the QL is almost constant in all three types of batteries (Figs. S4a–S4c). The RL in Fig. S4d decreases with increasing temperature in the pouch cell. The RL is insensitive to the temperature in the other two types of batteries (Figs. S4e, S4f). It can be explained by the difference in the structure and the confining pressure for pouch cells and cylindrical batteries.
Furtherly, the EIS results at the high-frequency range are fitted by the arc fitting method and displayed in Fig. 5, including primitive results (symbol) and fitting results (dot). The 1 ∼ 10 kHz result is selected to analyze the early warning indicator, SEN-D-HF. The impedance profiles start to get messy at higher temperature due to the cell deformation. EIS results of pouch cells are accurately and stably measured at the lower temperature, 36 ∼ 120 °C (Fig. 5a). These results are fitted well. When the temperature exceeds 121 °C inste Fig. 5a, the EIS gets messy (Fig. S1). In addition, there is a significant difference between the two figures for cylindrical batteries (Figs. 5b and 5c). These results provids a fresh insight into early warning of battery safety at the higher temperature.
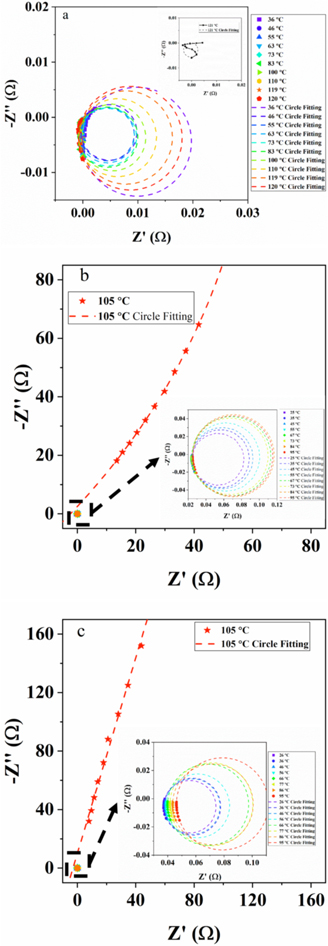
Figure 5. SEN-D-HF derived from high-frequency EIS results which are fitted by arc fitting method, including the primitive curve (symbol) and the fitting circle (dot), (a) pouch cell (NCM622/graphite), (b) red 18650 battery (NCA/Si-C), (c) green 18650 battery (NCA/graphite).
Download figure:
Standard image High-resolution imageEquation 2 is applied to quantify the error between the measurement results and the fitting results. The schematic for the fitting error explanation is displayed in Fig. 6a. There are two fitting error variables, R and ri, the fitting circle radius and the width between the measurement points and the fitting circle center. All the fitting errors at different temperatures are calculated according to the Eq. 2 and marked in Fig. 6b for pouch cells. A sudden increase exists in the results when the temperature exceeds 120 °C. Simultaneously, EIS results are disorganized at this temperature. The sudden increase from fitting error is single out as the SEN-D-HF to alarm safety of battery. Importantly, this signal is before the internal short circuit signal.

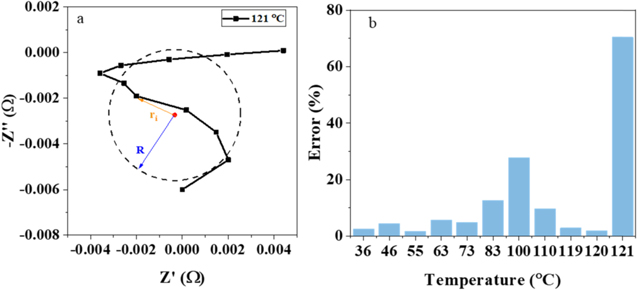
Figure 6. The high-frequency EIS results were fitted by arc fitting method, (a) schematic of the error calculation; (b) fitting error at different temperature.
Download figure:
Standard image High-resolution imageLow-frequency analysis
The low-frequency range is also used for the second warning stage in Fig. 3a. This part considers the deviation of the low-frequency impedance from the Warburg impedance. The parameter R2 (coefficient of determination, COD), defined as the fitting error, is obtained from the linear fitting method. The EIS results in the low-frequency range and corresponding fitting curves for the pouch cell are marked in Fig. 7a. When the temperature is lower than 120 °C, all the EIS results in the low-frequency range could be fitted well. The fitting line slope shows a clear trend, increasing firstly and then decreasing. This phenomenon could be explained by the Li+ diffusion in solid and electrolyte phases. The diffusion coefficient of electrolyte (≈10−6 m2·s−1) 29 is a function of concentration and temperature. The solid diffusion coefficient (≈10−13 m2·s−1) 30,31 is a function of insertion ratio and temperature. Generally, the 45° line in the low-frequency range represents the solid diffusion. When it deviates from 45°, the electrolyte diffusion interference becomes an influencing factor. Figure 7a shows that the 45° line deviates with the temperature rise. It means that the electrolyte diffusion coefficient influences the process in the low-frequency range. 32 With the temperature rise, both electrolyte and solid diffusion coefficients increase. The diffusion coefficient in the electrolyte decreases due to the consumption of electrolyte in the thermal runaway process. The EIS could not obtain a stable signal from the battery because of the internal strong reaction with the vaporization of solvent. The vaporization of solvent result in the cell deformation and electrolyte concentration changing when the temperature exceeds 120 °C. So the low frequency deviation can be indicated by the cell deformation. The R2 decreases from 1 to 0.4. What is more, the low-frequency impedance points deviate away from the Warburg impedance. The deviation is used as an early warning indicator, SEN-D-LF. The temperature of SEN-D-LF is higher than the self-heating onset temperature and lower than the thermal runaway onset temperature. The SEN-D-LF appears before the internal short circuit temperature. When the system detects the early warning signal, the alarm is sent to BTMS to cool the cell.

Figure 7. SEN-D-LF derived from EIS results in low-frequency range from different temperature of three types batteries, (a) (b) pouch cell (NCM622/graphite), (c) (d) red 18650 battery (NCA/Si-C), (e) (f) green 18650 battery (NCA/graphite). (a) (c) (e) EIS results and fitting results; (b) (d) (f) the same as to (a) (c) (e) and supplement the higher temperature EIS results and fitting results, the fitting curve slope and R2 (coefficient of determination) change with temperature laid inset of figure (b) (d) (f).
Download figure:
Standard image High-resolution imageSimilar trends and conclusions could be obtained from the other two types of cylindrical batteries (Figs. 7c–7f). The impedance at low-frequency deviates significantly from the Warburg impedance in Figs. 7c, 7e in the higher temperature. The stable measurement results are zoomed in the Figs. 7c, 7e. Furthermore, the SEN-D-LF is determined by analyzing the slope and COD in the fitting results (Figs. 7d, 7f).
EIS-based, two-staged, three indicator method for reliable and early warning
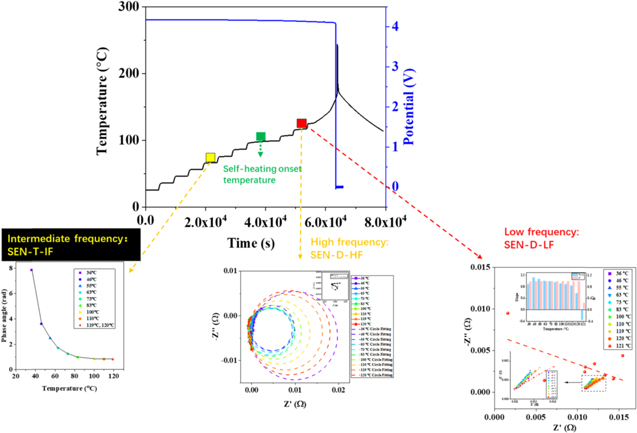
An integrated method for the reliable and early warning of thermal runaway is constructed and depicted in Fig. 8. It consists of two stages and three indicators. According to the temperature difference, the two stages include the abnormal cell internal temperature rise stage and before the abrupt temperature rise stage. Three early warning indicators are obtained based on the sensitivity to the temperature and deformation. Specifically, the first stage utilizes the SEN-T-IF before the self-heating stage. The second stage utilizes the SEN-D-HF and SEN-D-LF, which is earlier than internal short circuit temperature and thermal runaway onset temperature. The temperature sequence of three indicators is SEN-T-IF < SEN-D-HF ≈ SEN-D-LF.
Figure 8. Combining all the steps in the previous sections, the EIS-derived indicators in the intermediate-frequency, low-frequency and high-frequency are used to give reliable and early warning of thermal runaway. SEN-T-IF from intermediate-frequency range is sensitive to cell internal temperature and used for the first stage. SEN-D-HF and SEN-D-LF are sensitive to the cell deformation and used for the second stage early warning.
Download figure:
Standard image High-resolution image
Application analysis
In the laboratory, Autolab is used to obtain the multi-frequency AC-impedance in the mHz∼kHz frequency range. However, the multi-frequency impedance meters are large in the size and weight and high in cost and power-consumption. A few papers reported that BMS was able to monitor internal impedance in the multiple frequency ranges. Carkhuff et al. 33 had developed a battery internal temperature sensor-based battery management system (BITS-BMS). They demonstrated a small-size (10 × 1 cm), low-power (6 V, 0.75 A, DC), standalone BMS enabled by a multi-frequency (1 ∼ 1000 Hz) impedance meter. The multi-frequency impedance can monitor the two-staged temperature. The reliable and early warning of the thermal runaway method is feasible for BMS.
Considering the application scenarios of batteries, resting or charging-discharging, the different frequency ranges are selected for the reliable and early warning of thermal runaway. For the intermediate-frequency and high-frequency ranges, they take a few seconds to measure (intermediate-frequency, 0.03162 s (1/101.5 s), high-frequency, 0.002051 s (summation (1/104 ∼ 1/103.3 s)). SEN-T-IF and SEN-D-HF could be obtained in both resting and charging-discharging scenarios of batteries. Instead, low-frequency range takes about 44.76 s (summation (1/10−1 ∼ 1/100 s)). SEN-D-LF could be detected in the resting scenario. The developed method is applied to various scenarios.
Thermal runaway accidents in the actual situation are analyzed. A published paper reported that it took about 720 s to heat the battery temperature from room temperature to thermal runaway. The battery was heated by an external heat source. The reliable and early warning method could detect the indicators of thermal runaway before the potential drop. This method leaves more time for prevention and helps to escape from thermal runaway accidents.
Conclusions
This study first exposes the inadequacies in the reliability and leading time of previous methods to warn lithium ion battery thermal runaway. Exploiting the sensitivity of EIS to cell temperature and deformation, we develop a two-staged, three-indicators (SEN-T-IF, SEN-D-HF, SEN-D-LF) method for reliable and early warning. The first stage utilizes the EIS in the intermediate-frequency range and gives SEN-T-IF indicator before the self-heating temperature stage. The second stage utilizes the EIS in both high- and low-frequency ranges and gives SEN-D-HF and SEN-D-LF indicators. ARC results show that the SEN-D-HF and SEN-D-LF can warn earlier than internal short circuit temperature and thermal runaway onset temperature. Field application analysis shows that the developed method can be used in BMS to warn of thermal runaway accidents. When the battery is under resting, three indicators can be used for warning. When the battery is under charging or discharging, the SEN-T-IF and SEN-D-HF can be used for warning.
Acknowledgments
This work is supported by the National Key R&D Program of China under the grant number of 2018YFB0105903.