
Abstract
Nickel layered double hydroxide, Ni(OH)2, has been widely used as the cathode for nickel based battery systems. However, the currently commercialized β-Ni(OH)2 is limited by its low capacity. In contrast, α-Ni(OH)2 can give higher capacity, but it is challenging to stabilize in alkaline solution due to the conversion to β-Ni(OH)2. Herein, we use zinc doped Ni(OH)2 and control its spherical morphology to strengthen the stability of α-Ni(OH)2 in a nickel metal hydride battery system. With an optimal zinc doping content of 3 mol% for the spherical α-Ni(OH)2 (Ni-Zn3), the cathode shows the highest discharge capacity of 351.3 mAh g–1 at a current density of 70 mA g–1 (0.2 C) and superior rate performance, which even delivers 271.5 mAh g–1 at 5 C. More importantly, the durability of the Ni-Zn3 cathode is significantly enhanced, which maintains 81.7% after cycling 360 times, almost twice as long as that of pure α-Ni(OH)2. Studies show that the stabilized Ni–O bond and suitable aperture structure are mainly responsible for the advanced electrochemical properties of the Ni-Zn3. The results show that proper zinc doping spherical α-Ni(OH)2 with low-cost and high performance is an promising cathode material for nickel-based battery systems.
Export citation and abstract BibTeX RIS

This is an open access article distributed under the terms of the Creative Commons Attribution 4.0 License (CC BY, http://creativecommons.org/licenses/by/4.0/), which permits unrestricted reuse of the work in any medium, provided the original work is properly cited.
The present energy-storage technology has been rapidly developing due to the rising environmental concerns and necessity to reduce the usage of fossil fuels. 1 To date, as a chemical energy storage and conversion technology, Lithium-ion batteries (LIB) dominate the market owing to their light weight, high energy density, and extended cycle life. 2–5 However, the flammable nature of their liquid electrolyte presents many safety hazards and economic challenges that render them less suitable for some applications. 6–8
On the other hand, the family of nickel-based batteries stands out in decades and still perceives as tougher, because many of them can operate longer life, handle higher or lower temperature extremes, economically priced, etc. Nickel-based batteries, including nickel-cadmium (Ni/Cd), nickel-iron (Ni/Fe), nickel-zinc (Ni/Zn), nickel hydrogen (Ni/H), and nickel metal hydride (Ni/MH) batteries, 9–17 are similar in the way that nickel hydroxide material, Ni(OH)2, are utilized as the cathode in the chemistry, 18 therefore, the electrochemical property of Ni(OH)2 is of great importance. Ni(OH)2 includes two types, α-Ni(OH)2 19–25 and β-Ni(OH)2, 26–29 which can respectively transform into γ-NiOOH and β-NiOOH during charge and discharge processes in alkaline solution according to the bode mechanism (Fig. 1). The transformation of β-Ni(OH)2/β-NiOOH electrode gives only 1 mol electronic with a theoretical capacity of 289 mAh g–1, whereas the theoretical capacity of α-Ni(OH)2/γ-NiOOH electrode achieves to 482 mAh g–1 with 1.67 mol electronic shift. Moreover, α-Ni(OH)2 has a layer spacing structure, which could avoid the big volume swell as that of the β-Ni(OH)2/β-NiOOH, thus inhibiting the battery leakage. Therefore, α-Ni(OH)2 are considered as a more promising commercial replacement of the cathode for nickel-based batteries. Nonetheless, the instability of α-Ni(OH)2 in alkaline solution and its smaller density limits its further development, especially for the large-scale nickel metal hydride (Ni/MH) batteries.
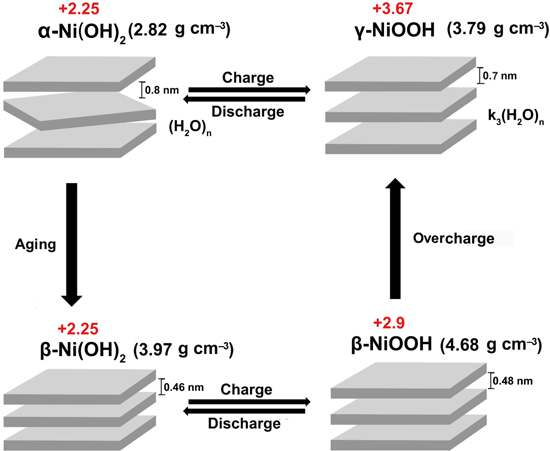
Figure 1. Bode cyclic graph of crystalline structure transition of Ni(OH)2/NiOOH at different circumstances.
Download figure:
Standard image High-resolution imageIn recent years, massive efforts have been implemented to improve the electrochemical properties of α-Ni(OH)2. For example, doping different metal ions (e.g. Al3+, Co2+, Cr3+, Mn2+) has been used to improve the stability and capacity of α-Ni(OH)2, and physically mixing or coating other substances (e.g. active carbon, carbon nanotubes, CoO and Co(OH)2) has been utilized to enhance its rate performance via increasing the electrical conductivity. 30–36 Wang et al. reported that 16 mol% Al doped α-Ni(OH)2 has stable crystal structure and excellent cycling performance in Ni/MH batteries, which exhibits a large specific capacity of 457.9 mAh g–1 at a current density of 500 mAh g–1 and keeps 87.0% of the initial capacity after 2000 cycles. 30 Liu et al. found that Co doped α-Ni(OH)2 exhibits a high specific capacity, which gives a specific capacitance of 2879.76 F g–1 at a current density of 1 A g–1 compared to 350 F g–1 for the pure α-Ni(OH)2, and a high capacitance retention rate of 85%. 34 Xia's group studied the effects of Co and CoO on the performance of α-Ni(OH)2 electrode, and their studies show that Co and CoO can transform into Co2O3 and CoOOH during charge and discharge, which maintain the stability and electrical conductivity of the α-Ni(OH)2, thus improving its electrochemical performance. 37 Shang et al. showed that Co-Al-layered double hydroxide nanosheets-coated spherical nickel hydroxide has enhanced high-rate and cycling performance. 31
In this paper, we use zinc to stabilize α-Ni(OH)2 in terms of the closing radius and the outweighing electronegativity (1.65), which are able to enter and replace the nickel easily in the nickel hydroxide crystal lattice and strengthen the chemical bonding between O and Ni in nickel hydroxide lattice. A series of zinc doped α-Ni(OH)2 have been synthesized by a hydrothermal method and tested as the cathode in the Ni/MH battery system, and the crystal morphology and electrochemical properties with different zinc contents have been studied, where the results show that zinc doped spherical α-Ni(OH)2 possesses more uniform particle size and stabilized Ni–O bond, which benefits to the discharge ability and stability.
Experimental
Materials
Nickel(II) nitrate hexahydrate (Ni(NO3)2·6H2O), zinc(II) nitrate hexahydrate (Zn(NO3)2·6H2O), urea (CH4N2O), sodium hydroxide (NaOH), Polytetrafluoroethylene preparation (PTFE, 60 wt%), carbonyl nickel powder were purchased from Aladdin with AR grade. The metal hydride (MH) with a chemical formula of La0.65Sm0.10Nd0.05Mg0.20Ni3.54Al0.16 is used as the anode for the Ni/MH battery.
Synthesis of zinc doped spherical α-Ni(OH)2
Zinc doped spherical α-Ni(OH)2 was prepared by a one-step hydrothermal method. Briefly, 4.36 g Ni(NO3)2·6H2O, 2.25 g urea and a certain amount of Zn(NO3)2·6H2O were dispersed in 150 mL deionized water by ultrasonic. After that, the solution was transferred into a 200 mL Teflon-lined stainless-steel autoclave. The sealed autoclave was heated to 160 °C for 8 h. Finally, the sample was collected by centrifugation and washed with water and ethanol until neutral. The sample was dried in a vacuum oven at 60 °C for 8 h. To get the zinc doped spherical α-Ni(OH)2 samples with different Zn doping contents in mole percent (0%, 1%, 3%, 5% and 7%), the above proportion of Zn(NO3)2·6H2O and Ni(NO3)2·6H2O was controlled and afterwards named as Ni-Zn0, Ni-Zn1, Ni-Zn3, Ni-Zn5 and Ni-Zn7, respectively.
Sample characterization
X-ray diffraction (XRD) analysis was performed using D/max-2500/pc with Cu Kα radiation to determine the crystal structure of samples. The microstructure morphology was characterized by scanning electron microscopy (SEM, HITACHI S-4800) and transmission electron microscopy (TEM, HT7700). The specific surface area and pore size distribution of the sample was analyzed by Brunauer-Emmett-Teller (BET) on NOVA 4000. FTIR test was performed on E55+FRA10. Thermal Gravimetric Analyzer (TGA) test was carried out to identify the quality change on BOEN-021101. The composition and state of the surface elements of the sample were analyzed by X-ray photoelectron microscopy (XPS, Thermo Fisher K-Alpha).
Electrochemical measurement
The zinc doped spherical α-Ni(OH)2 active material, expanded graphite, carbonyl nickel powder and 60 wt% of PTFE were mixed in a mass ratio of 7:1:1:1, evenly coated on nickel foam with a size of 1 × 1 cm2 and pressed into an electrode under 10 MPa after covered by another nickel foam with a same specification. The mass of the active material is ∼0.3 g. To ensure that the active material can be fully utilized during charging and discharging processes, the mass of the positive material is ten times higher than that of the negative electrode material. The electrode was soaked in 6 mol L–1 KOH solution for 24 h to ensure good contact with the electrolyte. Cyclic voltammetry (CV) and electrochemical impedance spectroscopy (EIS) were tested by an electrochemical workstation (CHI660E) using a three-electrode system, where a platinum electrode was used as the counter electrode, and Hg/HgO as the reference electrode except for the above prepared electrode as the working electrode. The galvanostatic charge-discharge (GCD) test was carried out on a LAND-CT2001A instrument at 25 ± 1 °C using a two-electrode system, where the MH alloy used as the anode and the above prepared electrode as the cathode.
Results and Discussion
Materials characterization
Figure 2 shows the SEM images of nickel layered double hydroxide with different contents of zinc doping at different magnifications. The morphologies of the samples are all with a spherical structure, where the particle size of the spherical samples exhibits around 5–10 μm (Figs. 2a1–2e2) composing nano-size crystals (Figs. 2a2–2e3), in which Ni-Zn3 presents the highest uniformity, as confirmed by the TEM image in Fig. 3. The EDS elemental mapping shows that the Ni, O and Zn are homogeneously distributed in the spherical structure (Figs. 3f–3h), which also indicates that Zn has been uniformly inserted into the lattice. The molar ratio of Zn and Ni in the Ni-Zn3 is 0.51: 17.1, which is in line with the ratio of reactants (Fig. S1 and Table SI (available online at stacks.iop.org/JES/168/070539/mmedia)). Moreover, zinc doping changes the microscopic structure of the sample from nanorod to nanosheet at the edges (Figs. 3b and 3d). The surface becomes relatively denser with the increasing zinc doping content and the pore diameter on the surface decreases. The compactness and pore diameter affect the electrochemical performance significantly, that it reduces the density if the pore diameter is too large, whereas it hinders the charge transmission if too dense. BET shows that the pore size of the Ni-Zn3 distributes around 34.39 nm with a specific area of 212 m2 g–1 (Fig. S2). As for the Ni-Zn3, the appropriate pore distribution and larger contact area with electrolyte will be in favor of an excellent charge conductivity and proton and charge transfer performance, benefiting the rate performance of the assembled battery (details discussed later).
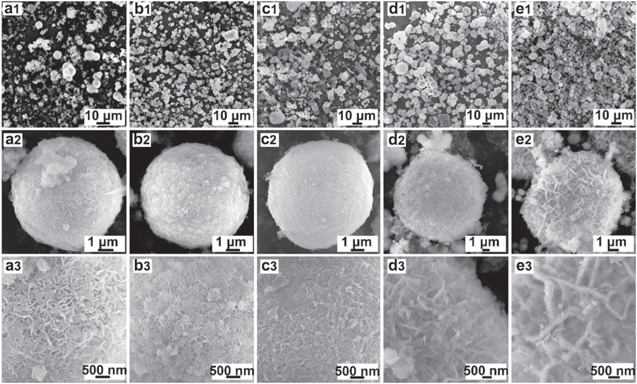
Figure 2. SEM images of zinc doped spherical samples: (a1)–(a3) Ni-Zn0, (b1)–(b3) Ni-Zn1, (c1)–(c3) Ni-Zn3, (d1)–(d3) Ni-Zn5 and (e1)–(e3) Ni-Zn7.
Download figure:
Standard image High-resolution image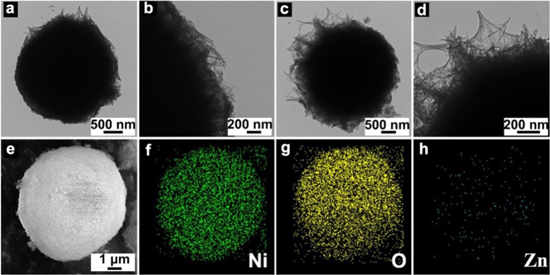
Figure 3. TEM images of zinc doped spherical samples: (a)–(b) Ni-Zn0 and (c)–(e) Ni-Zn3. EDS mapping including Ni (f), O (g), and Zn (g) of Ni-Zn3.
Download figure:
Standard image High-resolution imageXRD patterns show that the zinc doped spherical samples are with α-Ni(OH)2 (JCDPS No. 38-0715) structure, which are all dominated by the (003) reflection at a 2θ of ∼11°, indicating a high degree of growth in the preferred orientation, alone with the planes of (006), (101) and (110) at 22.18°, 34.44° and 60.36° (Fig. 4a). No impurity structure related to zinc compounds is observed for all the samples, confirming that Zn2+ has been successfully introduced in the crystal lattice of the α-Ni(OH)2 combining the ICP results. Besides, in contrast to the pure α-Ni(OH)2, we observed a right shift of (003) to ∼12.4° for the Ni-Zn7 sample, which is due to the smaller radius of zinc atom. Besides, according to the Bragg equation (2dsinθ = λ), the interlayer spacing of all samples with zinc were calculated to be approximately 0.72 nm, which is in line with the theoretical interlayer (0.7–0.8 nm) of α-Ni(OH)2.

Figure 4. (a) XRD patterns of spherical α-Ni(OH)2 with different zinc doping contents, XPS spectrums of (b) Ni 2p and (c) Zn 2p of Ni-Zn3, (d) TG curve of Ni-Zn0 and Ni-Zn3, (e) DTA curve of Ni-Zn0 and Ni-Zn3, and (f) FTIR curve of Ni-Zn0 and Ni-Zn3.
Download figure:
Standard image High-resolution imageIn order to study the chemical states of zinc doped spherical α-Ni(OH)2, Ni-Zn3 was further examined and analyzed by XPS measurement. Fig. 4b shows that the Ni2+ characteristic in the Ni-Zn3, where two major peaks at 855.7 eV and 873.4 eV with a corresponding horizontal coordinate difference of 17.3 eV corresponds to Ni 2p1/2 and Ni 2p3/2. 38 As for Zn 2p spectrum (Fig. 4c), the major peaks at 1021.4 eV and 1044.7 eV corresponds to Zn 2p3/2 and Zn 2p1/2, respectively, suggesting the presence of Zn2+ in the material.
Unlike β-Ni(OH)2, α-Ni(OH)2 contains a large amount of water molecules inside the interlamellar spacing, 39 thus the presence of H2O molecule can greatly drop Ni content at a same quality of β-Ni(OH)2. TG and DTA curves reveal that the number of lattice water in the structure of Ni-Zn3 is higher than that of Ni-Zn0 in the range of 25 °C to 230 °C (Figs. 4d–4e). While, the significant mass loss from 250 °C to 420 °C indicates the transformation of α-Ni(OH)2 crystal into NiO crystal. 20 The final content of Ni-Zn3 and Ni-Zn0 are 63.5 wt% and 68.9 wt%, respectively, proving that zinc doping reduces the content of Ni. Moreover, using zinc compound as raw materials compared with Ni compound can reduce the cost in the synthesis process.
FTIR was carried out to determine other ions inside the layer spacing of the α-Ni(OH)2. As shown in Fig. 4f, we observe M–O (including Ni–O and Zn–O), NO3 – and NCO– stretching vibrations at 600 cm–1, 1383 cm–1 and 2220 cm–1 respectively. The NCO– is generated by the decomposition of urea with NH4 + as the other product. Moreover, compared with Ni–Zn0, the stretching vibrational mode of M–O of Ni–Zn3 sample shows a blue shift, indicating that zinc enhances the binding energy of the Ni–O bond by forming Zn–O chemical bond.
Electrochemical measurements
Fig. 5a displays the cyclic voltammetry (CV) of the zinc doped spherical α-Ni(OH)2 electrode between –0.1 V and 0.7 V vs Hg/HgO at a scan rate of 0.2 mV g–1. There is one pair of redox peak, which is the characteristic of the following Faradic reaction of α-Ni(OH)2: 38


Figure 5. (a) CV curves of spherical α-Ni(OH)2 with different zinc doping contents at a scan rate of 2 mV s–1, (b) Typical discharge curves of the spherical α-Ni(OH)2 at 0.2 C (1 C = 350 mA g–1), (c) Rate performance of different zinc doped spherical α-Ni(OH)2 at various discharge rates (0.2 C–5 C), (e) Cyclic performance of the spherical α-Ni(OH)2 at 1 C, (f) Cycle diagram of Ni-Zn3 at 1 C.
Download figure:
Standard image High-resolution imageBased on the redox peak, the electrochemical reversibility, which can be expressed by the potential difference (Δ(EO-R)) between the oxidation and reduction peaks, are obtained in Table SII. The redox peak of the Ni-Zn3, located at ∼0.499 V/0.184 V, gives the smallest Δ(EO-R), which is 0.315 mV, much lower than the other samples, indicating that proper zinc doping has increased the electrochemical reversibility. Fig. 5b shows the charge/discharge curves of the zinc doped spherical α-Ni(OH)2 at a current density of 70 mA g–1 (0.2 C). The Ni-Zn3 exhibits the highest discharge capacity, which is 351.8 mAh g–1. Different from the pure spherical α-Ni(OH)2, all the samples after zinc doping show elevated discharge voltage at 0.2 C from 1.18 V to 1.25 V. Besides, the Ni-Zn3 manifests excellent rate performance, where a considerable capacity of 271.5 mAh g–1 is attained at a high current rate of 5 C, as shown in Fig. 5c, and it can still recover to ∼350 mAh g–1 after the rate test. Moreover, the Ni-Zn3 remains the highest discharge voltage at high current rates, especially at the 4 C and 5 C (Fig. S3), because the addition of zinc improves the Ni–O bond and reduces the electrochemical polarization, thus strengthening the high rate performance of the electrode. For the evaluation of long-term cycling stability, the spherical α-Ni(OH)2 electrode is galvanostatically charged and discharged at 1 C. Remarkably, the Ni-Zn3 stands out with a capacity retention of 94.8% after cycling 220 times, and still retains 270.8 mAh g–1 after 360 times, which is 82.7% (Fig. 5d), indicating that Ni-Zn3 has excellent cyclability, higher than reported β-Ni(OH)2 nanosheet coating on 3D flower-like α-Ni(OH)2. 26 In addition, all the samples have gone through a period of electrode activation at the beginning of the cycles, during which the electrode capacity gradually rises and remains stable after reaching the highest discharge capacity. Fig. 5e shows that the relationship between the discharge capacity and the cycling time of the Ni-Zn3, where the trend of the discharge curve remains almost unchanged during a longer cycle, which also shows that the sample has good cycle performance. The prominent performance of Ni-Zn3 correlates its suitable pore size on the surface and propriate amount of zinc substitution, but it delays the proton and charge transmission process as the surface becomes denser and sharp reduction of the active substances for the Ni-Zn7.
To further understand the greatly enhanced rate discharge ability and cycle stability, the electrochemical kinetics of spherical α-Ni(OH)2 after zinc doping were studied in details. Figs. 6a and 6b show the CV curves of Ni-Zn0 and Ni-Zn3 at different scanning rates. If one assumes that the electrochemical reaction of nickel hydroxide electrode is controlled by proton transfer process, the current of CV obeys an Randles-Sevcik equation, 31 as expressed in the following formula:

where D is the diffusion coefficient, v is the scanning rate, C0 is the proton concentration, n is the electrons transferred number and A is the electrode surface area. The D value is positively related to the slope of the line, which can be fitted via the relationship between ip vs v1/2 (Fig. 6c). The D values based on the slopes for the anodic process are calculated to be 4.57 × 10⁻¹¹ cm2 s–1 and 7.32 × 10⁻¹¹ cm2 s–1 for the Ni-Zn0 and Ni-Zn3 electrodes, respectively, and they are 3.81 × 10⁻¹¹ cm2 s–1 and 7.09 × 10⁻¹¹ cm2 s–1 for the cathodic process for the Ni-Zn0 and Ni-Zn3 electrodes, respectively, illustrating the faster proton diffusion process in the Ni-Zn3 electrode.

Figure 6. CV curves of the (a) Ni-Zn0 and (b) Ni-Zn3, (c) Relationship between the redox peak current and the square root of scan rates for Ni-Zn0 and Ni-Zn3, (d) Nyquist plots of pure α-Ni(OH)2 and zinc doped spherical α-Ni(OH)2.
Download figure:
Standard image High-resolution image
Nickel hydroxide as the p-type semiconductor is with poor conductive ability. Therefore, in order to explore the effect of zinc doping on the electrical conductivity of the sample, the impedance tests were carried out for all samples. As shown in Fig. 6d, the Nyquist diagrams of the samples are made up of a curve and a straight line, which respectively represents the electron transfer impedance and the Warburg impedance. The fitting results show that the Rs values of samples are similar (Table S3), but the electron transfer impedance (Rct) follows the order of Ni-Zn3 (0.3799 Ω) < Ni-Zn1 (0.4155 Ω) < Ni-Zn5 (0.5032 Ω) < Ni-Zn7 (0.5198 Ω) < Ni-Zn0 (0.5324 Ω), which indicates that appropriate zinc doping can effectively reduce electron transfer impedance and Ni-Zn3 has a minimum of electron transfer impedance. This result is also consistent with the good oxidation peak in CV, where the Ni-Zn3 exhibits higher current peak and larger area at high scan rates, which confirm that the proper doping zinc can improve the α-Ni(OH)2 crystal structure and microstructure, making the sample being with more excellent electron transfer rate, and thus improving the electrochemical properties of the sample.
Conclusions
In conclusion, the zinc doped spherical α-Ni(OH)2 is superior to pure α-Ni(OH)2 in crystal morphology and the electrochemical properties. It is found that spherical α-Ni(OH)2 doped with 3 mol% of zinc (Ni-Zn3) shows advanced discharge capacity as high as 351.3 mAh g–1 at 0.2 C and retains 81.7% after cycling 360 times at 1 C. Moreover, the zinc doped spherical α-Ni(OH)2 exhibits excellent rate performance, a considerable capacity of 271.5 mAh g–1 is attained at a high current rate of 5 C. The improved electrochemical property can be attributed to the uniform spherical structure, showing high specific surface area and pore size distribution, which benefits the proton diffusion and electron transfer according to the electrochemical kinetics results. In summary, zinc doped spherical α-Ni(OH)2 can indeed be used as the cathode material of Ni/MH battery and can be promoted to other nickel-based systems.
Acknowledgments
This work was financially supported by the National Natural Science Foundation of China (Nos. 52071281 and 51971197) and the Natural Science Foundation of Hebei Province (Nos. E2019203414, E2020203081 and E2019203161).