

Abstract
To accelerate charging without rapid degradation, fast charging protocols that regulate stress are theoretically and experimentally investigated. In the stress-regulated protocol, the diffusion-induced stress within the active particle rapidly reaches a critical value in the early stage of charging and maintains that value throughout the charging process. To resolve the issue of the theoretically infinite current at the beginning of the stress-regulated protocol, a modified method that contains an initial constant-current stage followed by a stress-regulated stage is proposed. The key parameters are identified from the governing equation and can be easily obtained via constant-current charging tests. The modeling and experimental results collectively suggest that the proposed protocol considerably shortens the charging process (10%–20% compared with the referenced constant-current protocol) without sacrificing cycling stability and capacity utilization. The proposed protocol appears superior to other fast charging protocols (including high-rate constant-current charging, boost charging, and exponential current charging) in achieving a balance of charging speed and cycling performance.
Export citation and abstract BibTeX RIS
Lithium-ion batteries (LIBs) have been widely employed in various types of devices, owing to their high energy density, high power, lack of memory effects, and other advantages. 1–3 However, despite intensive efforts, faster charging of LIBs remains one of the most important challenges for practical application of LIBs in devices, especially in electric vehicles. Considering the long development cycle needed for new material systems for fast charging, the development of appropriate fast charging protocols for existing material systems has become urgent. 4
The constant-current (CC) constant-voltage (CV) charging method is the standard charging protocol for LIBs, 4–6 but simply increasing the charging current results in rapid battery degradation. 7–9 Using a higher charging rate in the CC step commonly leads to more rapid capacity fading. In the literature, numerous charging schemes, such as the pulse charging (PC) method, 5,10,11 the multistage constant current (MCC) method 5,12 and the boost charging (BC) method, 5,13 have been proposed to solve the problem of fast charging. Guo et al. further proposed a nonlinear time-varying current scheme in which the current varies with time continuously. 14 These charging schemes share a common goal—the acceleration of the charging process without compromising the cycling performance of batteries. However, the usability of these fast-charging methods remains questionable. Contradictory evaluations of fast charging protocols have been reported. 5,15–18 For instance, Keil et al. found that the impact of charging protocols (including CCCV, PC, CCPC and BC) on the cycle life is different for different LIB systems. 5 In addition, Zhang reported that the charging protocol (including CCCV, MCC and a constant power method) significantly affected the performance of LIBs, even at an identical average charging speed. 15 Resolving these issues requires understanding the dominant physical mechanisms of degradation during fast charging.
Upon fast charging, the battery degradation may be induced by many mechanisms, including lithium plating, 6,19 electrolyte degradation, 6,20 stress-induced failure in positive-electrode materials, 6,7,21–23 etc. Mechanical failure in cathode particles has been highlighted as one of the major degradation mechanisms upon fast charging, but has not been discussed comprehensively. 6,23,24 Stress-induced failure of individual particles has considerable impact on battery performance, affecting thermal, mass and electron transfer, 23,25–27 the capacity, 7,28 the voltage profile 28,29 and the lifetime 30–34 of LIBs. Meanwhile, the mechanical stress within the active material strongly depends on the charging schemes 35–37 with high-rate charging greatly increasing the risk of mechanical failure. 23,38 Xia et al. quantified the morphological outcomes of crack formation on cathode particles via advanced synchrotron X-ray tomography and clearly observed that more severe cracks occurred within cathode particles for higher charging rates. 23 Cracking leads to an uneven distribution of ions and electrons within the particles and causes more surfaces to come into contact with the electrolyte, which results in more severe side reactions that affect the battery performance. 23 Hence, the mechanical analysis of cathode particles should be an essential part of evaluating fast charging protocols.
In our previous work, we proposed analytical models for stress-limited fast charging methods, 39,40 in which the stress evolution, capacity utilization and charging speed were considered. Based on the theoretical analysis, modifications of the BC, 39 PC 11 and MCC 40 methods were provided, and a new method, the exponential current (EC) method 40 was introduced. Although all these proposed fast charging protocols can accelerate the charging process without sacrificing the capacity or increasing the risk of mechanical failures in theory, the potential optimization is still possible and experimental validations are lacked. 41 Furthermore, these proposed methods are modifications of standard CC charging procedures. Such CC charging procedures only need to be modified when rapid battery degradation is likely. Experimental verification of when more complex procedures should be used would also be valuable.
In the present study, by combining theoretical modeling and experimental validation, a mechanics-based design for fast charging protocols, which uses the governing condition of stress regulation (constant stress) is provided. A semi-analytical method (different from our previous analytical methods 11,39,40 ) of solving the governing integral equation to obtain the stress-regulated charging protocol is developed. The key dimensionless parameters for the stress-regulated charging protocol are identified and a method to relate the dimensionless parameters in the theoretical equations to the dimensional parameters measured in experiments is provided. In addition, the proposed stress-regulated charging procedure is tested by charging commercial LIBs and examining the effects on capacity retention and charging speed.
Theoretical Modeling
The composite electrodes in commercial LIBs are commonly composed of active particles, binders and conductive additives. 1–3 The mechanical behavior of the cathode particle upon fast charging is the main focus in this work. In general, faster charging leads to faster rise in diffusion-induced stresses (DISs). 35–39 High DISs within the active particle tend to fracture the active particle, causing battery degradation. To avoid rapid capacity fading upon fast charging, it is necessary to restrict the DISs.
To describe the evolution of DISs, a spherical, isotropic and elastic cathode particle with a radius R and spherically symmetric diffusion of lithium is considered in this work. When the boundary condition of radial stress  is satisfied, the radial and tangential DISs within the particle are
35,39
is satisfied, the radial and tangential DISs within the particle are
35,39
where  is the dimensionless stress (E is the Young's modulus, ν is the Poisson's ratio,
  is the partial molar volume, and
  is the saturation concentration);
  is the dimensionless concentration (c is the concentration of lithium within the active particle);
  represents the dimensionless average concentration of the spherical volume with radius r in the active particle (
 and
and  ); and
  represents the normalized amount of lithium within the active particle. The state of charge (SOC, or the normalized capacity) can be expressed as
  During charging, the maximum tensile stress commonly appears at the surface of positive particles,
35
and the fracture induced by this stress easily exposes the newly formed surfaces to the electrolyte, leading to battery degradation. Thus, the stress at the surface, denoted by
During charging, the maximum tensile stress commonly appears at the surface of positive particles,
35
and the fracture induced by this stress easily exposes the newly formed surfaces to the electrolyte, leading to battery degradation. Thus, the stress at the surface, denoted by  is the main focus in this study, and is given by

where  represents the dimensionless concentration at the surface of the active particle. Clearly,
  only depends on the amount of lithium
  and the surface concentration
Since the evolution of DIS is described above, it is necessary to take a look at the degradation and its relation to the stress. It has been frequently reported that when the CC charging rate exceeds a certain threshold (which is specific to each battery system), the capacity fading accelerates drastically.
19,42–44
Here we recall the expression of  under CC charging:
35,39
under CC charging:
35,39

where λn
are positive solutions of λn
cot(λn
) = 1,  is the dimensionless current density, i is the dimensional current density (where i < 0 indicates delithiation), F = 96485.3C mol−1 is the Faraday's constant, D is the diffusion coefficient of lithium and
  represents the dimensionless charging time. This linear relationship between
  and
and  under CC charging implies that the stress exceeds a critical value when the current of CC charging exceeds a critical value (the threshold mentioned above), and this triggers serious mechanical-electrochemical degradation. The critical value of DIS (or the nominal strength) is denoted by
  where
where  is the dimensionless mechanical strength of the active material. Because the quantitative relationship between the mechanical failure and the electrochemical degradation remains unclear, the mechanical failure of the active material cannot simply be equated with the battery failure.
33,34,45,46
Thus, an empirical parameter κ is introduced here to account for the effects of other potential mechanisms on the battery degradation upon fast charging.
is the dimensionless mechanical strength of the active material. Because the quantitative relationship between the mechanical failure and the electrochemical degradation remains unclear, the mechanical failure of the active material cannot simply be equated with the battery failure.
33,34,45,46
Thus, an empirical parameter κ is introduced here to account for the effects of other potential mechanisms on the battery degradation upon fast charging.  (or κ) needs to be determined experimentally. The failure criterion is not simply the onset of mechanical failure of the cathode, but is instead the onset of rapid capacity fading. For some battery systems, which have no obvious characteristic threshold or an extremely low threshold current (but still show a positive relationship between battery degradation and current density),
47–49
the critical current density for CC charging can be selected via an acceptable degradation rate, and consequently the nominal strength
(or κ) needs to be determined experimentally. The failure criterion is not simply the onset of mechanical failure of the cathode, but is instead the onset of rapid capacity fading. For some battery systems, which have no obvious characteristic threshold or an extremely low threshold current (but still show a positive relationship between battery degradation and current density),
47–49
the critical current density for CC charging can be selected via an acceptable degradation rate, and consequently the nominal strength  can also be defined. If there is a charging protocol in which the stress
  rapidly reaches the strength
  at the beginning of the charging process and remains at
  accelerated battery degradation can be avoided in theory. We name this particular protocol the "stress-regulated" (SR) charging protocol, because the governing condition is expressed by an equation of stress, that is,
  However, whether this protocol can accelerate the charging process remains unclear and needs to be investigated. Another problem is that the DIS cannot be regulated in a battery system directly. Therefore, controllable electrochemical quantities and their relationships with the DIS need to be evaluated.
Investigation of stress-regulated (SR) charging protocol
To investigate the electrochemical quantities, the diffusion of lithium within the active particle must be described, and is assumed to satisfy Fick's law: 50

The initial concentration distribution within the particle can be generally expressed as:

Commonly, the boundary condition can be given by specifying either the surface concentration or the surface flux.
35
Because the governing condition  contains the surface concentration directly, a boundary condition of time-varying surface concentration is selected:

Using a boundary condition of time-varying surface flux is also feasible, and yields similar results, as discussed in Appendix A.
By employing Duhamel's theorem, the solution of Eqs. 4–6 can be expressed as 51

where

and  The dimensionless concentration becomes:

By using Eq. 9, the evolution of concentration under any boundary condition of time-varying surface concentration can be tracked. For a uniform initial concentration, Eq. 9 simplifies to
If the surface concentration does not vary with time (the potentiostatic case), Eq. 10 further simplifies to
which is consistent with the result in Ref. 35.
For demonstration, a uniform initial concentration, namely  is assumed. By substituting Eq. 10 into Eq. 2, the stress
  under the condition of time-varying surface concentration can be obtained as:
The normalized capacity Q and the dimensionless current density  can be expressed as

Given that  the governing equation then becomes:

The single governing parameter is  Once the strength
  is determined, the surface concentration
  can be obtained via solving Eq. 14. However, because Eq. 14 is an integral equation with infinite series, deducing the explicit expression of
  is quite difficult. Thus, a numerical calculation method for solving Eq. 14 is employed, as given in Appendix B. The end condition of the charging process is given as
  which prevents the active material from overcharging. The time-consuming CV step that commonly contributes limited capacity utilization has been abandoned in many fast-charging methods.
5,14,39,46,52
Thus, the CV stage is not considered in this study.
which prevents the active material from overcharging. The time-consuming CV step that commonly contributes limited capacity utilization has been abandoned in many fast-charging methods.
5,14,39,46,52
Thus, the CV stage is not considered in this study.
The concept of stress regulation expressed by Eq. 14 is the major difference between this work and our previous study. 39,40 In our previous work, the basic feature of charging scheme is preseted. For instance, the EC method characteristically contains a nonlinear charging current with exponential decay. Obviously, to an extent, the optimization of these schemes is restricted by the preseted mathematical forms of the charging current. Some parameters in these schemes are also artificially set without sufficient physically based reasons. In this work, instead of being preseted, the charging current is directly calculated when the physically based parameters are provided.
Figure 1 shows examples of the evolution of the surface stress  the dimensionless surface concentration
  the normalized capacity Q and the dimensionless current density
  during SR charging (solid lines). Based on typical material properties of cathode materials, a reasonable range for
  is on the order of magnitude of 0.01–0.1.
43,53,54
For demonstration, three values of
is on the order of magnitude of 0.01–0.1.
43,53,54
For demonstration, three values of  namely 0.04, 0.06 and 0.08, were chosen. Obviously, owing to the governing condition,
  is always equal to
  as shown in Fig. 1a. Results for the corresponding CC methods (dashed lines) with current density
  are also plotted for comparison. The expression of
  is obtained from Eq. 3 when

Figure 1. The effect of the strength  on the evolution of the dimensionless (a) surface stress, (b) surface concentration, (c) capacity and (d) current density during SR charging. Dashed lines represent the corresponding CC processes for comparison.
Download figure:
Standard image High-resolution imageAt the early stage of the charging process,  in the CC method is evidently lower than that in the proposed SR method. The lower stress is induced by the more uniformly distributed concentration within the active particle. In a continuously delithiating process, a more uniform concentration commonly indicates a higher surface concentration.
11,39
As expected, the decrease in
in the CC method is evidently lower than that in the proposed SR method. The lower stress is induced by the more uniformly distributed concentration within the active particle. In a continuously delithiating process, a more uniform concentration commonly indicates a higher surface concentration.
11,39
As expected, the decrease in  in the CC method is considerably slower than that in the SR method, as shown in Fig. 1b. Because the end condition of charging is
  the constantly lower surface concentration
  in the SR method naturally leads to earlier termination of charging. However, this earlier termination of the charging process does not necessarily indicate faster charging. Thus, the capacity utilization (the normalized capacity Q at the end of charging) should be evaluated. As shown in Fig. 1c, for any given
  the difference in capacity utilization between these two charging methods is insignificant. Therefore, the SR method can accelerate the charging without sacrificing the capacity utilization. Meanwhile, it should be noted that the surface concentration is difficult to directly control in practice. To solve this problem, the time-varying current density, which is easier to control, can be specified via Eq. 13b and is demonstrated in Fig. 1d. The current density undergoes an approximately exponential decay from an extremely high value to a steady but relatively low value (
 ).
).
Furthermore, the impacts of  on the charging acceleration
  and the capacity utilization difference
  are plotted in Fig. 2. The charging acceleration describes the shortened charging time compared with the referenced CC method. A higher
  indicates faster charging, while a higher
  indicates more serious loss of capacity utilization. The subscript "end" represents the end of charging. The superscripts "s" and "c" stand for the stress-limited protocols (including SR, BC
39
and EC
40
) and the corresponding CC method (
indicates more serious loss of capacity utilization. The subscript "end" represents the end of charging. The superscripts "s" and "c" stand for the stress-limited protocols (including SR, BC
39
and EC
40
) and the corresponding CC method ( ), respectively. As shown in Fig. 2, compared with the CC procedure, the SR method can shorten the charging process by 10%–20%, without a notable decrease in the capacity utilization. For higher
  values, this acceleration is more significant. The BC
39
and EC
40
methods proposed in our previous work are also illustrated in Fig. 2 for comparison, with the maximum and minimum dimensionless current densities in these two charging schemes being
values, this acceleration is more significant. The BC
39
and EC
40
methods proposed in our previous work are also illustrated in Fig. 2 for comparison, with the maximum and minimum dimensionless current densities in these two charging schemes being  and
and  respectively. The acceleration of the SR protocol is clearly superior to those of the BC and EC protocols, indicating that the SR method is a more advanced approach for stress-limited fast charging.

Figure 2. Variation of the charging acceleration  and the capacity utilization difference
  with strength
  The subscript "end" represents the end of charging. The superscripts "s" and "c" stand for the stress-limited (SR, BC and EC) protocols and the corresponding CC method, respectively.
Download figure:
Standard image High-resolution imageInvestigation of constant-current stress-regulated (CCSR) charging protocol
However, the present discussion of the SR method is only meaningful in theory, because there is a unachievable operation in practice. As shown in Fig. 1d, the initial current density at the beginning of the SR charging is extremely high (in fact, theoretically infinite), which is neither realistic nor safe. Therefore, the early stage of the SR protocol needs to be modified. Considering that commercial LIBs and charging devices have current limits that are commonly quite high, an initial CC stage with the current limit is introduced, followed by the SR stage. This combined charging procedure is denoted as CCSR. In the CC stage with constant current density  the concentration can be expressed as
35,39
the concentration can be expressed as
35,39
The stress  is given by Eq. 3 (making
  ) and increases gradually with charging time. When
  reaches
  the protocol switches to the SR stage, throughout which
  =
=  The time at which the operation switches is denoted by
  which satisfies the equation
  where
where  is given by Eq. 3, and the concentration distribution at that time is expressed as
  The concentration distribution
  is also the initial concentration distribution of the SR stage. The concentration of the SR stage, denoted by
  can be expressed by Eq. 9. The only difference is that one needs to replace
 and
and  with
with 
 and
and  respectively. Thus, the governing equation of the SR stage becomes:
By using the numerical method provided in Appendix B, Eq. 16 can be solved. Subsequently, the normalized capacity  and the dimensionless current density
  in the SR stage can also be obtained:

There are two governing parameters in the CCSR protocol, namely  and
and  The former can be obtained via experiments, while the latter is determined by the allowable current of the battery system or the charging device.
Figure 3 shows the evolution of 
 Q and
Q and  in the CCSR method.
 and Q in the CCSR charging evolve more slowly at the beginning of the charging process (Figs. 3a–3c), compared with their behavior in the SR charging. This is because of the relatively lower current in the first stage of CC charging (Fig. 3d). When the operation switches to the SR charging, the evolution of these physical quantities (i.e.
 Q and
Q and  ) in the CCSR method is very similar to that in the SR method. The presence of the CC stage means that the CCSR charging is slightly slower overall than the SR charging.

Figure 3. The effect of the strength  on the evolution of the dimensionless parameters: (a) surface stress, (b) surface concentration, (c) capacity and (d) current density in the CCSR charging method, with
  Dashed lines represent the corresponding SR processes for comparison.
Download figure:
Standard image High-resolution imageThe impact of  on the CCSR method is also shown in Fig. 3. Higher
  increases the duration of the CC step, because
  needs more time to reach
  This is a reasonable result that can be directly predicted from Eq. 3. Moreover, the impact of
  on the CCSR method is illustrated in Fig. 4 (in which the SR protocol can be considered as a special case of the CCSR protocol with
  ). For the system with a higher
  the SR stage begins earlier, which results in faster charging overall. It is also worth mentioning that the evolution of current density in the CCSR procedure after the operation switch rapidly approaches that in the SR procedure, regardless of the values of the governing parameters (i.e.
  and
and  ).
).

Figure 4. The effect of  (the current density of the CC step) on the evolution of the dimensionless parameters: (a) surface stress, (b) surface concentration, (c) capacity and (d) current density in the CCSR charging method, with
Download figure:
Standard image High-resolution imageThe effect of the CCSR protocol on the charging acceleration  and the capacity utilization difference
  are depicted in Fig. 5.
  and
and  are the total charging time and the capacity utilization, respectively, of the corresponding CC method with
  Regardless of the specific values of
  and
and  the CCSR protocol always achieves faster charging than the corresponding CC protocol, without obvious loss of capacity utilization. However, unlike the SR protocol, a higher
  value does not necessarily lead to earlier termination of charging. As discussed earlier, a higher
  leads to a longer duration of the CC stage in CCSR. For the case of high
  and low
  the CC stage is quite long, leading to poor acceleration and slow charging overall. Once
  is high enough, the acceleration in the SR stage becomes dominant, and higher
  can then lead to faster charging.

Figure 5. Variation in charging acceleration  and capacity utilization difference
  with
with  (the current density of the CC step) for the CCSR charging method. Different lines represent different
Download figure:
Standard image High-resolution imageComparing Fig. 5 with Fig. 2 shows that the CCSR protocol is still faster than the BC and EC protocols. When  the acceleration
  obtained with CCSR is at least 9.9%, while those of BC and EC is below 7.8% (for
  < 0.08). Therefore, the CCSR method appears superior to the BC and EC protocols.
Experimental Validation
For the convenience of following discussion, a list of acronyms is provided in Table I.
Table I. List of acronyms.
| LIB | lithium-ion battery | DIS | diffusion-induced stress |
| SOC | state of charge | CC | constant current |
| CV | constant voltage | CCCV | constant-current constant-voltage |
| BC | boost charging | MCC | multistage constant current |
| PC | pulse charging | CCPC | constant-current pulse-charging |
| EC | exponential current | CCEC | constant-current exponential-current |
| SR | stress-regulated | CCSR | constant-current stress-regulated |
To confirm the usability of the proposed CCSR charging method with commercial LIBs, experimental validation was conducted. A group of 18650 cylindrical LIBs, US18650VTC5A from Sony Co., were electrochemically cycled. This battery type is particularly suitable for high power devices. The cathode and anode materials are LiNiCoMnO2 and graphite, respectively. The nominal capacity of the battery is 2.5 Ah. The cycling tests were conducted using battery test systems (CT-4008–5V20A-A from Neware). For consistency, all batteries were pretreated by first being discharged under a constant current of 2.5 A to a lower cut-off voltage of 2.0 V. Subsequently, the batteries were cycled over a voltage window of 2.0–4.2 V (as suggested in the battery instructions). The charging terminated at the higher cut-off voltage of 4.2 V. Because the charging is the main focus of this study, the current in the discharge step was set as 2.5 A (1 C) for all cases. A five-minute hold was set between the charge and discharge steps. All experimental data presented are mean values of at least three batteries. All cycling tests were conducted at room temperature (the measured temperature evolution of the tested cells can be found in Appendix C).
As mentioned in theoretical modeling, there are two governing parameters in the CCSR protocol, namely  and
and  For a specified system, these two parameters need to be determined. To obtain these basic parameters, standard CC charging was first carried out. The C-rates selected were: 1, 2, 3, 4, 5 and 6 C. Extremely high C-rates were included to comprehensively investigate the battery fading upon fast charging.
The cycling performance (including the charge capacity and the coulombic efficiency) for the CC charging is shown in Fig. 6a. Although the capacity decreases with cycles in all cases, particularly rapid fading occurs for C-rates higher than 4 C. The plot of capacity retention in Fig. 6b demonstrates this phenomenon more clearly. Thus, 4 C was determined to be the critical C-rate. However, this information still does not provide the strength  because the relationships between the dimensionless parameters in our theoretical equations and the dimensional parameters measured in experiments are not known. Therefore, we have used the expression of concentration during CC charging
35
to derive the following two equations:
because the relationships between the dimensionless parameters in our theoretical equations and the dimensional parameters measured in experiments are not known. Therefore, we have used the expression of concentration during CC charging
35
to derive the following two equations:


where  (because the C-rate
  and the dimensionless current density
  are both proportional to the value of charging current). Equation 18a is governed by the linear relationship between the capacity and the charging time upon CC charging. Equation 18b represents the termination condition of the charging process, that is,
  In Eq. 18, the C-rate
  the normalized capacity (or SOC)
  at the end of charging and the total charging time
  can be obtained from the experimental data directly, as listed in Table II. For simplicity, the data of the 1st cycle are used. Substituting
 and
and  into Eq. 18, the corresponding
  and
and  can be obtained. The corresponding values of
  and
and  for the cases of 1 C, 2 C, 3 C and 4 C are also presented in Table II. Because of the rapid degradation that occurred for the 5 C and 6 C cases, Eq. 18 was not used for those results. Interestingly, the values of
  and
and  for the different cases are quite close. The mean values of
  and
and  are −0.25 and
  s−1, respectively.

Figure 6. Cyclic performance for CC charging: (a) evolution of charge capacity and coulombic efficiency, (b) change in capacity retention with C-rate after different numbers of cycles.
Download figure:
Standard image High-resolution imageTable II. Charging time and capacity of the 1st testing cycle and the corresponding  and
and 
| C-rate | 1 | 2 | 3 | 4 |
|---|---|---|---|---|
| Experimental data | ||||
| Charge capacity (mAh) | 2384 | 2241 | 2098 | 2002 |

| 95.36% | 89.64% | 83.92% | 80.08% |
 (s) (s) | 3433 | 1613 | 1007 | 721 |
Calculated
 and
and

| ||||

| −0.232 | −0.259 | −0.271 | −0.25 |
 (s−1) (s−1) | 3.99 × 10⁻⁴ | 3.58 × 10⁻⁴ | 3.45 × 10⁻⁴ | 3.71 × 10⁻⁴ |
Mean values:  and and 
| ||||
Verification for the mean values of
 and
and

| ||||

| 95.05% | 90.09% | 85.13% | 80.18% |
 (s) (s) | 3425 | 1623 | 1022 | 722 |
To verify the usability of the averaged  and
and 
 and
and  are theoretically calculated from the mean values of
  and
and  using Eq. 18. As shown in Table II, the values of
  and
and  obtained from this theoretical calculation are highly consistent with those measured experimentally; the differences between the results of calculation and experiment are less than 1.5%. Hence,
  and
and  are chosen for further calculations. It is worth mentioning that the obtained
  and
and  are statistical averages for this battery system. They may not directly depict the features of each active particle because the materials properties, the size and the location of the active particles are not exactly identical.
Equation 3 can now be rewritten in terms of experimentally-obtainable parameters:

Substituting  (the critical C-rate),
  (the total charging time for the critical C-rate),
  and
and  into Eq. 19,
  is obtained. The other governing parameter,
  also needs to be prescribed. Considering that the maximum allowable current for the battery test device employed in this work is 20 A (8 C for the tested battery),
  is chosen.
Because the governing parameters are now known, the time-varying current in the CCSR protocol can be evaluated, as shown in Fig. 7a. Dimensional parameters are used in Fig. 7a where the charging current  and the charging time
  The theoretical average current
  of the proposed CCSR protocol is ∼11.2 A. For comparison, two CC processes with 10 A and 11 A are also employed. As mentioned above, 10 A (4C) is the critical current for the CC charging in this battery system. According to the design philosophy of stress regulation, the capacity fading in the CCSR method should be similar to that in the CC method with 10 A. The current of 11 A is also selected because it is slightly lower than the theoretical average current of the CCSR protocol.

Figure 7. The CCSR charging method: (a) time-varying charging current, (b) change in charge capacity with cycle number, and (c) measured average charging current for each cycle. For comparison, results for CC charging (10 A and 11 A) and CCEC charging (a = 0.03, 0.012 and 0.08) are also presented.
Download figure:
Standard image High-resolution imageIn addition, because there may be differences between the actual charging process and the theoretical model, the CCSR procedure may need fine tuning. The trend of the current-time curve in the second stage of CCSR is highly similar to an exponential decline. Thus, CCEC (a CC stage followed by an exponential current, EC stage) procedures are employed here. The first stage of CCEC is identical to that of CCSR (including the identical switch time  ). The current in the second stage of CCEC is given by

where the maximum and minimum current are Imax = 20 A and Imin = 10 A, respectively. The single adjustable parameter a characterizes the rate of current decrease, with a higher value of a indicating a more rapid decrease in current from Imax to Imin. To fine tune the CCSR protocol, three values of a, namely 0.008, 0.012 and 0.03 are selected, as shown in Fig. 7a. In the second stage (the EC or SR stage), the currents used in the CCEC curves with a = 0.008 and 0.012 are slightly higher than that in CCSR, while that in CCEC with a = 0.03 is slightly lower. Nevertheless, the evolution of current in CCSR and CCEC is highly similar. The corresponding voltage profiles in these charging processes and the measured temperature evolution of the testing cells can be found in Appendix C. Figure 7b demonstrates the cycling performance for the CC, CCSR and CCEC procedures provided in Fig. 7a.
As mentioned above, the critical current for CC charging of this battery system is 10 A. Therefore, the capacity obtained using CC charging with 10 A can be considered as a baseline. In the CC procedure with 11 A (only 10% higher than the critical current of 10 A), much more rapid capacity fading is triggered. Note that the calculated average current for the CCSR protocol is higher than 11 A. To verify this, the measured average current of CCSR is plotted in Fig. 7c. Owing to the slight decrease in charge capacity, the average current of CCSR gradually increases with cycle number. However, it remains above 11 A. Interestingly, compared with the CC method with 11 A, the CCSR protocol provides both faster charging and more stable cycling performance. Additionally, the capacity evolution of the CCSR procedure is almost consistent with that of the baseline procedure (CC with 10 A), indicating that these two procedures give almost identical cycling stability and capacity utilization. Meanwhile, compared with the baseline CC procedure, the CCSR protocol also provides a 10%–20% decrease in the charging time.
The comparison between CCSR and CCEC is also shown in Fig. 7b. Surprisingly, although the CCSR and CCEC procedures in Fig. 7a are quite similar, their corresponding cycling performances are distinctly different. Rapid capacity fading occurs in CCEC with a = 0.008 and 0.012, even though these two cases are only slightly faster than the CCSR method in theory. In contrast, in CCEC with a = 0.03, the current is always slightly lower than that in the CCSR method (Fig. 7a) and the rapid capacity fading is avoided. These results suggest that the proposed CCSR protocol is an optimized fast charging method that balances acceleration and cycling performance. Charging slightly faster than CCSR results in rapid degradation; obviously, charging more slowly increases the charging time.
Note that the key factor for designing the CCSR method is the regulation of DIS. For an in-depth understanding of the cycling performance presented in Fig. 7b, the calculated evolution of  for the corresponding CC, CCSR and CCEC procedures is shown in Fig. 8a (the DIS of CCEC can be expressed by Eq. A·5). By comparing Fig. 8a with Fig. 7b, a clear relationship between the DIS and the capacity fading is presented. Only if the stress
  ever exceeds the strength
  the rapid capacity fading will be triggered. This capacity fading is very sensitive to stresses near
  Even though the peak value of
  in the case of CCEC with a = 0.012 is only 7.86% higher than the value of
  the CCEC curve shows drastic capacity fading.

Figure 8. Mechanical response for different charging methods: (a) evolution of the stress  with charging time for the CC, CCSR and CCEC methods; SEM images of the positive electrodes for (b) CCSR and (c) CC with 11 A after 500 cycles.
Download figure:
Standard image High-resolution imageTo further confirm that the improvement by CCSR is due to suppressing mechanical failure at the positive electrode, characterizations on the electrodes were conducted. The cells were disassembled in the argon-atmosphere glove box. The pieces cut from the entire large electrode were rinsed thoroughly with the dimethyl carbonate (DMC, Damas-Beta) and subsequently dried for 2 h in the vacuum chamber. The surface morphologies of the positive electrodes were characterized by the scanning electron microscopy (SEM, JEOL JSM-7800F). The SEM images clearly suggest that the fracture of positive active particles for CC with 11 A (Fig. 8c) is much more severe than that for CCSR (Fig. 8b). The results of Figs. 8b and 8c are in line with the expectations of Fig. 8a and further explain the cycling performances presented in Fig. 7b. Thus, Figs. 7 and 8 clearly demonstrate the effectiveness of stress regulation during fast charging. The concept of stress regulation provides a new approach to design effective fast-charging protocols from the viewpoint of mechanics.
Additionally, the plating of lithium metal which is another potential mechanism causing the rapid battery fading in fast charging is also evaluted. The details can be found in Appendix D. The experimantal data suggest that, at least for the presently studied battery system, the lithium plating rarely occurs in the cases of CCSR and CC with 10 A (4 C), 11 A and 12.5 A (5 C). In other words, the lithium plating is not a major mechanism affecting the improvement by the CCSR protocol.
Concluding Remarks
Stress regulation (SR) during charging of LIBs has been proposed in this work to achieve both fast charging and stable cycling performance. A charging protocol has been designed so that the stress within the active particle rapidly reaches a critical value at the beginning of charging and then maintains that value. A theoretical model for SR has been developed. By analyzing the concentration and stress profile within a spherical active particle and using a semi-analytical method to solve the governing integral equation, the SR charging method has been proposed. Although the SR protocol can accelerate the charging process considerably, there is a unachievable operation in practice—the current at the beginning of the SR charging is theoretically infinite, which is neither realistic nor safe. To overcome this issue, the CCSR method, an initial constant current (CC) stage followed by the SR stage, has been proposed. Two governing parameters for the CCSR protocol, namely the dimensionless strength  and the dimensionless current density of the CC step
  have been identified.
Furthermore, a method of converting the dimensionless parameters in the theoretical equations so that they can be compared with the dimensional parameters measured in experiments has been provided. By combining the modeling and standard CC charging experiments, the values of the governing parameters have been determined for one type of commercial 18650 cylindrical LIB (US18650VTC5A). Subsequently, the effect of the CCSR method on the charging of commercial LIBs has been evaluated experimentally. Compared with the referenced CC procedure (10 A), the CCSR protocol leads to the almost identical cyclic performance and a 10%–20% decrease in the time taken for the charging process. Compared with the CC procedure at 11 A (which leads to severe capacity fading), the CCSR protocol shows both faster charging and more stable cycling performance. By further comparing the CCSR protocol with the CCEC (CC followed by exponential current) protocol, it is found that the CCSR protocol is an optimal balance between charging speed and cycling performance. Charging faster than CCSR results in rapid capacity fading, while charging slower than CCSR leads to longer charging time.
Acknowledgments
This work was supported by the National Natural Science Foundation of China (grant nos. 12072183, 11702166, 11872236 and 11702164).
Appendix A.: Boundary Condition of Time-varying Surface Flux
The general boundary condition of time-varying surface flux can be expressed as:

By employing Duhamel's theorem and assuming that the initial concentration  is independent of location, the solution of Eqs. 4 can be expressed as
51
is independent of location, the solution of Eqs. 4 can be expressed as
51
The normalized amount of lithium Qʹ and the dimensionless surface concentration  are given by

Substituting Eqs. A·3, A·4 into Eq. 2, the stress  can be given as

By employing the governing condition  the governing equation becomes:

Similar to Eq. 14, there is a single governing parameter,  Once the strength
  is determined, the evolution of the current density
  can be obtained. Equations 14 and A·6 are both integral equations which give essentially identical results (because the physical meaning of these two equations is identical). They are of similar difficulty to solve numerically. However, the surface concentration relates directly to the cut-off condition
  Thus, the termination of charging can be more accurately predicted when the surface concentration is tracked. Hence, Eq. 14 was employed as the governing equation in the theoretical modeling of the main text.
Appendix B.: Numerical Calculation Method and Its Convergence
Because Eqs. 14 and 16 are integral equations that are usually difficult to solve analytically, a numerical method is introduced here. We consider a very small dimensionless time increment  which satisfies:
where it is assumed that  and α and β are positive integers. The single integral equation is discretized as β integral equations that can be expressed numerically as
Hence, Eq. B·1 is rewritten as
By employing Eqs. B·3, 14 for the SR protocol can be rewritten as

For the CCSR protocol, Eq. 16 can be rewritten as
where  When the time increment
  is given, the evolution of
  can be determined. However, the time increment method has the problem of potential error accumulation. Therefore, the numerical convergence should be evaluated, as demonstrated by the evolution of
  in the SR protocol, shown in Fig. B·1. Clearly, the difference between the curves with
  is negligible. To balance numerical convergence and computational efficiency,
  was employed to obtain the results in the theoretical modeling of the main text.

Figure B·1. Demonstration of numerical convergence ( ).
).
Download figure:
Standard image High-resolution imageAppendix C.: The Voltage Profiles and the Temperature Evolution
Figure C·1 illustrates the voltage profiles obtained during the first cycle of CC, CCSR and CCEC charging. The profiles of the CC procedures are typical for commercial LIBs. 13,15,18,19,22 Interestingly, after the initial rise, the voltage for the CCSR charging decreases slightly and then increases again. A similar profile is also observed for CCEC with a = 0.03, but not for CCEC with a = 0.008 and 0.012. This phenomenon is probably caused by the very dramatic drop in the charging current at the beginning of the second stage in CCSR and in CCEC with a = 0.03.

Figure C·1. Voltage profiles for the first cycles of CC, CCSR and CCEC charging.
Download figure:
Standard image High-resolution imageTemperature is a critical factor for fast charging. The temperature evolution at the surface of each testing cell was measured by a thermocouple temperature recorder (THTZ1208R). For demonstration, the temperature evolution in the first 250 min of the cycling is presented, involving the initial 3–4 cycles. As shown in Fig. C·2, the temperature evolution basically cycle-by-cycle repeats. For the CC charging, there is no doubt that higher C-rates lead to higher temperatures, as shown in Fig. C·2a. Additionally, the temperature evolutions of the CCSR, CC (10 A and 11 A) and CCEC (a = 0.03, 0.012 and 0.008) charging are plotted in Fig. C·2b. Interestingly, the temperature evolutions of CCSR and CCEC with a = 0.012 and 0.008 are quite similar, while the temperature ranges of CCSR and CC with 11 A are also basically identical. The highest temperatures of the cells charged by CCSR, CC with 11 A and CCEC with a = 0.012 and 0.008 are 47.9 °C, 47 °C, 48.6 °C and 48.2 °C, respectively. However, the cycling performance of CCSR is much more stable than those of the other three protocols, as shown in Fig. 7b. In other words, the temperature is not a main factor related to the improvement of CCSR.
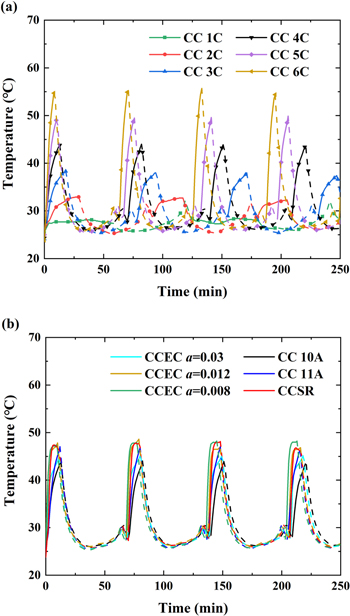
Figure C·2. Temperature evolution of testing cells: (a) standard CC charging (1 C, 2 C, 3 C, 4 C, 5 C and 6 C) (b) CCSR, CC (10 A and 11 A) and CCEC (a = 0.03, 0.012 and 0.008) charging. The solid lines indicate the charge steps; the dashed lines indicate the discharge steps and the hold steps.
Download figure:
Standard image High-resolution imageAppendix D.: Investigations on Lithium Metal Plating
The lithium plating at negative electrodes is also a potential mechanism causing the rapid battery fading in fast charging 6,19,55–57 and will be evaluated in this section. The rinsed and dried negative (graphite) electrodes were evaluated by X-ray diffraction (XRD, Smartlab 9). It has been reported that the XRD profile of the negative electrode at the fully discharged state can be employed to detect and quantify the irreversibly plated lithium metal. 55 However, no characteristic peak of lithium metal appears in Fig. D·1, indicating that no irreversible lithium plating occurs.

Figure D·1. XRD profiles of the negative electrodes after 500 cycles (except for the "fresh" case without cycling).
Download figure:
Standard image High-resolution imageFurthermore, two electrochemical indicators, namely the end-of-charge rest voltage (Veoc, the cell voltage at the end of the rest/hold after the charge) and the post-charge differential voltage relaxation (post-charge dV/dt, the time derivative of voltage in the rest/hold period after the charge), are introduced here to identify the status of lithium plating. 55,57 In the cases of lithium plating, the voltage Veoc is usually on the rise because of the lower anode potential caused by the mixture of graphite and plated lithium metal, and the post-charge dV/dt has an inflection-point feature or a peak caused by the plated lithium intercalating into the graphite. 55–57 For demonstration, four cases, namely CCSR and CC with 10 A (4 C), 11 A and 12.5 A (5 C), are presented. Interestingly, these typical characteristics of lithium plating are not observed in either Fig. D·2 for Veoc or Fig. D·3 for post-charge dV/dt. This indicates that, at least for the presently studied battery system, the lithium plating is neither the main reason for the rapid degradation of the cells nor a major mechanism affecting the improvement by the CCSR protocol.
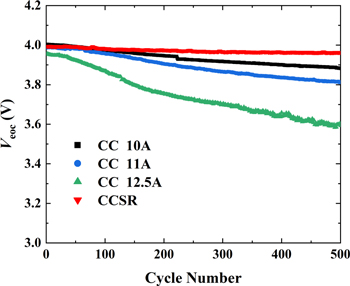
Figure D·2. Veoc with respect to cycle numbers for the CCSR and CC (10 A, 11 A and 12.5 A) charging methods.
Download figure:
Standard image High-resolution image
Figure D·3. Post-charge dV/dt of the initial 10 cycles of the cells charged by CC with (a) 10 A, (b) 11 A and (c) 12.5 A as well as (d) CCSR.
Download figure:
Standard image High-resolution image