
Abstract
In this work, we study the dependence of water content on the carbon corrosion reaction by applying an external potential (1.4 V vs RHE) under saturated and low (30%) relative humidity (RH) conditions via a transmission line model (TLM)-based impedance analysis in a polymer electrolyte membrane fuel cell (PEMFC). High potentials inducing carbon corrosion reaction cause electrode thinning, make the supporting carbon structure less porous, decrease the electrochemical surface area (ECSA), and dehydrate the ionomer, leading to fast performance decay in the cell. Particularly, in this work, we discuss the main cause of performance decay in PEMFCs in view of the structural deformation of supporting carbon using the ionic resistance and double layer capacitance in non-faradaic impedance and charge transfer resistance in faradaic impedance to elucidate the different degradation behaviors of membrane electrode assembly (MEA) under saturated and low humidity (RH 30%) conditions. As a result, it is confirmed that carbon corrosion severely changes the structural properties of the supporting carbon, such as pore depth and circumference, and the specific pore deformation with the evolution of oxygen-containing functional groups on the carbon surfaces subordinately induces the severe degradation in cell performance with the water drainage issues, namely, flooding.

This is an open access article distributed under the terms of the Creative Commons Attribution Non-Commercial No Derivatives 4.0 License (CC BY-NC-ND, http://creativecommons.org/licenses/by-nc-nd/4.0/), which permits non-commercial reuse, distribution, and reproduction in any medium, provided the original work is not changed in any way and is properly cited. For permission for commercial reuse, please email: permissions@ioppublishing.org.
A polymer electrolyte membrane fuel cell (PEMFC) is a promising candidate for future stationary and transportation power sources due to its high energy conversion efficiency and pollutant-free nature. A PEMFC consists of a membrane electrode assembly (MEA), gas diffusion layers (GDLs), and bipolar plates (BPs). Among them, MEA, composed of carbon-based supporting materials, catalysts, and membrane, is directly related to the performance and durability of PEMFCs. Therefore, much effort has been made to develop advanced MEA to increase the energy efficiency and lifespan of PEMFCs. Despite considerable progress, however, there are unsolved degradation problems 1 under problematic operating conditions such as startup/shutdown cycling, 2–6 flooding/dehydration, 7–11 and reactant (fuel/oxygen) starvation. 9,12,13 Therefore, a comprehensive understanding of the degradation mechanism in MEA is essential to solve the stability problems in PEMFC systems. 1,14,15
Among various degradation problems, carbon corrosion occurs by electrochemical oxidation reactions at the catalyst layer (CL), resulting in severe PEMFC performance decay. 5,6,16–20 Typically, when hydrogen and oxygen gas coexist on the anode, the hydrogen oxidation reaction (HOR) and oxygen reduction reaction (ORR) occur simultaneously, forming a mixed potential at the anode, followed by a severe oxidation reaction at the cathode, named the "reverse-current decay mechanism," according to Reiser's report. 21 Moreover, when PEMFC operates under fuel starvation conditions, the overpotential of the HOR reaction would increase due to the insufficient reactant concentration, and thus, the anode potential would increase up to 1.23 V vs RHE. Due to the higher potential induced at the anode than at the cathode, known as the cell reversal phenomenon, as well as the insufficient reactant (H2) for fuel cell operation, the original reaction at the anode (HOR) can be replaced by a corrosive oxidation reaction, leading to severe anode deterioration. 9,12 In fact, the carbon corrosion reaction (oxidation reaction) is not thermodynamically generated below the specific potential expressed as follows:


Moreover, the carbon corrosion reaction rates are low due to the formation of passivating oxide films at the upper potential between the fuel cell operating potentials. 18 However, when the electrode potential abnormally spikes to ∼1.4 V vs RHE induced by corrosive operating conditions such as on/off cycling or fuel starvation, 22–26 a carbon corrosion reaction can occur simultaneously with an oxygen evolution reaction (OER). This leads to serious deformation of the supporting carbon structure, which is a major cause of the dramatic decrease in PEMFC durability. To elucidate the mechanism of carbon corrosion under various atmospheres, previous studies have used accelerated tests by applying an external voltage under diverse operational conditions, such as RH, temperature and pressure conditions. 19,27 Among the various conditions, water is the primary factor responsible for the carbon corrosion reaction, rapidly releasing COx gas; that is, the RH condition is considered one of the major parameters influencing carbon corrosion reaction kinetics. 19 J Kim et al. 2 studied the effects of RH conditions on carbon corrosion experiments during 1500 startup/shutdown cycles. J Jung et al. 19 conducted carbon corrosion tests on PEMFCs under various applied voltages with different RH conditions. T Mittermeier et al. 3 suggested a kinetic model for the relationship between RH and carbon corrosion based on modeling and experiments. These experimental and modeling studies commonly verified that the performance degradation of PEMFCs was more significant under higher RH conditions because water is required for the carbon oxidation reaction. 2,3,19 However, the carbon corrosion oxidation reaction mechanism was not specified since most previous works have only focused on postmortem ex situ analysis of MEAs requiring PEMFC disassembly. Even though the degree of the carbon corrosion reaction could be quantified by measuring the generated amount of carbon dioxide at the cathode exhaust line, it was not possible to study the variation in the supporting carbon structure components, such as the pore circumference and depth, whose components are associated with the supporting carbon capacitance. 20,25
In this context, we performed carbon corrosion reaction tests under saturated (100%) and low (30%) RH conditions by applying an external potential for accelerated degradation tests (ADTs) to mimic the high potential (1.4 V vs RHE) inducing electrochemical carbon corrosion conditions, 28,29 and investigated different degradation rates using electrochemical analysis. In particular, we adopted the complicated equivalent circuit of the transmission line model (TLM), which can specify the internal resistances of porous electrodes 30–33 as well as the active surface area 34 and can be combined with complex capacitance analysis to reveal the primary factors affecting PEMFC performance. Typically, the evolution of structural deformation, such as pore depth and circumference changes, could be identified via the correlation between ionic resistance, double layer capacitance, and charge transfer resistance, where the degrading components inside the electrode could be connected with the main causes affecting the performance and durability of PEMFCs. In addition, to corroborate the electrochemical results, postmortem surface analyses validated the impact of humidity inside the MEA on the carbon corrosion reaction and PEMFC performance decay.
Physical Meaning of EIS with a TLM Circuit: Porous Structure Electrode
The impedance behavior of the porous CL includes geometrical components of internal resistances such as membrane resistance (Rmem), ionic resistance (Rion), electronic resistance (Rele), double layer capacitance (Cdl), and charge transfer resistance (Rct), under a faradaic/non-faradaic reaction, as shown in Fig. S1a (available online at stacks.iop.org/JES/168/064515/mmedia). Assuming that the Rele value of stable supporting carbon could be negligible (Rele ≈ 0), the TLM equivalent circuit could be modified, as shown in Fig. S1b, indicating that high frequency resistance (HFR, ohmic resistance) is the sum of the membrane resistance (Rmem) and Rele in high frequency regions since the electronic resistance of the cathode CL () would be dominated by Rele (HFR = Rmem + 1/ = 1/Rion + 1/Rele ≈ 1/ Rele), as represented in Figs. S1a, S1b. Based on the TLM circuit, except for the HFR value, as shown in Fig. S1b, Levie solved the analytical formula for the impedance response of cylindrical pores, 32 which can be described as


where is the ionic resistance per unit length, L is the pore depth, and Z* is the impedance per unit area. In H2/air purged fuel cell systems, Z* includes the faradaic components as follows: 35


which contains the faradaic properties of porous electrode structures, such as the charge transfer resistance per unit area, the double layer capacitance per unit area, and the pore circumference (X). In an actual experimental result, the real impedance converges at low frequency as follows: 35


implying that both the Rion and Rct values are affected by the structural properties of the porous electrode.
In H2/N2 purged fuel cell systems, the impedance per unit area value can be expressed as follows: 35

Then, by inserting Eq. 5 into Eq. 1, the impedance Z can be expressed as follows 35 :

The real (Z') and imaginary (Z'') parts of impedance Z in Eq. 6 are as follows as w→0:

Theoretically, at the non-faradaic impedance process, Nyquist plots of porous electrode show a 45-degree straight line in the high frequency region, 30,31,36 followed by the divergence of the imaginary impedance, as represented in Eq. 7. Overall, in Fig. S1a, the limiting values of ionic resistance terms (Rσ ) relevant to the 45-degree straight line are related to the sum of the ionic resistance (Rion) and electronic resistance (Rele) considering the electron conductivity of supporting carbon elements in the TLM equivalent circuit. Due to the high conductivity of supporting carbon (Rion ≫Rele), the limiting value of the ionic resistance value could be simplified as expressed in Eqs. 4, 7. Instead, Rele could be evaluated at high frequency intercept values with the X-axis in Nyquist plots since the HFR value is the sum of Rmem and Rele in high frequency regions. Thus, if there are significant differences between the Rion and Rele values, the limiting values of ionic resistance (Rσ) and HFR would be dominated by Rion and Rele, respectively.
To further investigate the degrading electrode conditions, we adopted complex capacitance analysis to simultaneously interpret the interaction formula between Rion and Cdl; thus, the variation in structural properties could be monitored during degradation processes. The complex capacitance can be written as follows: 35,37,38
where the first term is the real part of the complex capacitance (C'), and the second term is the imaginary part (C''). Here, by inserting the impedance Z value (Eq. 6) into Eq. 8, the capacitance can be written as follows:

Then, the limiting value of the capacitance as w→0 (low frequency) can be expressed as follows:

Meanwhile, in the high frequency region, the imaginary capacitance (second term of Eq. 8) shows the peak frequency (fp ) at the maximum C'' value, which follows the correlation between ionic resistance (Rion ) and double layer capacitance (Cdl) as follows: 38

Experimental
Preparation of a single PEMFC cell
Degradation tests were carried out on a PEMFC test station (CNL Energy Co., Ltd.) using a 25 cm2 (5 cm × 5 cm) single cell. A commercial MEA (Nafion 211, thickness: 25.4 μm) with a catalyst layer, composed of 0.4 mg cm−2 Pt on carbon black (60 wt.%), was sandwiched between two gas diffusion layers (GDLs, 39BB, SGL) composed of graphitized carbon, Teflon gaskets, and bipolar plates (BPs) with four serpentine flow field channels, whose channel and land widths were 1.0 and 0.75 mm (channel/land width ratio: 1.3), respectively, with a 0.5 mm depth of flow field in both the anode and cathode. The assembled cell was activated at a fixed 0.4 V cell voltage under fully humidified 100% RH conditions with the stoichiometric ratios (SRs) of the flow rates being 1.5 fuel (H2) and 2.0 oxidant (air) for 24 h prior to the degradation tests. The cell temperature was fixed at 70 °C using cartridge heaters, and the different RH values (100 and 30%) were controlled through the dew point correlation between the cell (70 °C) and humidifier temperatures, and the pressure of the anode and cathode was fixed at 101.3 kPabs.
Electrochemical characteristics
Polarization curves were measured under 100% RH conditions using the current sweep method to evaluate the degrading cathode CL properties. The current density increases from 0 to 200 mA cm−2 with a current interval of 100 mA before the current is lower than 5 A, and then, the current gradually increases from 5 A to 40 A with a current interval of 1 A with the limited 0.3 V of a terminal cell voltage. During i–V curve measurements, 100 and 340 sccm of H2 and air, respectively, were fed to a single cell, and these values were minimum value for 400 mA cm−2 of current density at a 1.5/2.0 SRs of fuel and air, and the flow rates automatically increased following the 1.5/2.0 SRs after the current density was greater than 400 mA cm−2. We analyzed the faradaic process using a potentiostat (HCP-803, Biologic) in galvanostatic mode, and galvanostatic EIS (GEIS) was performed at 50 and 200 mA cm−2 of constant current densities with a sinusoidal amplitude lower than 10% of the current density at frequencies between 10 kHz and 100 mHz. All the internal resistance values in Nyquist plots were fitted quantitatively by the TLM based equivalent circuit using the Bisquert's model in an EIS analyzing program (ZView, Scribner Associates). To evaluate the electrochemical double layer capacitance (EDLC) properties of the degrading cathode CL, electrochemical analysis under a non-faradaic process was performed by purging 100 sccm of fuel (H2) to the anode used as the counter and reference electrodes and 340 sccm of nitrogen (N2) to the cathode used as the working electrode. In the 2-electrode systems, the electrochemical surface area (ECSA) was estimated by measuring CV curves with a 50 mV s−1 scan rate between 50 mV and 1.2 V vs RHE. Linear sweep voltammetry (LSV) curves were obtained with a scan rate of 2 mV s−1 between 50 mV and 0.6 V vs RHE to evaluate the membrane mechanical durability. EIS under a non-faradaic reaction was conducted in potentiostatic mode, and potentiostatic EIS (PEIS) was measured at 0.4 V vs RHE between 10 kHz and 30 mHz with a sinusoidal potential amplitude of 10 mV.
Electrochemical analysis of a single cell with carbon corrosion tests
First, electrochemical analyses were conducted to identify the initial performance of the fresh MEA under 100% RH conditions. For the faradaic reaction, H2/air gases were purged into the anode and cathode, respectively, indicating an OCV of approximately 0.95 V value, whereas non-faradaic analyses were performed by using N2 gas instead of air, causing the 0.103 V vs RHE OCV value depicted in Fig. 1a. Electrochemical analyses were conducted under 100% RH conditions to compare the optimized performance of the degrading MEA. In the experimental results, however, due to the small Rion value (smaller than 0.04 Ohm cm2) of the cathode CL under 100% RH conditions, the impedance behaviors of the Rion factors in the Nyquist plots (theoretically, straight line with a slope of 45-degrees) seem to be interrupted by inductance at high frequency, causing looped behavior in the high frequency region, as shown in Fig. 2a, resulting in inaccurate fitting values of the HFR and Rion. Therefore, the non-faradaic impedance analysis was additionally conducted for cathode CL under low RH conditions (30% RH) to deliberately increase the Rion values, of which the internal resistances measured in the high frequency region could be conspicuous and distinguishable since the accentuated Rion value comprises a significant proportion of the internal resistance value; thus, the structural properties of the cathode CL could be investigated more precisely and quantitatively. After electrochemical characterization, electrochemical carbon corrosion tests were conducted by applying an external potential of 1.4 V vs RHE under different relative humidity (100 and 30% RH) conditions, while 100/340 sccm of H2/N2 gas was purged into the anode and cathode, at a fixed cell temperature of 70 °C under 101.3 kPabs anode/cathode pressures, as shown in Fig. 1a. The carbon corrosion test (CCT) under specific x% RH conditions was named "CCT-RHx" in this work. Figures 1b, 1c shows the fixed cell potential at 1.4 V with oxidation current density for 30 min of initial CCT-RH100 and CCT-RH30. Both CCTs show an instantaneous high oxidation current density immediately after the external potential was applied, followed by 0.642 and 0.484 mA cm−2 saturated oxidation current densities under 100 and 30% RH conditions, respectively. In the case of the initial 30 min of CCTs, non-faradaic impedance analyses were conducted immediately after CCTs without the re-activation process and after the re-activation process to confirm the reversible degradation factors, as shown in Fig. 2. Afterwards, all electrochemical analyses (Figs. 3–5 ) were conducted after the activation process to compare the maximized performances and optimized conditions of the degrading cathode CL during CCTs, as described in Fig. 1a. Finally, to isolate the degraded components between the MEA and GDL, the aged GDL after 6 h of CCT-RH100 was re-assembled with the fresh MEA, and electrochemical analyses were conducted under 100% RH conditions to confirm the effects of the degraded GDL on the cell performance, as shown in Fig. 6.

Figure 1. (a) Electrochemical scenario of the carbon corrosion test. The cell temperature was fixed at 70 °C, and the gas flow rates of fuel and nitrogen were 100/340 sccm at the anode and cathode, respectively. The external potential and oxidation current density were measured as the accelerated degradation tests (ADTs) were performed under (b) 100 and (c) 30% RH conditions. Electrochemical measurements were conducted after carbon corrosion tests to investigate the degree of cathode degradation.
Download figure:
Standard image High-resolution image
Figure 2. Electrochemical impedance results of fresh and degraded cathode CLs after carbon corrosion tests (1.4 V vs RHE, 0.5 h) were performed under different RH conditions. (a) TLM equivalent circuit composed of the HFR, ionic resistance, and double layer capacitance with inductance, and comparison analysis of non-faradaic impedance results obtained for fresh cathode CL and cathode CL degraded for 30 min by CCTs under 100 and (b) 30% RH conditions before/after the re-activation process.
Download figure:
Standard image High-resolution image
Figure 3. Electrochemical measurement during the entire process of CCTs under different RH conditions; (a) polarization curves of degrading single cells; (b) cyclic voltammetry (CV) curves measured at a scan rate of 50 mV s−1; (c) linear sweep voltammetry (LSV) curves measured at a scan rate of 2 mV s−1 after the CCTs under 100% RH conditions; (d) polarization curves; (e) CV curves; and (f) LSV curves measured after the CCTs under 30% RH conditions.
Download figure:
Standard image High-resolution image
Figure 4. TLM-based electrochemical analysis during the CCTs under 100% RH conditions (after re-activation). The non-faradaic impedance analysis measured under dehydrated 30% RH conditions (a)–(c): (a) Equivalent circuit of the TLM without charge transfer resistance and non-faradaic impedance results, (b) imaginary capacitance and (c) changes in ionic resistance and double layer capacitance calculated by Eqs. 11 and 10. The faradaic impedance analysis performed under 100% saturated RH conditions to investigate the optimized cell performance (d)–(f): (d) Equivalent circuit of the TLM, including charge transfer resistance and GEIS results measured at a current density of 50 mA cm−2 during the initial 2 h of CCTs, followed by (e) 6 h of CCTs, and (f) GEIS results measured at a current density of 200 mA cm−2 during CCT-RH100.
Download figure:
Standard image High-resolution image
Figure 5. TLM-based electrochemical analysis during the CCTs under 30% RH conditions (after re-activation). The non-faradaic impedance analysis measured under dehydrated 30% RH conditions (a)–(c): (a) Equivalent circuit of the TLM without charge transfer resistance and non-faradaic impedance results, (b) imaginary capacitance and (c) changes in ionic resistance and double layer capacitance calculated by Eqs. 11 and 10. The faradaic impedance analysis performed under 100% saturated RH conditions to investigate the optimized cell performance (d)–(f): (d) Equivalent circuit of the TLM, including charge transfer resistance and GEIS results measured at a current density of 50 mA cm−2 during initial 2 h of CCTs, followed by (e) 6 h of CCTs, and (f) GEIS results measured at a current density of 200 mA cm−2 during CCT-RH30.
Download figure:
Standard image High-resolution image
Figure 6. Electrochemical analysis used to identify the effects of the carbon corrosion reaction on the degradation of GDLs. (a) Polarization curves, (b) non-faradaic impedance results, and faradaic impedance results measured at (c) 50 and (d) 200 mA cm−2 for a fresh MEA/GDL set and re-assembled cell using a fresh MEA and the aged GDL used for CCT-RH100.
Download figure:
Standard image High-resolution imageMEA characterizations
Fresh and degraded MEAs were characterized by XRD, TEM, SEM, and XPS before and after 6 h of CCTs under different (100 and 30%) RH conditions. The deteriorated MEAs were collected by dissembling the single cell and removing the GDLs. The Pt catalyst distribution was investigated using high-resolution transmission electron microscopy (HR-TEM; Tecnai Ge F30 S-Wtin), and the average Pt particle sizes were corroborated by fitting the Pt (111) peak of X-ray diffraction (XRD; Rigaku) data using a Gaussian function and Scherrer's equation:

where K is a constant value (0.9), λ is the wavelength of X-rays (0.154 nm), β is the FWHM of the XRD peak, and θ is the Bragg angle. MEA and GDL surface images were collected using scanning electron microscopy (SEM; S-4700 with an EMAX system, Hitachi). The surface properties of the fresh and degraded MEAs after 6 h CCTs were studied with X-ray photoelectron spectroscopy (XPS; Thermo Fisher Scientific) using Al K Alpha (1486.6 eV) at 100 W. The survey spectra were scanned at 200 eV of pass energy (PE) and the higher binding energy resolution spectra were scanned at 50 eV of PE. The XPS spectra were analyzed using the Gaussian function, and the distribution of the deconvoluted curves was calculated by the integration function in OriginPro program.
Results and Discussion
Impedance analysis of the initial CCT before and after the re-activation process
An electrochemical impedance analysis based on a TLM circuit was conducted to experimentally determine the origin of the oxidation reaction influencing PEMFC performance degradation. To investigate the double layer capacitive properties of the cathode CL during CCTs, we adopted a TLM circuit connected to an inductance (Lw) component in series, as shown in Fig. 2a. By adopting the TLM equivalent circuit, the experimental data showing the looped behavior in the high frequency region could be well matched with the fitting results, as shown in Figs. 2a, 2b, and the estimated internal resistances are summarized in Table I. Immediately after performing CCT-RH100 for 30 min, the HFR slightly increased from 0.045 to 0.047 Ohm cm2, and Rion decrease from 0.039 to 0.033 Ohm cm2, as shown in Fig. 2a and Table I. The increased HFR was recovered after the re-activation process, implying that OER-induced ionomer dehydration was responsible for reversible degradation in the ionomer or membrane, and Rion increased to 0.035 Ohm cm2 after the re-activation process. However, as shown in Fig. 2b, the HFR and Rion noticeably increased from 0.103 and 0.110 to 0.325 and 0.575 Ohm cm2, respectively, implying that the water contents in the ionomer could be affected when the cell potential is higher than the cell operating voltage under low humidity conditions, resulting in severe ionomer dehydration. After the re-activation process, both the HFR and Rion values recovered to 0.103 and 0.30 Ohm cm2, respectively, as shown in Fig. 2b and Table I. Consequently, there was an obvious distinction in ionomer hydration after the CCT under different RH conditions. It was reasonable to consider that the origins of major oxidant components (water) in carbon corrosion were different according to RH conditions. Under 100% RH conditions, the water contents in the ionomer are not influenced during the accelerated degradation test; therefore, the water vapor phase inside the MEA might have been used as the carbon corrosion oxidant. Meanwhile, in the CCT under low (30%) RH humidity conditions, a large portion of the water contents inside the ionomer seemed to be used as the oxidant, and therefore, the degraded CL had a dehydration problem. Considering the lower oxidation current during the CCT under low RH conditions, as shown in Figs. 1b, 1c, it is speculated that lower water contents inside the ionomer would cause severe ionomer dehydration conditions; on the other hand, however, a water deficit between ionomer/carbon surfaces would result in lower rates of the carbon corrosion reaction. Thus, in the case of CCT-RH30, the effects of repeated de/hydration processes on fuel cell systems should be investigated even though ionomer dehydration is reversibly recovered after the re-activation process.
Table I. Impedance fitting results of the HFR and ionic resistance in Figs. 2a, 2b.
| Unit: Ohm cm2 | Fresh | CCT-RH100 (0.5 h) before re-activation | CCT-RH100 (0.5 h) after re-activation |
|---|---|---|---|
| HFR | 0.045 | 0.047 | 0.045 |
| Ionic resistance | 0.039 | 0.033 | 0.035 |
| Unit: Ohm cm2 | Fresh | CCT-RH30 (0.5 h) before re-activation | CCT-RH30 (0.5 h) after re-activation |
| HFR | 0.103 | 0.110 | 0.103 |
| Ionic resistance | 0.325 | 0.575 | 0.30 |
Comparison of performance decay during the carbon corrosion test at different RHs
Figure 3 shows the PEMFC performance decay during CCTs, and the numerical values are summarized in Table II. Figures 3a–3c indicates the performance decay of the PEMFC during CCT-RH100. Interestingly, the performance of the degraded MEA after 30 min of CCT-RH100 was enhanced. Typically, the current density at a 0.7 V cell voltage slightly increased from 620 to 700 mA cm−2, even though the ECSA decreased from 53.7 to 48.4 m2 g−1, as shown in Figs. 3a, 3b and Table II. A sequential CCT-RH100 after an additional 0.5 h of CCT-RH100 (totally, 1 h) induced a decrease in the current density at 0.7 V to 632 mA cm−2 with the entire performance decay; however, this value is still higher than that of the fresh MEA, even though the ECSA value decreased to 41.6 m2 g−1, as shown in Figs. 3a, 3b and Table II. After that 1 h degradation process, the performance of the degrading cathode CL indicated continuous performance decay, showing a decrease in current density at a 0.7 V cell voltage to 188 mA cm−2 after 6 h of CCT-RH100 along with a decrease in the ECSA to 22.4 m2 g−1. During the degradation tests, the OCV showed a similar value (average of 0.958 V) as well as a similar reverse current density in the LSV curve, as shown in Fig. 3c, indicating that the mechanical solidity of the membrane was preserved. 10,31,39 For CCT-RH30 (Figs. 3d–3f), it also shows an initial performance enhancement, showing an increase in the current density at 0.7 V from 640 to 660 and 649 mA cm−2 after 0.5 and 1 h of CCT-RH30, respectively, followed by a decrease in the current density to 568 mA cm−2 after 6 h of CCT-RH30, whereas the ECSA continuously decreased from 52.8 to 34.1 m2 g−1 after 6 h of degradation tests, as shown in Figs. 3d, 3e and Table II. Similarly, during the degradation tests, the OCV showed a similar value (average of 0.957 V) as well as a similar reverse current density in the LSV curve, indicating that the mechanical solidity of the membrane was preserved, as shown in Fig. 3f.
Table II. Variation in the open circuit voltage and current density at a 0.7 V cell voltage and ECSA during CCTs under 100% and 30% RH conditions.
| Sample 1: Carbon corrosion reaction under 100% RH | fresh | 0.5 h | 1.0 h | 2.0 h | 3.0 h | 4.0 h | 5.0 h | 6.0 h |
|---|---|---|---|---|---|---|---|---|
| OCV (V) | 0.945 | 0.955 | 0.945 | 0.957 | 0.955 | 0.944 | 0.951 | 0.945 |
| Current density at a 0.7 V cell voltage (mA cm−2) | 620 | 700 | 632 | 580 | 440 | 332 | 296 | 188 |
| ECSA (m2 g−1) | 53.7 | 48.4 | 41.6 | 35.1 | 33.2 | 30.6 | 27.9 | 22.4 |
| Sample 2: Carbon corrosion reaction under 30% RH | fresh | 0.5 h | 1.0 h | 2.0 h | 3.0 h | 4.0 h | 5.0 h | 6.0 h |
| OCV (V) | 0.957 | 0.964 | 0.960 | 0.954 | 0.956 | 0.960 | 0.952 | 0.951 |
| Current density at a 0.7 V cell voltage (mA cm−2) | 640 | 660 | 649 | 639 | 608 | 640 | 580 | 568 |
| ECSA (m2 g−1) | 52.8 | 50.8 | 46.3 | 44.2 | 41.7 | 39.8 | 38.2 | 34.1 |
Even though the PEMFC performance is heavily related to the ECSA values of the Pt catalyst, 40 it was not enough for a direct connection since the decrease in the ECSA was not proportional to the PEMFC performance decay, as shown in Table II. Furthermore, the different performance decay rates of CCT-RH100 and CCT-RH30 as well as the abnormal enhancement in PEMFC performance in initial CCTs should be investigated and identified in more detail to understand the main cause of cell degradation. Since the various factors related to the structural properties of the CL could influence the performance and durability of PEMFCs, as shown in Eq. 4, we performed impedance analysis under both non-faradaic and faradaic processes to evaluate the evolution of structural properties, related to cell degradation, as shown in Figs. 4 and 5.
The non-faradaic capacitive impedance analyses were conducted under H2/N2 fed fuel cell systems under both 100 and 30% RH conditions. As seen in Fig. S2, the decreasing Rion values during 6 h of CCTs, measured under 100% RH conditions, were too small to be independently detected due to the interference of inductance effects and due to the continual decrease in the pore depth value () during CCTs in accordance with Eq. 7. Due to these experimental constraints, we compared capacitive analysis results measured under low 30% RH conditions, as shown in Figs. 4a–4c and Figs. 5a–5c. Whereas, the faradaic impedance analyzes were performed under 100% RH conditions, as shown in Figs. 4d–4f and Figs. 5d–5f, to compare the optimized performance of degrading MEAs.

Figure 4a shows the non-faradaic impedance analysis measured under 30% RH conditions during the entire CCT-RH100 after re-activation processes. First, the fresh MEA exhibits 0.103 and 0.30 Ohm cm2 of HFR and Rion, respectively, with the 53.7 Hz value under 30% RH condition, as shown in Figs. 4a, 4b and Table III. Those structural parameters (Rion, ) related to the porous electrode extracted in the high frequency region of Nyquist plots and imaginary capacitance () plots in Figs. 4a, 4b were used to estimate the double layer capacitance (Cdl) according to Eq. 11, and the calculation result is represented in Fig. 4c. Cdl could also be calculated by limiting value of real capacitance (C') plots (Fig. S3b) at low frequency according to Eq. 10. In the case of the fresh MEA, the Cdl values of the cathode CL calculated by Eq. 11 and Eq. 10 were identical to 0.025 F cm−2, as shown in Fig. 4c and Table III. During 0.5 and 1 h of CCT-RH100, imaginary capacitance (Fig. 4b) shows a slight increase in peak area along with the shift in to 48.7 and 56.3 Hz, respectively, and the Cdl calculated by Eq. 11 increased to 0.030 and 0.027 F cm−2, as shown in Figs. 4b, 4c and Table III. Here, those are distinctive results since both of the Rion and Cdl values are proportional to the pore length () value according to Eqs. 7, 10. Assuming that the intrinsic property of ionic resistance per unit length () is constant under specific RH conditions, a sequential decrease in Rion implies a gradual decrease in the value according to Eq. 7. In addition, it is reasonable to interpret that structural properties such as pore circumstance () or double layer capacitance per unit area () increased since the double layer capacitances increased with decreasing L value. Figure 3a and Fig. 4d indicate abnormally enhanced performance with decreasing Rct values from 0.85 to 0.75 and 0.79 Ohm cm2 after 0.5 and 1 h of CCT-RH100, respectively, whose values are fitted by the TLM model, as depicted in Fig. 4d and summarized in Table IV. Hence, considering the correlation between Rion and Rct according to Eq. 4, it could be concluded that the performance enhancement along with the decrease in Rct during 1 h of CCT-RH100 was attributed to an increase in pore circumference (). After 3 h of CCT-RH100, Rion decreased to 0.163 Ohm cm2, and the peak area in the imaginary capacitance plots decreased as shifted to 103.6 Hz, resulting in the 0.020 F cm−2 Cdl calculated by Eq. 11, as shown in Figs. 4a–4c. At this moment, Rion and Cdl decreased by 45.7 and 17.6%, respectively, in comparison with those of fresh conditions. Considering the increment rates of Rct (increased from 0.085 to 0.090 Ohm cm2, 5.9%) in Fig. 4e and Table IV, a high potential (1.4 V vs RHE) inducing carbon corrosion would result in faster decreasing rates in the pore depth than an increasing ratio in pore circumference, resulted in low evolution rates of Cdl and Rct compared to those of Rion and overall, entire capacity fading occurred as shown in Fig. 4c and Table III. With the continual increase in the pore circumference and decrease in pore depth of supporting carbon, Fig. 4f shows a slight increase in Warburg impedance (Wo) values from 0.10 (fresh MEA) to 0.13 Ohm cm2. In addition, the non-faradaic impedance results in Fig. S3a show that the gradient of steady upward curves in non-faradaic impedance plots was lowered during sequential CCT-RH100 stages and this behaviors are due to the gradually increased real impedance values (), implying that the capacitive properties of cathode CLs are gradually impaired. As a result, the difference between Cdl values obtained using Eq. 11 and Eq. 10 increased, as depicted in Fig. 4c and Table III, and this phenomenon represented the occurrence of leak current distribution during impedance measurements at low frequency, which could be confirmed by a slight increase in Cdl in low frequency regions in the real capacitance plot in Fig. S3b. Afterward, during an additional 3 h of sequential testing (6 h of CCT-RH100 in total), Fig. 4a shows a 0.085 Ohm cm2 of Rion and 0.014 F cm−2 of Cdl calculated by Eq. 11, whose decay rates are approximately 72.7 and 44.5%, respectively, in comparison with those of the pristine state. Typically, in accordance with the evolution rate of Rion and Cdl measured under 30% RH conditions after 6 h of the entire CCT-RH100, the Rion decreased by 3.53 times (from 0.30 to 0.085 Ohm cm2), and Cdl decreased by 1.79 times (from 0.025 to 0.014 F cm−2), as shown in Table III. Then, considering the correlation between Rion and Cdl (Eqs. 4, 10), it could be concluded that the decreasing ratio of pore depth is significant compared to the increasing ratio of pore circumference after 6 h of CCTs and, overall, resulted in entire capacity fading, as shown in Fig. 4c. Moreover, even though the HFR values, represented by the sum of the Rmem and Rele values, show nonlinear changes between 0.098 and 0.103 Ohm cm2 during 6 h of CCT-RH100, as shown in Fig. 4a and Table III, an approximately 0.1 Ohm cm2 HFR value was obtained, which is almost identical, implying that the electronic properties of the supporting carbon were relatively preserved during the entire 6 h of CCT-RH100. Along with the abrupt performance degradation shown in Fig. 3a, the Rct in the GEIS results measured at 50 and 200 mA cm−2 increased to 1.50 and 0.68 Ohm cm2, respectively, as shown in Figs. 4e, 4f. Moreover, Wo shows a distinct increase to 0.30 Ohm cm−2 at a current density of 200 mA cm−2, which is 3 times larger than that of the initial state. Thus, it is speculated that carbon corrosion-induced deformation of pore structures might accompany the water drainage issues, causing mass transfer problems. 41,42 In addition, the difference between Cdl values estimated at high and low frequencies using Eqs. 11 and 10, respectively, continuously increased during 6 h of CCT-RH100 as shown in Fig. 4c; thus, it is confirmed that subsidiary electrode degradation, such as current leakage, would be induced increasingly during CCT-RH100.


Table III. Variation in the impedance fitting results of non-faradaic impedance in Fig. 4a and the shift in peak frequency in Fig. 4b with respect to the calculated double layer capacitance of degrading supporting carbon using Eqs. 11 and 10.
| Sample 1: Carbon corrosion reaction under 100% RH | fresh | 0.5 h | 1.0 h | 2.0 h | 3.0 h | 4.0 h | 5.0 h | 6.0 h |
|---|---|---|---|---|---|---|---|---|
| HFR (Ohm cm2) | 0.103 | 0.098 | 0.098 | 0.098 | 0.098 | 0.103 | 0.103 | 0.103 |
| Ionic resistance (Ohm cm2) | 0.30 | 0.275 | 0.248 | 0.208 | 0.163 | 0.130 | 0.110 | 0.085 |
| Peak frequency (Hz) | 53.7 | 48.7 | 56.3 | 74.9 | 103.6 | 132.1 | 174.9 | 237.6 |
| Capacitance (F cm−2) (by Eq. 11) | 0.025 | 0.030 | 0.027 | 0.022 | 0.020 | 0.016 | 0.015 | 0.014 |
| Capacitance (F cm−2) (by Eq. (10)) | 0.025 | 0.030 | 0.029 | 0.026 | 0.024 | 0.023 | 0.021 | 0.020 |
Table IV. Impedance fitting results of the HFR, charge transfer resistance, and Warburg impedance for Nyquist plots in Figs. 4d–4f.
| GEIS: 50 mA cm−2 (Unit: Ohm cm2) | fresh | 0.5 h | 1.0 h | 2.0 h | 3.0 h | 4.0 h | 5.0 h | 6.0 h |
|---|---|---|---|---|---|---|---|---|
| HFR | 0.045 | 0.045 | 0.045 | 0.045 | 0.046 | 0.049 | 0.050 | 0.053 |
| Ionic resistance | 0.04 | 0.035 | 0.030 | 0.023 | — | — | — | — |
| Charge transfer resistance | 0.85 | 0.75 | 0.79 | 0.82 | 0.90 | 1.05 | 1.14 | 1.50 |
| GEIS: 200 mA cm−2 (Unit: Ohm cm2) | fresh | 0.5 h | 1.0 h | 2.0 h | 3.0 h | 4.0 h | 5.0 h | 6.0 h |
| HFR | 0.045 | 0.045 | 0.045 | 0.045 | 0.046 | 0.049 | 0.050 | 0.053 |
| Ionic resistance | 0.04 | 0.035 | 0.030 | 0.023 | - | - | - | - |
| Charge transfer resistance | 0.23 | 0.20 | 0.20 | 0.25 | 0.33 | 0.36 | 0.43 | 0.68 |
| Warburg impedance | 0.10 | 0.10 | 0.10 | 0.10 | 0.13 | 0.16 | 0.19 | 0.30 |
Similarly, CCT-RH30 induced the sequential degrease in the Rion value, as shown in Fig. 5a. During 1 h of CCT-RH30, Figs. 5a, 5b shows the decrease in Rion from 0.325 to 0.275 Ohm cm2 along with an increase in the peak area with the enhanced performance of the MEA, as shown in Fig. 3d. For the same reasons as in the CCT-RH100 case, the abnormal enhancements in cell performance seem to be induced by the increase in pore circumference as Cdl increased from 0.029 to 0.030 F cm−2 during the decrease in Rion, as shown in Fig. 5c and Table V. Since then, both Rion and Cdl gradually decreased with the positive shift in however, the decreasing rates of these values were lower than those of the CCT-RH100 case, meaning that the evolution rates of structural factors decreased with the relieved degradation rates of PEMFC performances. After 6 h of CCT-RH30, Rion decreased from 0.325 to 0.183 Ohm cm2 (43.7%), and Cdl calculated by Eq. 11 decreased from 0.029 to 0.020 F cm−2 (30.2%) in comparison with that determined under fresh MEA conditions, as shown in Figs. 5a, 5c and Table V. Comprehensively, due to the lower deformation rates in pore structures under the dehydration (30% RH) conditions, the performance of the degrading MEA under CCT-RH30 could be well-preserved with the near identical Rct value, as shown in Figs. 5d, 5e, even though Wo slightly increased from 0.08 to 0.11 (138%) at a current density of 200 mA cm2 after 6 h of CCT-RH30, as shown in Fig. 5f and Table VI. The difference between both Cdl values (double layer vs real) calculated by Eq. 11 and Eq. 10 increased for 6 h of CCT-RH30, as shown in Fig. 5c and Table V, even if the cell decay was slight. This result is consistent with the real capacitance plots in Figs. S3c, S3d, which also show gradual increase in real impedance () as frequency shift in low region and a steep slope of real capacitance with frequency at low frequency, implying that the CCT under dehydration conditions causes leakage current through the MEA. This is speculated to be due to repeated ionomer de/hydration, as demonstrated in Fig. 2b.


Table V. Variation in the impedance fitting results of non-faradaic impedance in Fig. 5a and the shift in peak frequency in Fig. 5b with respect to the calculated double layer capacitance of degrading supporting carbon using Eqs. 11 and 10.
| Sample 2: Carbon corrosion reaction under 30% RH | fresh | 0.5 h | 1.0 h | 2.0 h | 3.0 h | 4.0 h | 5.0 h | 6.0 h |
|---|---|---|---|---|---|---|---|---|
| HFR (Ohm cm2) | 0.103 | 0.103 | 0.098 | 0.098 | 0.098 | 0.103 | 0.103 | 0.103 |
| Ionic resistance (Ohm cm2) | 0.325 | 0.30 | 0.275 | 0.263 | 0.255 | 0.215 | 0.188 | 0.183 |
| Peak frequency (Hz) | 43.0 | 43.4 | 48.8 | 52.8 | 61.5 | 775.4 | 97.7 | 109.6 |
| Capacitance (F cm−2) (by Eq. 11) | 0.029 | 0.031 | 0.03 | 0.029 | 0.026 | 0.024 | 0.022 | 0.020 |
| Capacitance (F cm−2) (by Eq. 10) | 0.029 | 0.032 | 0.032 | 0.031 | 0.029 | 0.029 | 0.028 | 0.026 |
Table VI. Impedance fitting results of the HFR, charge transfer resistance, and Warburg impedance for Nyquist plots in Figs. 5d–5f.
| GEIS: 50 mA cm−2 (Unit: Ohm cm2) | fresh | 0.5 h | 1.0 h | 2.0 h | 3.0 h | 4.0 h | 5.0 h | 6.0 h |
|---|---|---|---|---|---|---|---|---|
| HFR | 0.045 | 0.043 | 0.043 | 0.043 | 0.044 | 0.044 | 0.044 | 0.045 |
| Ionic resistance | 0.042 | 0.039 | 0.037 | 0.034 | 0.032 | 0.031 | 0.027 | 0.024 |
| Charge transfer resistance | 0.82 | 0.80 | 0.82 | 0.83 | 0.083 | 0.83 | 0.82 | 0.82 |
| GEIS: 200 mA cm−2 (Unit: Ohm cm2) | fresh | 0.5 h | 1.0 h | 2.0 h | 3.0 h | 4.0 h | 5.0 h | 6.0 h |
| HFR | 0.045 | 0.043 | 0.043 | 0.043 | 0.044 | 0.044 | 0.044 | 0.045 |
| Ionic resistance | 0.042 | 0.039 | 0.037 | 0.034 | 0.032 | 0.031 | 0.027 | 0.024 |
| Charge transfer resistance | 0.23 | 0.22 | 0.21 | 0.20 | 0.22 | 0.22 | 0.23 | 0.23 |
| Warburg impedance | 0.08 | 0.08 | 0.08 | 0.08 | 0.09 | 0.10 | 0.11 | 0.11 |
To further investigate the degrading components, we re-assembled the single cell using a fresh MEA and the degraded GDL used for 6 h of CCT-RH100 to identify the effects of the carbon corrosion reaction on the degradation of GDLs. Figures 6a, 6b shows the recovered i–V performance and non-faradaic impedance result for Rion after the deteriorated MEA was replaced with a fresh MEA. The result indicates that the carbon corrosion reaction would not only induce the performance decay of fuel cells caused by structural deformation inside the cathode CL, as demonstrated in Figs. 3 and 4, but also, slightly increase the ohmic resistance of the GDL. However, the aged GDL hardly affected the major internal resistance components, such as the charge transfer resistance and Warburg impedance, as shown in Figs. 6c, 6d.
Postmortem surface analysis of fresh and deteriorated MEAs
To identify the different behaviors in the deterioration of the carbon structure and performance decay, we performed surface microscopic analyses for fresh and deteriorated MEAs after 6 h of CCTs under different 100 and 30% RH conditions. Figure 7a shows well-dispersed Pt nanoparticles of 3.25 nm sizes calculated by the Scherrer's equation using the Pt (111) planes in the XRD analysis, as shown in Fig. 7b. For deteriorated Pt/C after the 100% RH degradation test, the TEM image of Pt catalysts on the supporting carbon (Fig. 7c) is consistent with the XRD result, showing 5.42 nm Pt nanoparticles, as shown in Fig. 7d. Carbon corrosion would induce increased Pt particle size and detachment, resulting in Pt agglomeration and Pt mass loss as well as an ECSA decrease, 43,44 followed by PEMFC performance decay and ECSA decreases, as shown in Figs. 3a, 3b. In the case of degradation at 30% RH, Fig. 7e shows alleviated agglomeration rates in comparison with the results from the 100% RH test, showing Pt particle sizes of 4.80 nm in the XRD peak analysis, as shown in Fig. 7f, resulting in lower decrease rates of the ECSA, as shown in Fig. 3e. Further investigation of degraded electrode was performed by X-ray photoelectron spectroscopy (XPS), as shown in Fig. S4. Figure S4 shows the C 1s spectra for fresh and aged cathode CLs after 6 h of CCT-RH100 and CCT-RH30, respectively, and the binding energy related to each functional group in C 1s spectra with distribution of the deconvoluted peak area including carbon-oxygen functional groups are summarized in Table SI. Compared to the fresh MEA, C 1 s spectra of degraded MEAs under 100 and 30% RH conditions show the decreased distribution area of C–C bond from 37.8 (fresh MEA) to 34.5 and 36.7%, respectively, with the increase in carbon-oxygen functional groups, as shown in Table SI. Corresponding with the fast performance decay rates during CCTs under saturated RH conditions, sufficient water assisted carbon corrosion reaction would cause a significant increase in atomic ratio of O 1s and C 1s (O/C) from 0.17 (fresh MEA) to 0.32 as shown in Table SII. Thus, it is concluded that the high potential inducing carbon corrosion reaction causes the structural deformation of porous electrode (decrease of pore depth with increase of pore circumference) as well as evolutions of the oxygen-functional groups on carbon surfaces, resulting in a water drainage issue including severe performance degradation of PEMFCs. 45,46
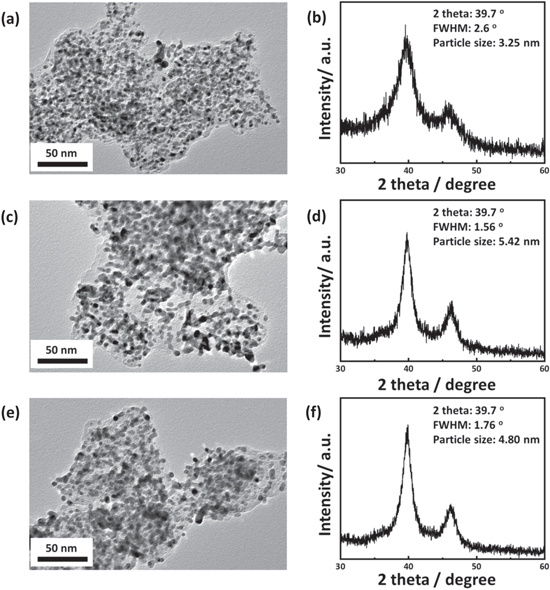
Figure 7. TEM bright field images and XRD analyses, with particle size calculation results obtained using the Pt (111) planes of (a), (b) pristine and degraded cathode CLs after 6 h of CCTs under (c), (d) 100% and (e), (f) 30% RH conditions.
Download figure:
Standard image High-resolution imageFigure 8 shows SEM images of the cathode electrode and GDL before (pristine) and after 6 h degraded under different RH conditions. Compared to that of the pristine electrode (Fig. 8a), the image of the electrode surface degraded under 100% RH conditions showed a crumbled carbon structure (Fig. 8b), with a 30.1% decrease in the average cathode CL thickness from 8.077 to 5.576 μm. However, the postmortem image of the electrode surface degraded under low humidity conditions (Fig. 8c) showed relatively well-preserved porous structures, with a decrease of cathode CL to 5.769 μm (28.6%). Whereas, as shown in the GDL images in Figs. 8a–8c, there were no significant differences between fresh and deteriorated GDLs after the degradation test because the GDL composed of graphitized carbon typically represents the lower reaction order of the carbon corrosion reaction, 47 meaning that the carbon corrosion test mainly affects MEA deterioration, especially deteriorating the supporting carbon structure of CLs.

Figure 8. SEM cross-section and surface images of the (a) pristine CL and fresh GDL, and degraded cathode CL and aged GDL after 6 h of CCTs under (b) 100% and (c) 30% RH conditions.
Download figure:
Standard image High-resolution image
Conclusions
We applied an external potential (1.4 V vs RHE) under 100 and 30% RH conditions to explore the degradation mechanism of the supporting carbon structure under saturated and low humidity conditions. TLM-based impedance analyses adopting complex capacitance were conducted for the degradation mechanism numerical analysis. Through TLM-based complex capacitance analysis, the correlation between ionic resistance and double layer capacitance associated with charge transfer resistance could reflect the variation in structural properties such as pore depth and circumference. Specifically, the high potential (1.4 V vs RHE) causes a decrease in pore depth with an increase in pore circumference through carbon corrosion. Deformation of supporting carbon could enhance the cell performance in the initial degradation process; however, the continual changes in pore structure with the evolution of oxygen functional groups on the supporting carbon surfaces could cause incidental matter, namely, flooding issues, due to the problematic water management. It was notable that the deformation rates of the pore structure as well as the rates of performance decay depended on the relative humidity condition due to different degradation mechanisms according to the water content. For CCT-RH100, the dominant oxidation reaction was a carbon corrosion reaction, causing the structural deterioration of supporting carbon with a drastic performance decay. However, in the case of CCT-RH30, a significant proportion of the oxidation reaction was governed by the OER. Hence this shows a relatively low degradation rate in CCTs, even if it might eventually lead to severe ionomer dehydration. Last, carbon corrosion slightly increased the HFR of aged GDL but did not increase the charge and mass transfer resistances, indicating that GDL degradation in the MEA was a minor issue in comparison to that of the catalyst layer.
Acknowledgments
This work was supported by the New & Renewable Energy Core Technology Program of the Korea Institute of Energy Technology Evaluation and Planning (KETEP) granted financial resource from the Ministry of Trade, Industry & Energy, Republic of Korea (No. 20173010032150).