

Abstract
In this work, high-surface-area nanoporous nickel hydroxide (Ni(OH)2) was one-pot electrodeposited by a dynamic hydrogen bubble template formed through facile water electrolysis. The as-obtained nanoporous Ni(OH)2 exhibited a visible light response semiconducting behavior with an optical band gap of 2.17 eV, as estimated by the Tauc methodology. The Mott-Schottky plot estimated the valence band (EVB) and conduction band (ECB) energies of the nanoporous Ni(OH)2 to −6.14 and −3.97 eV, respectively. The effects of visible light irradiation of nanoporous Ni(OH)2 film on methanol oxidation (MOR) and hydrogen evolution (HER) reactions were investigated in alkaline solutions. Compared to data obtained under dark, the potentiodynamic linear sweep voltammetry (LSV) and potentiostatic chronoamperometry (CA) results revealed remarkable enhancements in MOR and HER current responses using nanoporous Ni(OH)2 electrode under visible light, reaching up to 59% and 153%, respectively. The superior photoelectrochemical performances of the nanoporous Ni(OH)2 film toward MOR and HER were attributed to the high surface area, narrow band gap, low electron/hole recombination, and elevated light absorption efficiency induced by multiple reflection and scattering of incident light. In sum, the high photoelectrocatalytic performances of the nanoporous Ni(OH)2 combined with the low material cost and facile production make it promising for various electrochemical reactions with better reaction rates under visible light irradiation.
Export citation and abstract BibTeX RIS
Sunlight is a free, sustainable, and clean energy source, in which the visible spectrum accounts for about 44%. 1 As a result, visible light is widely used in electrocatalysis to solve energy-related issues. 2–5 Unlike direct conversion of sunlight to electrical energy by solar cells, photoelectrocatalysis utilizes sunlight to improve the efficiency of electrochemical reactions without necessary conversion to electricity. In other words, solar cells require effective p-n junctions, making their utilization more complex and costly. By comparison, photoelectrocatalysis could work on a single-component p- or n-type photoresponsive semiconductor. Furthermore, in photoelectrocatalysis, hole/electron pairs in a semiconductor generated by photon absorption may effectively be separated by applying an external potential to prevent fast recombination of holes and electrons. This allows the high-efficiency utilization of sunlight.
Meanwhile, the separated holes or electrons in semiconductors exposed to light illumination have been found serviceable to chemical oxidation or reduction reactions. 6 However, high-performance and inexpensive photoelectrocatalysts are still limited. Therefore, finding novel semiconductor photoelectrocatalysts with appropriately low band gaps, and effective valence and conduction band levels is highly desirable in photoelectrochemistry.
Numerous photoelectrocatalysts responsive to visible light 7 have so far been reported, including TiO2 hybrids, 8–15 WO3, 16,17 C3N4, 18 Fe2O3, BiVO4, 19 and BiIO, 20 among others. 3 To tune the overall performances of the photoelectrocatalytic reactions, 21 hybrid co-catalysts were frequently used Ni(OH)2 as earth-abundant and inexpensive co-catalyst materials. 22–27 However, individual Ni(OH)2 is scarcely studied as a photoelectrocatalyst under visible light illumination for fundamental applications. 28 Besides, the efficiency of individual Ni(OH)2 as a photoelectrocatalyst remains unknown. Hence, investigating the effectiveness of individual Ni(OH)2 in photoelectrocatalysis is of great interest to many applications.
In this work, the photoelectrocatalytic properties of nanoporous Ni(OH)2 were explored under visible light illumination. The results showed that nanoporous Ni(OH)2 film exhibited excellent photoelectrocatalytic performances toward MOR and HER under visible light illumination.
Materials and Methods
Nickel(II) chloride hexahydrate (NiCl2·6H2O), sodium hydroxide (NaOH), sodium sulfate (Na2SO4), and boric acid (H3BO3) were all purchased from Alfa Asear (China). In addition, Pt and Au disc electrodes (diameter 2 mm) were received from Gaossunion (China). All chemicals were of analytical reagent grade and used as received without further purification. The aqueous solutions were prepared with deionized (DI) water (≥18.2 MΩ·cm) obtained from a Milli-Q water purification system.
All electrochemical experiments were conducted on an electrochemical workstation P4000 (Princeton Applied Research, USA). The electrochemical impedance spectra were acquired on an electrochemical workstation IM6ex (Zahner, Germany). A gold (Au) disc electrode (diameter 2 mm) was used as a substrate electrode. Ag/AgCl(3 M KCl) was employed as a reference electrode, and a graphitic carbon rod (diameter 5 mm) was applied as an auxiliary electrode. UV-Vis-NIR spectrophotometer (Cary-5000, Agilent, USA) equipped with an integrating sphere was utilized to acquire the spectra during light absorption experiments. A Xenon lamp light source (HDL-II, BOBEI, China) with a built-in visible light-pass (370–780 nm) filter was used to investigate the photoresponsive behavior of the as-prepared films. X-ray photoelectron spectroscopy (XPS, 5000C ESCA System, PHI, USA) was used to study the surface chemical states. Field emission scanning electron microscopy (FESEM, Hitachi S-4800, Japan) was used to observe nanoporous Ni(OH)2. Energy-dispersive X-ray spectroscopy (EDX, HORIABA EX-250, HORIABA, Japan) was employed for the evaluation of the elemental ratio within nanoporous Ni(OH)2. High-resolution TEM (HR-TEM) images were collected on a JEOL-2100F transmission electron microscope (JEOL Ltd, Akishima, Tokyo, Japan) at an acceleration voltage of 200 kV. Gas chromatograph (GC, 7890B, Agilent, USA) with FID detector, TDX-01 column, and N2 carrier gas was used to measure methanol concentration in the electrolyte.
The pretreatment of the gold disc electrode was completed by sequentially polishing with 1.0, 0.3, and 0.05 μm alumina powders, followed by washing with deionized water and ethanol under sonication (5 min for each process).
Solid Ni film was directly electrodeposited from a solution containing 8 g l−1 H3BO3 and 25 g l−1 NiCl2·6H2O under an applied voltage of −1.0 V. The obtained film was then electrochemically oxidized by using a sweep potential in 1 M NaOH for 3 h from −0.2 to 0.8 V at the scan rate of 100 mV s−1.
Nanoporous Ni(OH)2 film was formed by deposition from a solution containing 25 g l−1 NiCl2·6H2O at −1.0 V. 29 The thickness of nanoporous Ni(OH)2 was controlled by changing the amount of electricity passed through the system during electrodeposition. A typical nanoporous Ni(OH)2 film obtained at 1.3 C cm−2 was used throughout the work.
The CV curves of the as-obtained films were obtained in 1 M Na2SO4 by varying the scan rate from 10 to 100 mV s−1 with 10 mV interval at the open circuit potential (OCP) and amplitude of 0.05 V. The linear plot of current density at OCP vs scan rate was then obtained. Note that the slope of the derived equation from the plot reflected the electrochemical capacitance, which was proportional to the electrochemically active surface area and can directly be used to compare the surface areas of the electrodes.
Hydrogen gas was collected by water displacement in a plastic graduated cylinder. Because the hydrogen gas was collected over water, the pressure of hydrogen gas was obtained by subtracting the contribution of the water vapor based on Dalton's law. The volume of hydrogen gas was calculated using the combined gas law. The temperature of the electrolyte and room was controlled at 25 °C. The faradaic efficiency for HER was calculated based on Eq. 1.

Where NA = 6.02*1023 mol−1, e = 1.6*10−19 C, Q, the charge amount passed during HER.
The concentration of methanol in the electrolyte before and after MOR was evaluated by GC. The Faradaic efficiency of MOR was calculated using Eq. 2.

Where C1 is initial methanol concentration, and C2 is methanol concentration after MOR, V represents the volume of the electrolyte solution.
The diffuse reflection spectroscopy (DRS) of as-synthesized nanoporous Ni(OH)2 film was carried out using BaSO4 as a blank reference. The sample was scrapped from the electrode and compressed onto a holder with BaSO4 as a background for DRS measurement. The obtained reflectance was transformed into absorbance for use.
The Mott-Schottky measurements were performed by AC electrochemical impedance spectroscopy on a PARSTAT 4000. The conditions were pH 7 electrolyte, AC amplitude of 10 mV, and applied frequency of 1 kHz. Note that space charge capacitance C may vary with the applied potential over the depletion layer as determined by the Mott-Schottky Eq. 3 for p-type semiconductors:

where e refers to the electron charge, εr is the dielectric constant, ε0 denotes the permittivity of a vacuum, NA is the acceptor density, E represents the applied bias, EFB is the flat band potential, k refers to the Boltzmann constant, T is room temperature, and A is the surface area of the film in contact with the electrolyte.
The plot of C−2 vs E would yield a straight line with a slope that can be used to determine NA. The slope can be quantified as 2/e0 ε0 εrNAA2. Using the above equation, the flat band potential was determined from the intercept with the x-axis on the linear plot of C−2 vs E (against Ag/AgCl reference). The position of the valence band (Ev ) was determined from Eq. 4 describing p-type semiconductors:

where Nv represents the effective density of states (typically ∼1019) at the valence band edge.
Results and Discussion
Electrodeposition and characterization of nanoporous Ni(OH)2
Electrodeposition
In this work, nanoporous Ni(OH)2 was one-pot electrodeposited by applying a proper electrode potential (−1.0 V vs Ag/AgCl) to an aqueous solution containing a single solute NiCl2·6H2O. During this process, water electrolysis took place without the reduction of Ni2+. Also, the generated hydrogen bubbles and hydroxide ions (Eq. 5) during water electrolysis at the cathode played important roles in dynamic templates and precipitants, respectively. As a result, large amounts of nanopores were readily formed in Ni(OH)2 film. Further details about the synthetic procedures and principles of nanoporous Ni(OH)2 can be found in our previous publication. 29

Composition
The composition of the deposit was confirmed by energy dispersive spectroscopy (EDS) and X-ray photoelectron spectroscopy (XPS). The atomic ratio of Ni and O determined by EDS spectroscopy was around 1:2, suggesting a compound composed of Ni(OH)2, but neither Ni (1:0) nor NiO (1:1) was formed. The identity of the product was verified by Ni2p, showing the primary region in the XPS profile (Fig. 1B). The binding energy of 855.6 eV corresponded to Ni2p3/2 of Ni(OH)2, which differed from multiplet-split in NiO (853.7 eV, NIST X-ray photoelectron spectroscopy database). The Ni2p peaks showed significantly split spin-orbit components (Δmetal = 17.3 eV), as displayed by the presence of satellite peaks at 878.5 eV and 872.9 eV for Ni2p1/2 of Ni(OH)2. The binding energies of each chemical state well matched those of the standard Ni(OH)2 sample. XRD was further used to trace the identity of the chemical structures. No peaks were observed in the XRD spectra (data not shown) due to the amorphous nature of the deposit obtained by the dynamic hydrogen bubbles template in a disordered manner.

Figure 1. (A) SEM image of a typical nanoporous Ni(OH)2 sample. (B) Ni2p XPS spectrum of nanoporous Ni(OH)2. (C) Barrett-Joyner-Halenda (BJH) pore size distribution of nanoporous Ni(OH)2. (D) HR-TEM image of a typical nanoporous Ni(OH)2 fragment. (E) Cyclic voltammograms of nanoporous (black) and smooth (red) Ni(OH)2 in 1 M NaOH electrolyte at a scan rate of 50 mV s−1. (F) Comparison of the electrical double layer capacitance between nanoporous Ni(OH)2 and smooth Ni(OH)2 in 1 M Na2SO4.
Download figure:
Standard image High-resolution imageThe nanoporosity and surface area of the as-synthesized Ni(OH)2 are critical in high-performance photoelectrocatalysis applications. Hence, the compound was further characterized by various analytical techniques.
Nanopore visualization by electron microscopy
The surface morphology of the as-synthesized Ni(OH)2 is displayed in Fig. 1A. Note that the sample was supported on Au substrate to carry out in-situ morphological observation without destroying the as-synthesized Ni(OH)2 film structure. The presence of surface curvature and some nanoscale dents or holes (yellow circles) indicated the evolution of hydrogen bubbles, leading to the formation of nanopores inside the film. The nanoporosity was not clearly visible in SEM imaging due to the limited resolution caused by the semiconducting nature of Ni(OH)2. Such limitation could be compensated by using TEM with higher resolution. The TEM image in Fig. 1D illustrated disordered, irregular nanoscale pores or slits in a fragment of the sample. These pore sizes were similar to those derived from the BJH method.
Identification of pore size distribution by BJH method
The N2 sorption/desorption as a non-destructive technique was used to investigate the pore size distribution and specific surface area of the as-synthesized Ni(OH)2. The Barrett-Joyner-Halenda (BJH) pore size distribution curves obtained by N2 adsorption showed the as-synthesized Ni(OH)2 to possess pores less than 10 nm in diameter (Fig. 1C). The non-uniform size distribution of the pores in as-synthesized Ni(OH)2 resulted from the random and dynamic hydrogen bubble templates. The specific surface area of as-synthesized nanoporous Ni(OH)2 film was as large as 37.7 m2 g−1. Hence, the BJH method provided more detailed and accurate information about the porosity of the structure than SEM and TEM.
Determination of surface area by electrochemical measurements
Two techniques were further used to explore the high surface area brought by the nanopores embedded in the as-synthesized Ni(OH)2 film. The electrochemical surface area (ECSA) accessible to ions in the electrocatalyst can be estimated by comparing the redox peak areas in cyclic voltammetry curves relative to ECSA of a flat surface. Here, the ECSAs obtained from the area of each peak around 0.4 V in the CV curves of nanoporous and smooth Ni(OH)2 films were compared (Fig. 1E). The anodic peaks around 0.4 V corresponded to the oxidation of Ni(OH)2 (Eq. 6). 30 The comparison showed that ECSA of the nanoporous Ni(OH)2 film was about 180-fold higher than that of the solid smooth Ni(OH)2 film. Thus, the as-fabricated Ni(OH)2 film was porous with a significantly enhanced surface area compared to a smooth Ni(OH)2.

The electrical double layer capacitance 31 was also employed to evaluate the surface area of the electrocatalysts. Fig. 1F illustrates the plots obtained at different scan rates as a function of current densities (extracted from cyclic voltammetry). Note that these data were acquired using ±50 mV deviation from the OCP, which could not cause faradaic redox reactions. The currents under such conditions originated only from the charging/discharging processes of the electrical double layer. Therefore, the slopes of the derived equations (panel) representing the electrical double layer capacitance would theoretically be proportional to the ECSA of the electrode material. The ratio of the slopes between the nanoporous and smooth Ni(OH)2 was estimated to 171, a value similar to that obtained by peak area contrast (∼180, Fig. 1E). Since the small electrochemical signals obtained on smooth Ni(OH)2 were negligible, most characterizations of the smooth Ni(OH)2 were not systematically presented for clarity.
In sum, all characterizations from BJH, TEM, SEM, and electrochemical measurements suggested the formation of nanoporous Ni(OH)2.
Photoresponse of semiconductive nanoporous Ni(OH)2
We employed DRS methodology to investigate the photoresponsive properties of the as-synthesized nanoporous Ni(OH)2 film. The optical absorption behavior of nanoporous Ni(OH)2 powder scraped away from the Au disk substrate electrode is shown in Fig. 2A. The visible light was absorbed by the nanoporous Ni(OH)2 powder in a wide wavelength range, with maximum absorbance noticed at 734 nm. The absorption in a broad range of wavelengths can be attributed to the anisotropic structure, causing various defects like point, line, and planar ones. 32,33 On the other hand, the presence of multiple reflections of incident light inside the nanoporous film improved the absorption efficiency and facilitated the transition of electrons from the valence band to the conduction band of Ni(OH)2.
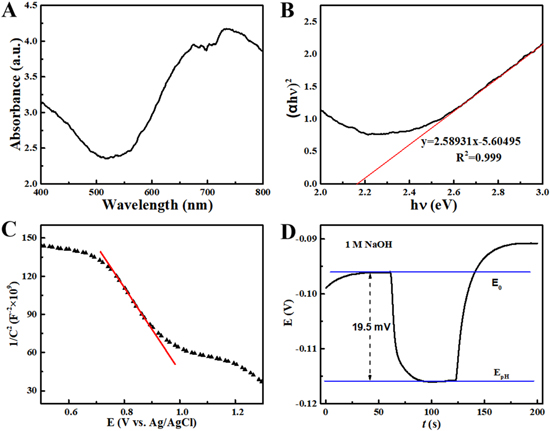
Figure 2. (A) Diffuse reflectance spectrum. (B) Tauc plot. (C) Mott-Schottky plot. (D) Open circuit photopotential measured in 1 M NaOH under 150 mW cm−2 visible light illumination.
Download figure:
Standard image High-resolution imageThe Tauc method 34 was used to evaluate the optical band gap of the nanoporous Ni(OH)2 using Eq. 7.

where α represents the absorption coefficient of the material. hv expresses the photon energy, with h refers to the Planck constant and ν denotes the photon's frequency. A is a constant related to a band tailing parameter, and Eg represents the optical band gap energy. n relates to the electron transition nature in a semiconductor, where n = 1/2 indicates direct band gap and n = 2 indirect band gap semiconductors.
For Ni(OH)2 semiconductor with a direct band gap, 35,36 the value of band gap energy estimated by the interception of the linear fit in the Tauc plot along the x-axis was 2.17 eV (Fig. 2B). The optical band gap of the as-synthesized Ni(OH)2 was smaller than most in the literature (2.17 ∼ 5.6 eV). 22,36–40 The optical band gaps of nanomaterials usually show the discrepancy based on the synthetic and post-treatment methods, crystallinities, and grain sizes. The significant difference in optical band gap between nanoscale and bulk Ni(OH)2 has been found by Nagli et al. 36 The lowest-lying states of the conduction band were thought to be responsible for the lower band gap of nanoscale Ni(OH)2 compared to bulk ones. The optical band gap obtained in this work was reasonable by taking account of precipitation synthesis and nanoporous structure.
The band structures of photoelectrodes are useful for studying photoelectrochemical reactions, often evaluated by the Mott-Schottky plot. 41–46 Here, the Mott-Schottky plots were obtained by plotting the inverse of square root (C−2 ) of the capacitance extracted from the electrochemical impedance spectra as a function of the applied potential (E). As shown in Fig. 2C, the intercept of the longest straight line along the x-axis was estimated to 1.20 V, reflecting flat band energy (EFB, vs Ag/AgCl) 47 as an approximation of Fermi energy level at a semiconductor. The negative value of the slope suggested a p-type nanoporous Ni(OH)2 semiconductor. 48 The valence and conduction band edges of nanoporous Ni(OH)2 estimated by the Mott-Schottky formula (Eq. 3) were 1.50 V and −0.67 V (vs Ag/AgCl), respectively. Using Ag/AgCl electrode as a reference, the conduction and valence band positions were calculated as respectively −3.97 eV and −6.14 eV. 49
The photoresponsivity of a semiconductor can directly be confirmed by the change in open circuit potential under light illumination in a proper electrolyte. The obtained open circuit photopotentials are gathered in Fig. 2D. In 1 M NaOH electrolyte, a negative open circuit photopotential of ∼19.5 mV was recorded under visible light illumination. By contrast, the Au base electrode showed an open circuit photopotential of 82 μV under the same test condition. The cathodic shift in open circuit photopotential implied a p-type nanoporous Ni(OH)2 semiconductor. Also, the open circuit photopotential was much smaller than that of a typical photocatalyst like TiO2 (>400 mV 50 ). Thus, as-synthesized nanoporous Ni(OH)2 cannot be employed as an effective photocatalyst due to its inability to drive redox reactions under visible light illumination without a bias potential. This agreed well with the experimental results, showing no current detected under visible light illumination without applying external electrode potential.
On the other hand, the photoresponsive properties of nanoporous Ni(OH)2 can be helpful in the photoelectrocatalysis of specific chemical reactions. Typical examples of energy conversion reactions include the MOR and HER, which were tested under visible light and dark conditions on the as-synthesized nanoporous Ni(OH)2.
Photoelectrocatalytic oxidation of methanol on nanoporous Ni(OH)2
Methanol is a promising fuel to convert into energy by fuel cells due to its easy production and high energy density combined with safe storage, transportation, and usage. However, the oxidation reaction of methanol is challenging without effective catalysts to lower the energy barriers. So far, numerous studies have reported high catalytic activity and low cost of Ni(OH)2 catalyst toward MOR in alkaline electrolytes. 51,52 In terms of photo-responsivity of nanoporous Ni(OH)2, our group was the first to propose that sunlight may enhance the reaction rate of electrochemical MOR. As a result, the effect of visible light on MOR by nanoporous Ni(OH)2 catalyst was investigated in depth.
Here, the nanoporous Ni(OH)2 catalyst functioned as a strong oxidant. The catalysis by Ni(OH)2 would form NiOOH and restore the initial state (i.e., reverse reaction) at the anode, according to Eq. 6. LSV curves of methanol oxidation were first acquired from 0.3 V to 0.8 V (vs Ag/AgCl) at 50 mV s−1. As shown in Fig. 3A, the peak associated with the conversion of Ni(OH)2 to NiOOH in 1 M NaOH electrolyte appeared at 0.46 V in the absence of methanol. By comparison, the peak shifted to a higher potential in the presence of 2 M methanol, while the peak current above 0.46 V significantly increased due to oxidation of methanol molecules, according to Eq. 8.

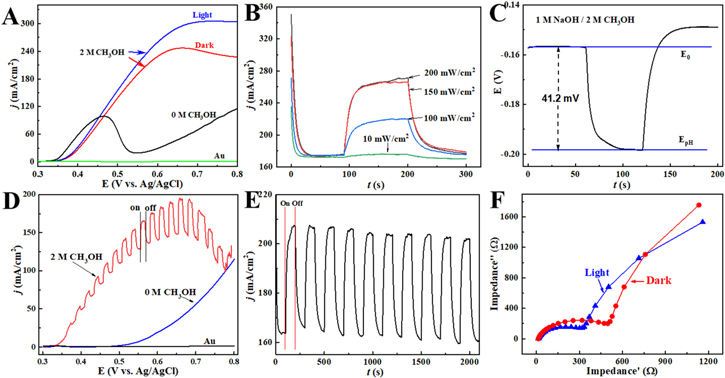
Figure 3. (A) Linear sweep voltammograms of methanol electro-oxidation on nanoporous Ni(OH)2 under dark and light illumination at the scan rate of 50 mV s−1. (B) I-t diagrams of nanoporous Ni(OH)2 electrode at 0.6 V under different intensities of visible light illumination. (C) Open circuit photopotential of nanoporous Ni(OH)2 electrode. (D) Linear sweep voltammograms under intermittent light illumination at the scan rate of 0.1 mV s−1. (E) I-t diagrams at 0.6 V under intermittently visible light illumination of repeated tests. (F) Nyquist plot (0.1–100 kHz) of nanoporous Ni(OH)2 electrode under dark and light illumination. Conditions: electrolyte containing 1 M NaOH and 2 M methanol.
Download figure:
Standard image High-resolution imageUnder visible light illumination of nanoporous Ni(OH)2, the current level of MOR improved when compared to the signal obtained under dark. The negligible current signal was induced by the substrate Au electrode. Thus, the visible light triggered a photoelectrocatalytic effect, leading to elevated kinetics of MOR.
Second, chronoamperometry was used to evaluate the photoresponsive properties of nanoporous Ni(OH)2 by varying the intensity of visible light (Fig. 3B). These tests were performed in 1 M NaOH electrolyte containing 2 M methanol under visible light (10 mW cm−2) at a constant potential of 0.6 V for a 100 s illumination period. A small increase in current density was noticed under low-intensity light illumination. As light intensity rose to 100 and 150 mW cm−2, the current densities of methanol oxidation at 0.6 V significantly improved by 28% and 59% compared to the results obtained under dark. Also, saturation was observed at a light intensity of 200 mW cm−2, where no further enhancement in the current density of methanol oxidation was visible. Interestingly, the open circuit photopotential increased to 41.2 mV under visible light illumination of 150 mW, equivalent to a 2-fold enhancement than that without methanol (Fig. 3C). In sum, light illumination was beneficial for the separation of electrons and holes.
As shown by slow-scanning at 0.1 mV s−1 (blue curve in Fig. 3D), the change in current density of MOR looked negligible under visible light illumination of the nanoporous Ni(OH)2 in the absence of methanol. The intermittently visible light illumination of the nanoporous Ni(OH)2 led to fluctuations in current response in the presence of 2 M methanol in the electrolyte (red curve in Fig. 3D). The current enhancement for MOR varied from 7% at 0.37 V to 63% at 0.70 V.
The light illumination of nanoporous Ni(OH)2 was repeated for ten cycles. At a constant potential of 0.6 V, the nanoporous Ni(OH)2 exhibited a good response under the intermittent visible light (150 mW cm−2) illumination (Fig. 3E). Hence, visible light illumination of the nanoporous Ni(OH)2 improved the kinetics of MOR in alkaline electrolytes. Therefore, sunlight can potentially be used to enhance the performance of direct methanol fuel cells.
To investigate the mechanisms behind the influence of visible light on nanoporous Ni(OH)2, EIS data were collected in 1 M NaOH electrolyte containing 2 M methanol at frequencies from 0.1 to 100 kHz. The resulting Nyquist plots were analyzed to scrutinize the internal resistance and interfacial charge transfer resistance. As shown in Fig. 3F, the diameter of the semicircle arc at high frequencies under visible light illumination (345 Ω) was markedly smaller than that without light illumination (558 Ω). This suggested an accelerated charge transfer in the light-illuminated electrode. In a control experiment, minor changes in impedance values were observed in the absence of Ni(OH)2 on the Au substrate. Thus, the variation in impedance of the system was mainly attributed to the large amounts of inter-band free-flowing electrons generated under visible light illumination and the surface and non-surface defects. These features led to improved electrical conductance of Ni(OH)2 and declined charge transfer resistance. In addition, the reduction in the ion diffusion was reasonably caused by yielded gas bubbles inside the nanopores in Ni(OH)2, which played a role in retarding ions transport.
Photoelectrocatalytic hydrogen evolution on nanoporous Ni(OH)2
The light-generated electrons may accelerate the occurrence of reduction reactions. Thus, the hydrogen evolution reaction (HER, Eq. 3) was taken as a model to study the reaction kinetics under visible light illumination. The LSV curves of HER obtained on nanoporous Ni(OH)2 in 1 M NaOH electrode under illumination are shown in Fig. 4A. The nanoporous Ni(OH)2 electrode exposed to visible light illumination displayed a higher current density toward HER than without visible light illumination. At a current density of 10 mW cm−2, the visible light illuminated electrode showed a smaller reduction potential of 40 mV than that recorded under dark. Meanwhile, the onset potential of HER (−48 mV) obtained under visible light illumination positively shifted by ∼30 mV when compared to that registered under dark. The differences in electrode reduction potentials were induced by the electric field built by the visible light illumination.
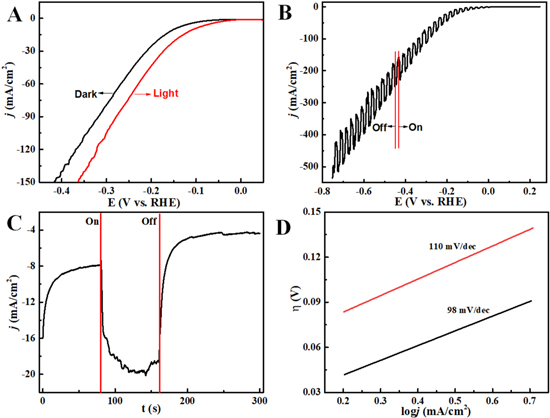
Figure 4. (A) Comparison of LSV curves at 50 mV s−1 under dark and visible light illumination. (B) LSV with intermittent illumination of visible light at a slow scan rate of 0.1 mV s−1. (C) The I-t curve obtained at −0.15 V with one-time on and off visible light. (D) Tafel plots under dark (red) and visible light (black). Conditions: electrolyte 1 M NaOH.
Download figure:
Standard image High-resolution imageTo directly observe the influence of visible light on HER, LSV experiments were conducted from 0.25 V to −0.75 V at the scan rate of 0.1 mV s−1 under intermittently visible light illumination. In Fig. 4B, periodical fluctuations in current density were observed in a full range of HER potentials caused by the on and off of the visible light. The current fluctuations under on and off light conditions became larger at negatively swept electrode potentials. As a result, the visible light improved the kinetics of the HER. Also, the dramatic enhancement in the photogenerated charge carriers and reduced charge transfer resistance in nanoporous Ni(OH)2 led to facilitated electron transport, as well as improvement in the overall conductivity.
Chronoamperometry with intermittent light illumination was also conducted, and the data are provided in Fig. 4C. Under light illumination, the current density of HER at −0.15 V significantly enhanced from 7.8 to ∼19.6 mA cm−2 (equivalent to ∼153% increase). However, with light off, the current density of HER decayed quickly owing to the inactive injection of light-generated electrons. Therefore, light-generated electrons in nanoporous Ni(OH)2 could be used to effectively enhance HER performance in alkaline electrolytes.
The Tafel slope would correlate well with the rate-determining step (RDS) of an electrochemical reaction. Hence, the Tafel slopes derived from the linear fit of overpotential and logarithmic function of current density were used to evaluate the photoelectrocatalytic activity of nanoporous Ni(OH)2 toward HER (Fig. 4D). The Tafel slope under visible light illumination was recorded as 98 mV dec−1, a value smaller than that obtained under dark (110 mV dec−1). The lower Tafel slopes revealed the occurrence of accelerated electrochemical reactions. 53
Photoelectrocatalytic stability and faradaic efficiency
The photoelectrocatalytic stability of Ni(OH)2 at the overpotential of 0.15 V during 7200 s toward MOR and HER was presented in Fig. 5. The electrolyte was refreshed every 600 s to avoid the change in electrolyte condition and trapped CO2 bubbles in nanopores during the test. Amperometric measurement results indicated that the oxidation current for MOR after 7200 s running at an overpotential of 0.15 V decreased by 23% under dark and 29% under light illumination, respectively. For HER, a similar trend was observed. Output currents for HER after 7200 s running at the overpotential of 0.15 V showed a reduction of 32% under dark and 41% under light illumination. The stabilities were not quite good in such a real working condition. Two reasons were responsible for the current decrease with the time. The first one is that precipitated nanoporous Ni(OH)2 film was not strong enough in structure. The ligaments between nanopores could be broken by the stress during gas bubble growth, leading to partial structural collapse. TEM investigation failed to verify this speculation due to tiny irregular pores in the film. The other reason is the trapping of gas bubbles. The products of both MOR and HER formed dynamic gas bubbles. Nanoscale gas bubbles were hard to remove altogether, leading to trapping inside open nanopores. Trapped gas bubbles in the nanopores could block the electrolyte from accessing the surface of the catalyst. Figure 5 shows that visible light involved electrocatalysts exhibited higher enhancement at the beginning. However, as time went by, the current enhancement under light illumination for both MOR and HER decreased faster than that under dark due principally to the quick reaction kinetics caused by light utilization.
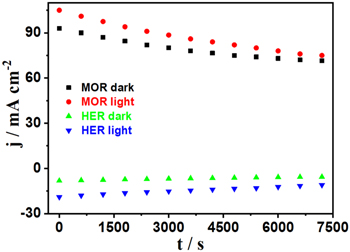
Figure 5. MOR stability test with (red circle) and without (black square) light, and HER stability test with (blue lower triangle) and without (green upper triangle) light. The overpotential was 0.15 V for MOR and HER.
Download figure:
Standard image High-resolution imageCO2 as the product of MOR will partially react with NaOH electrolyte forming CO3 2−. Using yielded CO2 gas from MOR to determine the faradaic efficiency will cause errors. Therefore, the net consumption of methanol in the electrolyte after MOR was measured by GC to calculate faradaic efficiency. For 1 h MOR at 0.6 V (vs Ag/AgCl), the average faradaic efficiencies were calculated as 72% under dark and 77% under visible light (150 mW cm−2) illumination. The current losses here could be ascribed to the oxidation of Ni(OH)2 and somewhat water oxidation. H2 gas was collected for 1 h HER at the overpotential of 0.15 V using the water displacement method and quantified using GC. The average faradaic efficiencies for HER were as high as 84% under dark and 92% under light illumination. In sum, the light illumination could improve the faradaic efficiency for MOR and HER on nanoporous Ni(OH)2.
Photoelectrocatalytic mechanism on nanoporous Ni(OH)2
According to the theory of semiconductors, the illumination by visible light (1.6–3.1 eV) 54 at energy greater than the band gap energy of nanoporous Ni(OH)2 (2.17 eV) could induce the transition of electrons from the valence band to the conduction band, thereby affecting the performance of MOR and HER. 55 This would reasonably occur due to the apparent differences between photoelectrocatalysis and photocatalysis, in which the former required an external potential. For demonstrated MOR and HER models, the electron/hole pairs generated upon light illumination would effectively be separated by an applied external electrochemical bias potential, taking part in the electrochemical reactions (Fig. 6). By contrast, the electron/hole pairs underwent severe recombination during the photocatalytic process. 56 Thus, the inhibited electron/hole recombination in photoelectrocatalysis improved the electrochemical reaction at such a photoactive electrode. Typically, dissolved oxygen in an alkaline solution from the air may also respond to excited electrons to form oxygen radicals, useful for MOR along with the holes derived hydroxyl radicals. 57 On the other hand, electron/hole recombination probably occurred more or less due to the higher resistance of semiconductive Ni(OH)2 despite the existence of bias potential that may inhibit the recombination of electrons and holes.

Figure 6. A diagram showing the mechanism of light-enhanced electrochemical reactions on nickel hydroxide.
Download figure:
Standard image High-resolution image
In sum, the experimental results obtained in this photoelectrocatalytic model were similar to other well-acknowledged systems, in which extracted electrons or holes improved the kinetics of reduction or oxidation reactions. 58 Such photoelectrochemical processes can sostenuto proceed under the applied electrode potential and visible light illumination, similar to photocatalysis.
Conclusions
A novel nanoporous Ni(OH)2 film was successfully fabricated by hydrogen bubbles dynamic template and electrodeposition. Nanoporous properties of as-synthesized Ni(OH)2 film were characterized by SEM, TEM, BJH, CV, and electrical double layer capacitance techniques. In addition, the photoresponsive nature of the as-obtained nanoporous Ni(OH)2 film semiconductor was evaluated by DRS, Tauc plot, Mott Schottky, LSV, and other techniques. The experimental results indicated the strong absorption ability of nanoporous Ni(OH)2 toward visible light. Methanol oxidation and hydrogen evolution were then used as model reactions in alkaline solution to test the performances of nanoporous Ni(OH)2 in photoelectrocatalysis. Compared to results obtained under dark, the visible light illumination of the nanoporous Ni(OH)2 significantly enhanced MOR and HER reaction rates. In sum, the proposed inexpensive nanoporous Ni(OH)2 film with efficient catalytic properties looks promising for future applications in fuel cells and energy conversion systems. Future work will focus on further enhancement of the photoelectrocatalytic performances of nanoporous Ni(OH)2 films prepared with metal atoms doping.
Acknowledgments
This work was financially supported by the Zhejiang Provincial Natural Science Foundation of China (grant nos. LY20B030007, LQ20B010012, and LQ19E030014).