
Abstract
Lithium-ion cells can be inadvertently subjected to overcharge or other off-nominal conditions during their use in the field, compromising user safety. Off-nominal tests are typically carried out on fresh cells. The goal of this work is to characterize the interplay between cycle life aging and the off-nominal events. Cylindrical cells aged to 10, 15 and 20% capacity fade (CF) and battery modules aged to 20% CF, both cycled under two operating voltage windows, were subjected to overcharge and external short tests. Additionally, single cells were aged to 20% CF using a drive cycle profile at three temperatures of 10 °C, 25 °C and 40 °C. Under overcharge conditions, the single fresh cells experience slower activation of the current interrupt device (CID) compared to the aged cells and the cathode displayed severe degradation in spite of the CID activation and the anode exhibited lithium plating on the edges of the electrode. At the module level, the fresh module experiences fire while the aged module shows sequential CID activation with no thermal runaway. No major trends were observed with the external short tests of the aged cells compared to the fresh ones due to protection provided by the positive temperature coefficient (PTC).
Export citation and abstract BibTeX RIS

This is an open access article distributed under the terms of the Creative Commons Attribution Non-Commercial No Derivatives 4.0 License (CC BY-NC-ND, http://creativecommons.org/licenses/by-nc-nd/4.0/), which permits non-commercial reuse, distribution, and reproduction in any medium, provided the original work is not changed in any way and is properly cited. For permission for commercial reuse, please email: permissions@ioppublishing.org.
The current state of the art for lithium-ion batteries (LIBs) is focused on achieving long cycle life, high power and energy density. However, it is equally important to investigate the safety concerns of LIBs with aging and unravel the degradation mechanism under off-nominal abuse conditions to be able to address them during their life in field use. Safety concerns are major obstacles hindering the large-scale application of LIBs in automotive and grid energy storage applications especially when a second life is planned for the batteries. One way to get insights about the safety characteristics of aged cells and batteries is through controlled abuse tests that emulate the potential and credible hazards that may occur during the operation. The off-nominal safety tests can be broadly classified as electrical (overcharge, overdischarge, external short) 1,2 or mechanical (crushing, nail penetration, impact, vibration) 3,4 or thermal (extreme temperatures, fire exposure), 5,6 depending on the nature of the failure mechanism.
Electrical Abuse Test
An electrical abuse test consists of driving LIBs out of the safe operating ranges provided by the manufacturer for voltage and current (voltage limits, 7,8 current limits 9,10 ). This off-nominal condition is imposed on the cell due to factors external to the cell that are of an electrical nature. For instance, if the terminals are brought into contact by means of an element with low resistivity, the cell will experience a short circuit. Under this condition a large current is demanded from the cell which can cause its failure. If the cell is charged above the manufacturer's specified upper cutoff voltage, the cell is said to have been overcharged. Overcharge conditions can occur in the field when the charger is not designed with the required cell-level voltage monitoring and control or if the charger has controls that are not stringent or if a universal charger that does not recognize the electrode combination is used. 11 In the last case, using a universal charger can overcharge cells of certain chemistries such as those using LiFePO4 cathodes and Li-titanate anodes that have a lower end-of-charge voltage compared to others such as cathodes with a Nickel Manganese Cobalt (NMC) oxide. Low impedance external short circuits can occur when the two terminals of the cell or battery are connected inadvertently by an electrical conductor. Prevention of overcharge and external short is critical for achieving long lifetimes and averting catastrophic failure events. 12
Overcharge test
Cell manufacturers specify an operating voltage window (VW) based on several factors of which the chemistry of the electrode couple is one of them. This voltage window represents an optimal range as provided by the manufacturer's specification sheet, in which a margin is included for safety while providing the optimum cycle and calendar life. The upper limit provided by the manufacturer is set to ensure that the cathode material does not release lithium ions beyond its cyclable lithium amount which can lead to cathode structure destabilization, especially in metal oxide cathode materials, the electrolyte is stable, and the anode does not experience deterioration effects such as lithium plating, dendrite formation and excessive growth of the solid electrolyte interphase (SEI). Thus, overcharge is defined as the phenomenon in which the cell is charged beyond the manufacturer's upper cutoff voltage or charged at very high currents. In this study we look at the overcharge condition of charging beyond the manufacturer's upper cutoff voltage.
Overcharging can also lead to significant gas generation within the cell before driving the cell into a thermal runaway. In prismatic form factors, and particularly in cells with thin cases or with soft-pouch, the generation of gas within the cell causes swelling of the cell and can force separation between the electrodes, effectively limiting ion transfer and interrupting the charge/discharge process. 13 The geometry of cylindrical cells prevents electrode separation even if gas generation occurs. 14,15 Cell designers have developed designs that include a central mandrel that directs the flow of gases generated inside the cell and a mechanical current interrupt device (CID) for cylindrical cell designs. When activated due to increased internal pressure, CIDs physically and irreversibly disconnect the cell from the external circuit rendering the cell fail-safe.
The extent of degradation caused by overcharging depends on several factors such as the rate of charge, the environmental temperature, extent of overcharge, cell type, size, and chemistry. Leising et al. studied the effect of charge rate for overcharge in commercial prismatic LCO/graphite cells. 16 They observed that at low rates of overcharge, swelling, temperature and internal resistance increased at a lower rate compared to cells overcharged at higher rates. Cathode was also identified as the main source of heat generation confirming that overcharge is a cathode-dominated process, which is consistent with DSC studies by Zhang et al. 2,17 Studies have also been carried out to compare the stability of different electrode materials under overcharge conditions. LCO was found to be a more thermally unstable cathode material compared to LMO when paired with graphite as anode material. 18 Similarly, in the work by Larsson et al., LIBs with LFP-based cathodes show more stability compared to cobalt-rich cathode materials. 1
The studies listed above share a common characteristic, all of them were performed on fresh cells. The goal of this work is to fill the knowledge gap on the interaction between the characteristics induced by aging and those induced by overcharge. In Part I, the aging effect on cylindrical cells was presented. 19 This paper will cover the overcharge characterization tests on cells aged to various levels and compare them to the results obtained by overcharging fresh cells. This was accomplished by overcharging cells that had been aged up to 10, 15 and 20% capacity fade (CF). The overcharge tests were also carried out on fresh and aged modules. The cells and modules were cycled to different voltage ranges, operating temperatures, and realistic discharge conditions under the aging part (Part I) of the study. 19 This study characterized the electrochemical, thermal, and morphological changes induced by the overcharge test and was used to elucidate if aging is a benign or a malign factor with respect to the safety aspects. Results for external short test are briefly discussed.
Experimental
In this study, fresh and aged cylindrical 18650 cells and modules were used for the overcharge-induced abuse tests. Part I of this article includes a comprehensive description of the fresh cells under study, their internal protections and aging history for each of the cells subjected to overcharge described in this study. 19 The aging test in single cells was done using the conventional CCCV charge and CC discharge at C/2 current. In this paper in addition to the cell level tests, the results of the module level tests are also included. Thus, for this analysis the cells used are labelled as follows for tracking purposes and to prevent disclosure of the manufacturer: N10OV8, N15OV3, N20OV1, R10OV5, R15OV3, R20OV1. Additionally, fresh (F) cells were also overcharged (OV) as a baseline for the overcharge effect (F00OV1). Following the same notation for labelling that was introduced in the cycle life aging paper from Part I, N stands for the normal VW, the R stands for the reduced VW and F stands for fresh cell. 19 The subscript after the first letter in each notation indicates the capacity fade level and subscript after OV indicates the cell number. The two aged modules are labelled as "Normal" and "Reduced" referring to the voltage window used to cycle them. One more fresh module, labeled as "Fresh" was also overcharged as a baseline to compare the aging effect on safety. The module configuration is a 3P9S (3 cells in parallel (bank), 9 banks in series) and is built using the same 18650 type of cells as used in the single cell tests. The electrical connection between the banks was made using nickel tabs and the physical separation between the cells was 2 mm. Pre-test charge/discharge cycling was performed using the manufacturer specified nominal voltage range of 24.3 to 37.8 V and capacities of 10.2 Ah were recorded. The K-type thermocouples were placed on the central cell of each of the banks. The two modules were cycled under two different voltage windows until their capacity faded by more than 20% with respect to the discharge capacity measured in the first full cycle. The normal operating voltage window was defined in the range of [24.3, 37.8] V. This range was shortened by 200 mV on each end of the single cell cutoff voltages. Therefore, the reduced voltage window for the module was defined in the range of [26.1, 36.0] V. The modules were charged using a CCCV protocol at a 1C-rate and a C/20 end-of-charge current and discharged using a CC protocol at the same rate. Test chamber, setup and connections used in the study are shown in Fig. 11a.
Electric vehicle (EV) usage testing
Despite the fact that a battery is discharged at variable currents during its use in an EV, there are few publications in the literature analyzing this effect. Panchal et al. investigated the large batteries subjected to different drive cycle profiles at different environmental temperatures. 20 Their analysis focused on the long range performance but not the actual degradation mechanisms. The drive cycle test emulates the discharge pattern of a highway-driven EV Fig. 12a, that travelled 10.26 miles in 765 s. Unlike the CC discharge protocol, the drive cycle (DC) test shows the variable loads demanded by the vehicle when accelerating. The positive current spikes correspond to the charge induced by periodic regenerative breaking. Assuming the vehicle is used every day, a discharge pattern with intermittent continuous stops was created as shown in Fig. 12b. The test was conducted on cells from the same lot as those used for the aging and overcharge test in single cells and modules. From a fully charged condition, a group of three drive cycles is applied followed by a 2-h rest. Then another group of three drive cycles were applied followed by a 4-h rest. The cell was then charged fully using the CCCV protocol to 4.2 V at a C/2-rate and kept at constant voltage of 4.2 V until the current fell to 50 mA. It should be noted here that the drive cycle profile consists of pulses of charge and discharge. The cycling process was repeated for a week at three conditions, T = 10 °C, 25 °C, and 40 °C, emulating the performance of the vehicle under different thermal environments. At the end of the week, cell capacity and internal resistance were measured at ambient room temperature following the conditioning test as described in Part I. 19 The weekly test pattern was repeated until the cell capacity, as determined by the full capacity checks, decreased by 20% its initial capacity. Three single cells were aged under each thermal environment.
Overcharge test
The manufacturer-recommended voltage window for the cathode/graphite commercial cells is 2.7 to 4.2 V. 21 Accordingly, the cell is considered to be overcharged when it is charged above 4.2 V. Prior to the overcharge abuse test, the cells are fully charged to 4.2 V at 1C-rate using a constant current—constant voltage (CCCV) protocol with a cutoff current of 50 mA. The cell is then overcharged using a constant current (CC) of 1C-rate to a 12 V limit for a maximum of six hours or until an off-nominal event happens. The test protocol includes the recording of the cell temperature at the rate of 1 Hz until the cell temperature returns to ambient room temperature. The same overcharge test conditions were used for the single cells that underwent aging using the drive cycle protocol.
The overcharge test on the cells is conducted using a module tester (Arbin system, BT-ML-40V-20A-A). Cell temperature is measured on the cell surface by means of a J-type thermocouple (Omega, TJ72-CPSS-116U-6) taped on the cell surface in the axial direction.
External short test
The external short test was conducted on fully charged cells with a 50 mΩ load. Low impedance external shorts are characterized by a load resistance that is equal to or less than the internal resistance of the test article. The average internal resistance, at 50% SOC, of the 25 fresh cells tested was 44 mΩ. The internal resistance of the aged cells was lower than 70 mΩ. For consistency, a 50 mΩ load was chosen for the short circuit test. The short circuit load was maintained for 3 h. The sampling rate for the first 3 s was 1 kHz to capture the initial current spike produced at the application of short circuit. The same external short test conditions were used for the single cells that underwent aging using the drive cycle protocol.
Overcharge test on modules
In a similar fashion to the single cells, the modules are fully charged at 1C-rate prior to the overcharge test. The fully charged module is overcharged using a 9 A current up to a 108 V limit for a maximum of six hours or until an off-nominal event happens. Temperature and voltage measurements of the banks are collected along with the module voltage.
After the overcharge and external short tests, the single cells undergo a destructive physical analysis (DPA) in an argon-filled glovebox. The step-by-step procedure is described in the Appendix A of Part I. 19 This is a sensitive task that requires additional precautions as the electrodes may undergo a short circuit during the disassembly process causing excessive heat that can result in a fire. Representative samples of the electrodes and separators are harvested and analyzed via Scanning Electron Microscopy (SEM) (Hitachi S4800) and Energy Dispersive X-ray Spectroscopy (EDS) (Oxford X-MaxN 80) techniques.
Results and Discussion
Overcharge test
The protocol used to overcharge the cells is exemplified in Fig. 1a, corresponding to the N15OV3 cell. The preparation test consists of two full charge/discharge cycles followed by a full charge to ensure that the cell is fully charged at the beginning of the overcharge test. Internal resistance is also measured at 50% SOC during the discharge of the second cycle from the preparation test. The idea was to compare internal resistance before and after the overcharge abuse test. However, this was not possible since the internal resistance of the cell after the overcharge test, was too large (> 1 MΩ) indicating that the overcharged cells were internally electrically disconnected.
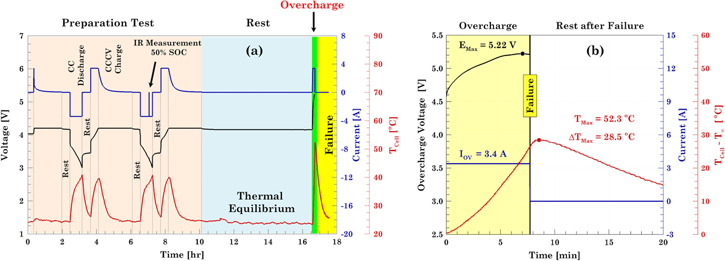
Figure 1. Normal and overcharge test plots showing (a) normal cycling protocol that includes the overcharge test protocol. (b) Voltage and temperature response during CID activation.
Download figure:
Standard image High-resolution imageA detailed view of the overcharge test highlighted in green in Fig. 1a is shown in Fig. 1b. During the overcharge test, the voltage increases but never reaches the upper cutoff voltage set at 12 V. Instead, the cell voltage reaches a maximum value (∼ 5.3 V) and then decreases even though the cell is charging. The tip of the curve is a characteristic feature of the overcharge test and indicates that the cell will fail soon. During failure, the CID activates, see Fig. 1b from Part I, 19 and electrically disconnects the cell. The CID activation is said to be a fail-safe mode and is reflected as the black vertical line in Fig. 1b. The voltage peak is only plotted as an indicator of cell shut down but is neglected for post-processing analysis. As the CID disconnects, the cell resistance increases infinitely and, consequently, the cell voltage reaches the compliance voltage set on the test equipment. Once the CID is activated, the voltage and current drop to zero.
On the other hand, the temperature increases due to the electrochemical reactions and degradation processes induced by the overcharge test, Fig. 1b. Initially, the temperature rises due to the irreversible heat generation caused by the increased intercalation of lithium ions into the anode. 13,22 Then the temperature increases at a faster rate due to side reactions caused by lithium plating and the degradation of the electrolyte and electrodes. Once the cell shuts down electrically, the temperature continues increasing for a short time, as side reactions continue to occur internal to the cell even after the external supply of current stops. 2
Electrochemical results
In order to investigate the aging effect on the overcharge response, the voltage curves for the fresh (red line) and aged cells are put together in Fig. 2a. In this figure, only the overcharge portion is plotted for the fresh as well as the aged cells in the normal and reduced VW.

Figure 2. Voltage and thermal response comparison of overcharged cells with different levels of capacity fade and two operating voltage windows. (a) Cell voltages and (b) cell temperatures and heat generation for (c) the normal and (d) reduced VW.
Download figure:
Standard image High-resolution imageThe overcharge capacity (QOV) indicated in Fig. 2a corresponds to the additional capacity induced only by the overcharge part of the test. In this case, no significant difference is observed with the cells aged to various levels of capacity fade. All aged cells experience CID activation at approximately the same time and overcharge capacity, QOV = 0.45 Ah, corresponding to a 113.5% SOC. On the other hand, the fresh cell can be overcharged up to QOV = 0.8 Ah, corresponding to a 123.5% SOC. There are two factors that contribute to the difference observed in the response of the cells. The first one is based on the lithium inventory and the second is based on the gas evolution internal to the cell. In the fresh cell, the amount of lithium ion inventory from the cathode that can intercalate into the anode is larger than that for the aged cells since the entire negative electrode is available and it can accommodate some of the additional lithium transferred due to the overcharge. And unlike the fresh cell, aging degradation reduces the amount of lithium ions in the cathode inventory in the aged cells, not only due to displacement of the lithium ions in the cathode structure but also due to its loss to sites inside the anode as well as inside the thickened SEI. As it was explained in our previous paper, CID activation occurs due to an increase in internal pressure caused by the release of gases. 19,23 In cells fitted with a CID, an additive, lithium carbonate (LiCO3) is added to cause activation of the CID above a certain overvoltage condition but before the cell becomes unsafe. Above a certain voltage the lithium carbonate decomposes and releases carbon dioxide gas which provides the pressure to activate the CID. Our observation in the overcharge tests indicate that due to other side reactions that occur during the aging process, there were other gases present in the cells and hence the CID activation occurs much earlier in the aged cells compared to the fresh cells. In Part I, it was shown that as the cell ages, its internal resistance increases. 13,19 The internal resistance for cells aged under normal VW is greater than that of cells aged in reduced VW. Accordingly, during overcharge, the initial voltage rise for cells aged in normal VW is slightly greater than that of cells aged in the reduced VW. However, at the end of the overcharge test no difference was obvious between those cycled in the normal voltage range and those cycled with the reduced voltage range.
Thermal results
The thermal response of the aged cells during the overcharge test is shown in Fig. 2b. The maximum cell temperature of 80 °C occurs in the fresh overcharged cell. The maximum temperature for aged cells is only 55 °C and takes place in the cell aged in the reduced VW with 10% capacity fading. The minimum temperature response occurs in the two cells, N20OV1 and R20OV1, with 20% capacity fading. It is important to highlight how the maximum temperature occurs after the CID activates and the cell fails safe. This indicates that side reactions within the cell continue even after the applied current has been removed. In the cylindrical cells that were studied, the activation of the CID prevents the catastrophic results typically observed with an unprotected cell design. In general, it was observed that the higher the capacity fade, the lower the thermal response of a cell to an off-nominal condition. However, the presence and activation of the CID in the cylindrical cells tested limited the catastrophic events under this off-nominal condition.
To investigate the actual role of the aging effect in thermal response, the heat generated by cells during overcharge is calculated using the same fitting method described in Part I. The temperature profile going from the beginning of the overcharge test to the point when the cell temperature reaches its maximum value is used to perform the data fitting. The part where the temperature begins to drop is not considered in the analysis since at this point convection dominates the heat transfer phenomena and the cells are no longer a threat. The energy balance, the assumptions, the physical properties of the cell and number of fitting terms used to obtain the heat generation, see Figs. 2c, 2d, are the same as those reported in Part I. The regions defined by the voltage profile are identified in the temperature and heat generation profiles based on the extent of overcharge. The contrast allows to directly correlate the electrochemical and thermal results. It is important to note how the transition in voltage, indicated by the markers in Fig. 2, corresponds to the inflection points in the heat generation curves, Figs. 2c, 2d. Although cell temperature and temperature rise do not show the aging effect in a clear way, the overcharge heat generation profiles do. When comparing the heat generated by the cells aged in normal VW with that of the aged cell in reduced VW, Figs. 2c, 2d, no significant difference in trend or magnitude is detected. The heat generated during overcharge is still relatively high compared to that generated during the normal charge and discharge process. To put it in perspective, the maximum heat generated during the discharge on the aging test, regardless of the VW, does not exceed 250 mW, as shown in Fig. 6 of Part I. During overcharge, aged cells reach a value of 5 W in ∼8 min while the fresh cell generates 5 W in ∼12.5 min. The higher rate of heat generation in aged cells is a combination of lack of intercalation sites that leads to the formation of lithium dendrites and the occurrence of side reactions leading to an increase in internal resistance. 13 It is worth noting that the cells aged to 10% capacity loss generated the most heat compared to the fresh cells and the heat generated falls as the cell ages as observed for the cells aged to 15% and 20% capacity loss. This may be attributed to the loss of capacity with cycle life which leads to lesser energy content in the cells and less temperatures generated under the overcharge condition. However, the temperatures are still higher than that obtained for the fresh cells and this may be due to the degradation of the electrolyte and electrodes with aging and the formation of gaseous side products.
Post-mortem analysis
At the end of the overcharge test, the cells undergo a destructive physical analysis as shown in Fig. 3. This operation must be carried out with care since the cells are still in an overcharged condition. And even within the glovebox, minimal contact between the electrodes can cause a thermal ramp up. The inert environment inside the glovebox helps prevent any possible fire. The detailed procedure for opening the cell is described in the appendix A section of Part I. 19 The graphite and cathode electrodes, and the separator harvested from the overcharged cells are shown in Figs. 4 and 5, respectively. In both figures, the electrodes labeled as 0% CF correspond to the overcharged fresh cell (F00OV1). The left and right columns correspond to the overcharged cells from the normal and reduced VW electrodes, respectively.

Figure 3. Destructive physical analysis of the fresh overcharged cell. (a) Bubbling in the cell, and (b) electrolyte discoloration. Cell header from a (c) fresh cell (F00NA1) with a normal CID, and (d) aged overcharged cell (N20OV1) with the CID activated.
Download figure:
Standard image High-resolution image
Figure 4. Photos of the graphite anode from the destructive analysis of the fresh and aged overcharged cell and the cells aged under different voltage windows. The photos at the top are for the two sides of the overcharged fresh cell. Remaining photos: Left column: aged under Normal VW and then overcharged; right column: aged under Reduced VW and then overcharged. Percentage of capacity fade is shown on the left side. The arrows have been used to show the orientation of each side of the electrode with respect to the center of the cell and the side of the electrode facing it.
Download figure:
Standard image High-resolution image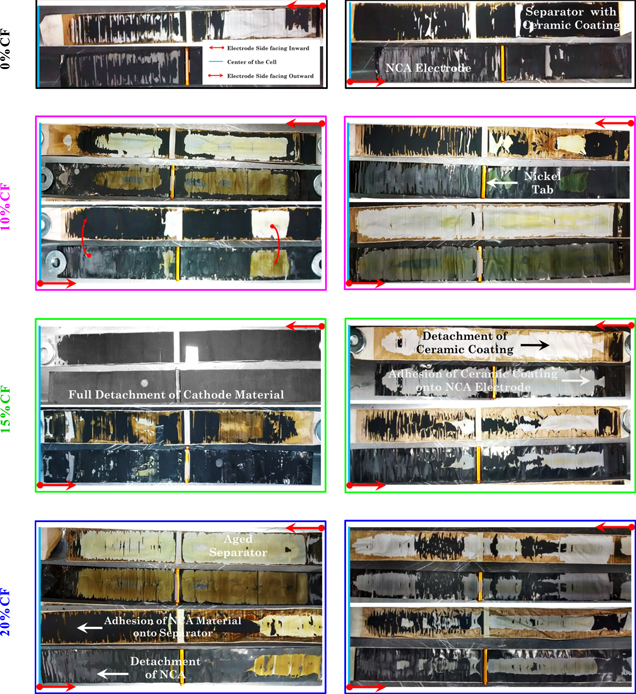
Figure 5. Photos showing the cathode electrode degradation induced by overcharging aged electrodes for both VWs studied. The two photos at the top show the cathode for the fresh cell and an overcharged fresh cell. The photos below are for the overcharged aged cells: Left column: Normal VW; right column: Reduced VW. Percentage of capacity fade is shown on the left side of the photos. The arrows have been used to show the orientation of each side of the electrode with respect to the center of the cell and the side of the electrode facing it.
Download figure:
Standard image High-resolution imageThe DPA of the overcharged fresh cell showed that the electrolyte, which is generally translucent, was brown in color. This discoloration may be due to the degradation induced by the overcharge test, (see Figs. 3a, 3b). The electrochemical stability of the electrolyte is compromised by the high voltage. 24 In the aged cells, the ceramic coating on the separator that faces the cathodes displayed a characteristic brownish-yellow coloration, see Fig. 5, which may be attributed to the degradation of the electrolyte that impregnates the separator. 19 A second feature found during the DPA in the overcharged fresh cells is the bubbling of the electrolyte, see Fig. 3a. This could be due to the escape of gases from the gas pockets in the jelly roll, and it is also highly likely to be the reaction of lithium plating with the small amount of oxygen present inside the glovebox. Excess electrolyte and electrolyte bubbling were not observed with the aged cells due the decomposition and degradation that occurs with the electrolyte during the cycling process.
Disassembly of the cell header is a key part of the destructive analysis of the overcharged cells in order to understand the influence of the built-in protection mechanisms and confirm the internal electrical disconnection caused by CID activation. Figures 3c, 3d show the cell header after the external seal has been removed. In a fresh cell, the physical connection of the inner and outer CID disks is visible in the center of the assembly as shown in Fig. 3c, where they are physically connected in one spot providing the electrical connection from the positive electrode to the cell terminal. During overcharge, the internal pressure exceeds the pressure activation limit and physically and irreversibly disconnects the cell, as shown in the Fig. 3d. Unlike the fresh cell, the two discs of the CID are electrically disconnected due to the physical movement of the top disc caused by the increased internal gas pressure.
In the overcharged fresh cells, uniform lithiation is observed on both sides of the graphite electrode, see Fig. 4. Minimal degradation is found in the electrode areas closest to the center of the cell on one of the sides of the electrode. The gold color is a characteristic feature of the fully lithiated graphite, LiC6. 25,26 The aging test creates uneven lithiated areas, especially in the center of the electrode. When the cell is overcharged, the non-uniformities exacerbate and lead to the creation of the darker areas in the 20% CF cells for both VWs. The dark area is graphite that was not fully lithiated. The reason behind the non-uniform lithiation is induced by the cathode degradation as shown in Fig. 5 and the transfer of the ceramic coating from the separator to the cathode or vice versa that prevents that area of the cathode from being electrochemically active. The charring observed in the separator facing the anode material indicates that there is internal cell heating that occurs even though the CID activates and protects the cells from a catastrophic failure. The blackish color on the separator is observed on the overcharged cells but not in the cells that have undergone only capacity fade aging. The two common features in all the overcharged negative electrodes are the detachment of the graphite active materials near to the electrode edges and the presence of scattered dark spots in the center of the electrode, as shown in the 10% CF cell aged in the normal VW.
The cathode electrodes obtained from the overcharged cells are shown in Fig. 5. The two images in the first row corresponds to the overcharged fresh cell. The degradation found on them is directly attributed to the overcharge test since the cell is a fresh cell. Detachment of the cathode active material from the electrode as well as detachment of the alumina (Al2O3) ceramic coating from the separator are the two main features found on the electrodes for the aged cells subjected to the overcharge test. In all cases, there was either cathode active material stuck on the separator or the ceramic coating from the separator stuck on the cathode electrode. The extent of degradation induced by the overcharge test was different for the cells aged under the different voltage windows. The cathode electrodes aged in the normal VW exhibit more degradation than the ones aged in the reduced VW one, no matter the CF percentage. This may be due to the higher level of degradation observed with the cells cycled in the normal VW which is also reflected in the faster degradation of capacity (Part I). 19 In both cases, the extreme delithiation and more specifically the high voltage (ECell > 4.30 V) can lead to the dissolution of transition metals (e.g., nickel and cobalt) and its migration to anode which has been reported in Part I of this study. 19,27 The higher voltages lead to a destabilization of the cathode, a change in the structure of the cathode active material and oxygen release. 28 The apparent difference in degradation on the two sides of the same electrode is simply an effect of the jelly roll winding.
SEM/EDS
Representative micrographs of overcharged graphite and cathode electrodes are shown in Fig. 6, respectively. The composition for each of the samples, obtained using EDS, is tabulated in Tables I and II.
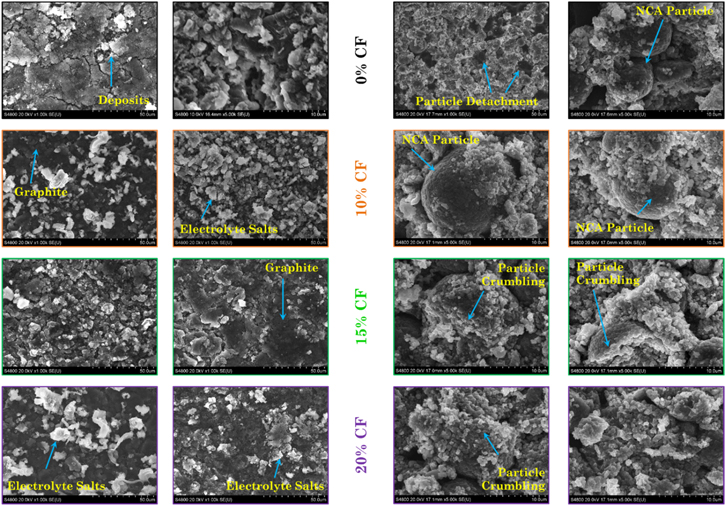
Figure 6. SEM micrographs of anode (columns 1 and 2) and cathode (columns 3 and 4) representative samples harvested from the fresh and aged overcharged electrodes. The two micrographs at the top show the electrodes an overcharged fresh cell. The photos below are for the overcharged aged cells: Left column: Normal VW; right column: Reduced VW. Percentage of capacity fade is shown in the middle. For the fresh overcharged electrode samples (0% CF), a 1 kX and 5kX magnification images are shown. For the aged overcharged electrode samples, the 5 kX magnification is shown.
Download figure:
Standard image High-resolution imageTable I. Composition of the anode obtained by an EDS analysis of electrodes extracted from fresh overcharged and aged overcharged cell samples shown in Fig. 6. a)
| CF | C | O | F | P | Al | Ni | Co | Cu | |
|---|---|---|---|---|---|---|---|---|---|
| Fresh Cell | 0% NA | 74.9 | 23.4 | 1.1 | 0.2 | 0.1 | 0.0 | 0.0 | 0.3 |
| 0% OV | 30.4 | 43.8 | 19.0 | 2.4 | 0.2 | 4.2 | 0.0 | 0.0 | |
| Normal | 10% | 25.4 | 67.1 | 4.3 | 0.6 | 0.0 | 2.6 | 0.0 | 0.0 |
| 15% | 20.4 | 57.9 | 19.0 | 2.7 | 0.0 | 0.0 | 0.0 | 0.0 | |
| 20% | 19.1 | 68.2 | 11.0 | 1.7 | 0.0 | 0.0 | 0.0 | 0.0 | |
| Reduced | 10% | 21.1 | 67.9 | 9.9 | 1.1 | 0.0 | 0.0 | 0.0 | 0.0 |
| 15% | 22.3 | 46.0 | 25.4 | 2.7 | 0.0 | 3.54 | 0.0 | 0.0 | |
| 20% | 18.6 | 45.4 | 31.9 | 4.1 | 0.0 | 0.0 | 0.0 | 0.0 |
a)The values listed correspond to the wt % of each element found in the samples. The "normal" and "reduced" captions refer to the composition of the electrodes overcharged after the respective capacity fade percentages for cells cycled under the normal and reduced voltage windows.
Table II. Composition of the cathode obtained by an EDS analysis of electrodes extracted from fresh overcharged and aged overcharged cell samples shown in Fig. 6. b)
| CF | C | O | F | P | Al | Ni | Co | Cu | |
|---|---|---|---|---|---|---|---|---|---|
| Fresh Cell | 0% NA | 0.0 | 32.2 | 0.0 | 0.0 | 1.2 | 55.6 | 11.0 | 0.0 |
| 0% OV | 6.8 | 24.4 | 0.0 | 0.1 | 9.6 | 49.7 | 9.4 | 0.0 | |
| Normal | 10% | 6.5 | 27.7 | 3.7 | 0.2 | 1.1 | 50.9 | 9.9 | 0.0 |
| 15% | 7.5 | 32.6 | 0.0 | 0.2 | 1.3 | 48.9 | 9.5 | 0.0 | |
| 20% | 7.3 | 34.1 | 0.1 | 0.2 | 1.6 | 47.5 | 9.2 | 0.0 | |
| Reduced | 10% | 9.2 | 24.5 | 0.0 | 0.2 | 5.9 | 50.4 | 9.7 | 0.0 |
| 15% | 9.6 | 33.1 | 0.0 | 0.2 | 1.2 | 46.9 | 9.0 | 0.0 | |
| 20% | 0.0 | 33.7 | 0.2 | 0.3 | 2.7 | 52.9 | 10.2 | 0.0 |
b)The values listed correspond to the wt % of each element found in the samples. The "normal" and "reduced" captions refer to the composition of the electrodes overcharged after the respective capacity fade percentages for cells cycled under the normal and reduced voltage windows.
In Fig. 6, the graphite particles (dark background) exhibit some deposits on the surface. Based on the composition of the electrodes and the information gathered from the Fig. 4, it can be concluded that the deposits are from the electrolyte salts and lithium. It is well known that lithium plating will occur during the overcharge test since the high cell voltage drives the anode potential to a negative value. 29,30 Lithium plating can occur as amorphous or dendritic forms, but gets quickly converted to the oxide form, Li2O on exposure to air which is reflected as a higher oxygen percentage in the EDS analysis. 31 The EDS indicates that the components found on the overcharged graphite electrodes, for both VW in Table I, shows a significant increase in the percentage of oxygen, phosphorous and fluorine and a reduction of the carbon percentage due to the deposits, when compared to that found in a fresh cell. Overall, there is no significant difference in the amount of oxygen present between the electrodes aged in both VWs indicating that the quantity of lithium deposited is similar irrespective of the voltage window used for aging.
In Fig. 6, the overcharged cathode samples (columns 3 and 4) with the representative spherical agglomerated particles (diameter ≈ 10–12 μm) are shown. The sample from the fresh cell that was overcharged, F00OV1, shows the inner layers of the electrode after the active material got detached due to the extreme delithiation. The dark background corresponds to the aluminum current collector and the small particles are crumbled agglomerates. Overcharge magnifies the stress that was induced by cycling leading to cracking of the active material particles. For both VWs, the greater the CF, the greater the degradation observed. The residues of the alumina ceramic coating attached to the sample increases the aluminum and oxygen percentages. According to these results, one can conclude that the overcharge is a cathode dominated phenomena.
External short test results
The protocol used to short circuit the cells is exemplified in Fig. 7a, corresponding to the cell N15EX4. The cells are fully charged at the beginning of the external short test. The voltage dropped from 4.2 V to approximately 100 mV in a few seconds (Fig. 7b). The cell voltage and temperature remained constant for almost three hours. The end of the test is marked by the drop in voltage and temperature. The current flowing through the external load was recorded at 1 kHz rate in order to understand the initial current spike when the short circuit load is applied (Fig. 7c). The maximum current peak was 70 A and occurred in the aged R20EX2 cell and the lowest peak current was 61 Amps and occurred in cell N20EX2. The peak current values for the rest of the fresh and aged cells were between these two values and no trend was observed with the capacity fade of the cell. Figure 7d shows the cell temperature during the external short test. The temperature recorded ranged from 63 °C for cell R20EX2 to 70 °C for R15EX4 cell. The presence of the PTC internal to the cell in the header area protects the cell from external short circuits and reduces the temperature achieved by the externally shorted cells. The cells could be cycled after undergoing the short circuit test. No significant trend was observed in the peak current or temperatures recorded. There did not appear to be a relationship between the cell's response to the external short test and the percentage of capacity fade.
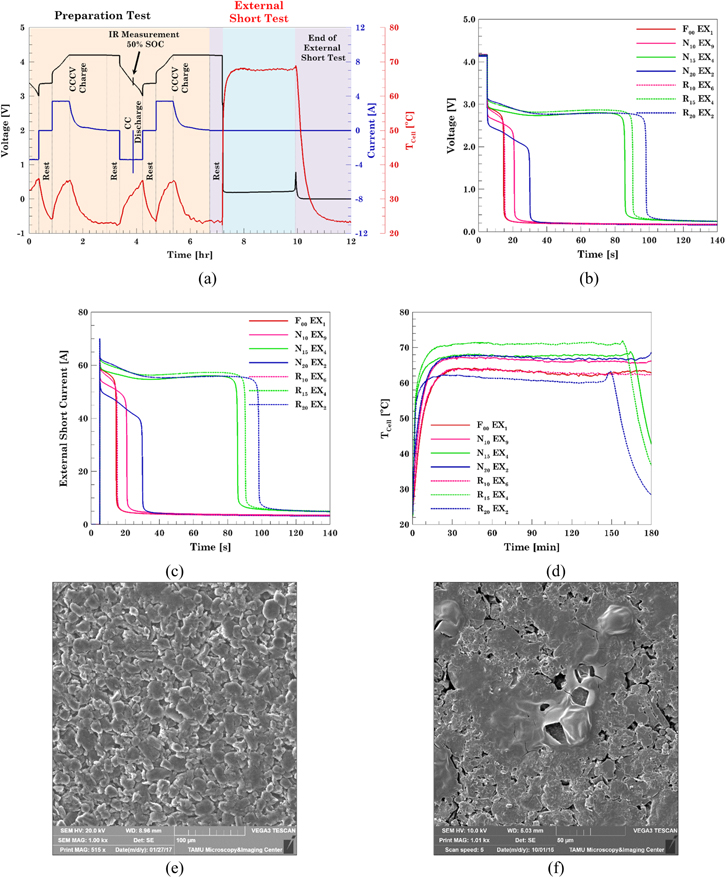
Figure 7. Electrochemical and thermal response of externally shorted cells with different levels of capacity fade and two operating voltage windows. (a) Normal cycling protocol that includes the external short test protocol. (b) Cell voltages for cells from Normal VW and Reduced VW, (c) Currents recorded for cells from Normal VW and Reduced VW; (d) cell temperatures for Normal VW and Reduced VW. SEM micrographs of anode representative samples harvested from the (e) fresh and (f) fresh cell that underwent external short test.
Download figure:
Standard image High-resolution imageExternally shorted cells were subjected to post-mortem analysis similar to that performed on overcharged cells. The fresh cells subjected to the external short test showed severe degradation with meltdown like features on the anode electrode (Figs. 7e and 7f). This was observed in spite of the PTC activation in the fresh cells. However, no further degradation was found in the electrodes from the externally shorted cells with respect to the electrodes from the only aged cells reported in Part I. 19 For that reason, electrodes pictures are not included here.
Module results
To characterize the overcharge behavior of the cells configured into modules, it was necessary to age the modules before subjecting them to the overcharge test. The aging test results for the modules and their banks are shown in Fig. 8. In Fig. 8a the discharge capacity trend for the two modules subjected to the aging test is shown as well as a schematic of the module design used. Like single cells, the capacity of the module aged under normal VW decreased faster than that of the aged one in reduced VW. It takes 100 (normal VW) and 135 (reduced VW) cycles to reduce the modules' capacity by 20% with respect to the initial capacity. In the case of modules, a lower number of cycles were obtained since modules were aged at a 1C-rate which was twice that used for the single cells.

Figure 8. Trends in (a) capacity fade of the two 3P9S cylindrical lithium-ion cell modules cycled in the normal and reduced VWs; (b) Temperature of cell banks during the last few cycles before failure in Bank 9 of module cycled under normal WV; (c and e) Maximum and (d and f) minimum bank voltages at the end of the charge and discharge process for the modules cycled under the two VWs.
Download figure:
Standard image High-resolution imageDue to the lack of a cell balancing protocol, it was observed that the cell banks in the module that underwent the charge and discharge cycle life aging under the normal VW, deviated in voltage which was more obvious during the discharge step, see Fig. 8d. The imbalance resulted in bank 9 going below 0 V since the voltage was controlled at the module level and not at the individual bank level. Previous work has shown that an overdischarge condition degrades the electrolyte and release gases that makes the cells swell. In some cases, internal shorting can occur due to a combination of the dissolution of the copper current collector during overdischarge and redeposition on the electrodes and separator during subsequent charge. Other observations included lithium deposits on the anode electrodes and significant electrode degradation. 32,33 All these degradation mechanisms can cause internal temperature rise and temperatures of up to 164.2 °C was recorded on the overdischarged bank, Fig. 8b. It is important to note that the bank temperature rise occurred only when the bank went below 0.5 V. Before that cycle the temperature was almost the same than the rest of the banks. This overdischarge and high temperature condition caused the test equipment to stop the test. The test was restarted after electrically disconnecting bank 9 which shows the bank temperatures slowly rising again and the test was stopped at that point and bank 9 was electrically disconnected for the rest of the aging test. The extreme overdischarge condition was not observed in the module aged under the reduced VW, see Fig. 8f and the bank temperatures did not rise above the 70 °C. Only a slight overdischarge was observed at the end of the cycle life aging test of up to 20% capacity loss, but the bank voltage never went below 2 V. A very slight overcharge was found in some of the banks from the module aged under the normal VW, Fig. 8c, but not in the reduced one, Fig. 8e. In general, aging causes voltage deviation between banks but the use of the reduced VW may help in lessening the deviation.
The module resistance was also measured in a similar way to that of the single cells, i.e., with a 1.5 C pulse for 100 ms except that it was measured every 25 cycles. The internal resistance of the module initially decreased in the first 25 cycles and then grows showing the well-known tendency of cells to increase in internal resistance with aging.
Overcharge test in modules
The electrochemical and thermal results of the overcharge induced test on the modules are shown in Figs. 9 and 10. The voltage of the modules, Fig. 9, shows that the fresh module takes longer to be overcharged compared to the aged modules. Irrespective of the voltage window the module was cycled for cycle life aging, in an overcharge condition both aged modules failed almost at the same time and in a similar manner. During the overcharge test, the fresh module experienced a complete thermal runaway; and the aged modules experienced benign CID activations around 80 V. Thus, modules with fresh cells experience thermal runaway, while those with aged cells do not.
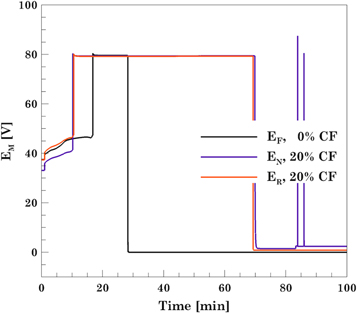
Figure 9. Voltage response of the three modules (Fresh, aged module under normal voltage window and aged module under reduced voltage window) during the overcharge test.
Download figure:
Standard image High-resolution image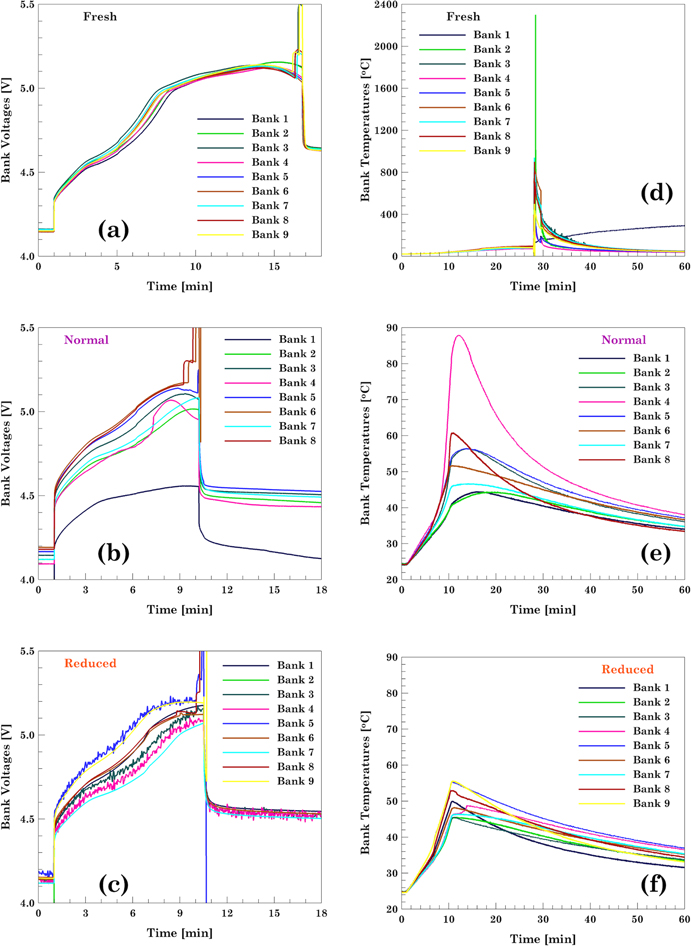
Figure 10. Overcharge test plots for the modules showing the bank voltages and temperatures. (a) and (d) Fresh module, (c) and (e) module cycled to Normal voltage window, and (d) and (e) module cycled to Reduced voltage window.
Download figure:
Standard image High-resolution imageThe bank voltages and temperatures for each of the modules is shown in Fig. 10. During the overcharge of the fresh module, banks 2 through 8 underwent thermal runaway and caught fire as shown in Fig. 11b. Only bank 1 did not go into thermal runaway but was still overcharged up to 5.15 V. The voltage at which the CID activation in the cells occurred seemed to be consistently close to 5.15 V. This peak voltage on the banks corresponds to point D in Fig. 2. Upon activation of the CID, the voltage on banks 2 through 8 spiked above 15.6 V. Regarding the temperature of the banks, Fig. 10e, the maximum temperature recorded was 2299 °C in bank 2 whereas the lowest temperature was 352 °C in bank 1. The high temperatures recorded were due to the fire caused by the complete thermal runaway of all the cells as shown in Fig. 11b and the readings above 2000 °C on module 2 is due to the temperature reading exceeding the thermocouple and data collection capability.
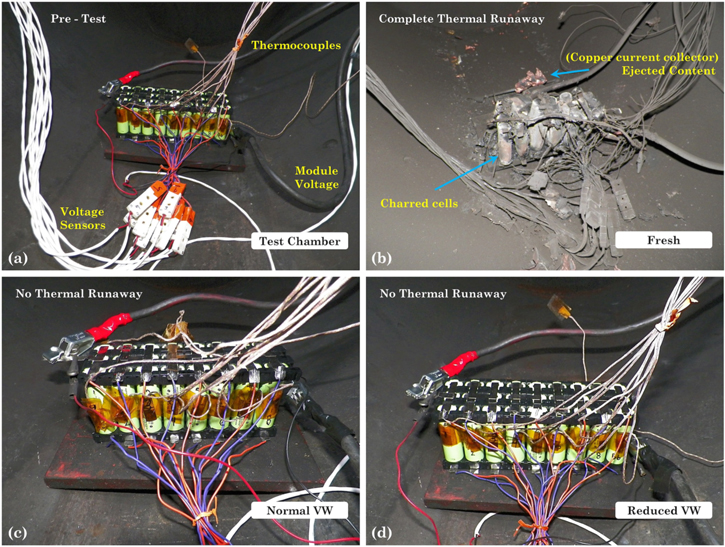
Figure 11. Pre- and post-test photos of the modules subjected to the overcharge test. (a) Module in test chamber before test. Overcharged modules: (b) fresh, (c) aged under the normal voltage window, and (d) aged under the reduced voltage window.
Download figure:
Standard image High-resolution imageDuring the overcharge of the module aged under normal VW, none of the banks went into thermal runaway. The maximum voltage that the banks reached, before the CID activation, was 5.20 V. Analysis of the thermal response, Fig. 10e, showed that the maximum temperature was 88.0 °C and it was observed in bank 4. The rest of the banks reached temperatures no higher than 60 °C.
During the overcharge of the module aged under reduced VW, none of the banks went into thermal runaway. Similar to the module aged under the normal voltage window, the maximum voltage recorded on the banks before the CID activation, was 5.20 V. Upon activation of the CID, the voltage on the banks reaches the compliance voltage of the equipment but the maximum voltage attained by each bank varied, as the voltage limit set on the equipment is based on the total module voltage. Analysis of the thermal response, Fig. 10f, showed that the maximum temperature recorded was 56.0 °C observed in bank 9. The rest of the banks reached temperatures no higher than 60 °C.
The overcharge test results showed that the two aged modules did not go into thermal runaway but the fresh one did. No visible degradation was found in the aged modules at the end of the overcharge test, see Figs. 11c, 11d. This indicates that off-nominal conditions such as overcharge do not cause a catastrophic effect on the aged modules as they do on the fresh cells. This could be attributed to the reduced energy content in the modules that reduces the temperatures achieved keeping the off-nominal condition benign. The early activation of the CIDs in the aged cells could have also led to a faster shutdown before the temperatures got too hot to cause a catastrophic failure. It should be kept in mind that these modules were aged to more than 20% cf One cannot conclude that aging to any level of capacity fade will result in the same benign behavior.
Electric vehicle usage testing results
The drive cycle depicting the demand from a vehicle while driving in a highway at an ambient temperature of T = 10 °C is shown in Fig. 12a. Two sets of three drive cycles were applied emulating driving a car for almost an hour followed by a full charge, as shown in Fig. 12b. The full cycling profile was repeated for a whole week, see Fig. 12c. After that the cell capacity and internal resistance were measured using the conditioning test protocol reported in Part I 19 and results are reported in Figs. 12d and 12e. These periodic capacity checks were used to determine when greater than 20% capacity loss was attained by the cells. Voltage response to the variable current showed a strong dependence on the operating temperature with much higher voltage changes in the cells aged at low temperatures. The discharge capacity, Fig. 12c, exhibited the characteristic aging decay similar to the conventional CC discharge profile but the extent of decay varied with the environmental temperature that the cells were tested in. Cells that underwent the drive cycle profiles at a low temperature, 10 °C, reached 20% CF in an average of 17 weeks. Low temperature increases the internal resistance of the cell rapidly due to the higher viscosity of the electrolyte at the lower temperatures which then promotes lithium plating and a fast rate of capacity reduction. 34 As the ambient temperature was increased to 25 °C, the cells could be cycled for an average of 29 weeks before 20% CF was obtained. As the ambient temperature was further increased to 40 °C, the performance and cycle life of the cells slightly decreased to an average of 22 weeks to obtain 20% cf By increasing the operating temperature, the transport and kinetic processes are improved, but the thickening of the SEI layer and the degradation of the organic solvents of the electrolyte increase significantly leading to a greater loss in performance. 35–37 In the case of internal resistance, its value increased in all cells as they aged. However, no evident trend was found regarding the effect of the environmental temperature.

Figure 12. Trends in capacity fade for the drive cycle discharge pattern (a) Drive cycle profile showing the charge and discharge pulses; and (b) representative full cycle (c) Weekly profile with observed temperature trends (d) Capacity fade for all three operating temperatures and (e) internal resistance measured every week.
Download figure:
Standard image High-resolution imageThree cells aged with the drive cycle, one from each environmental temperature set, were subjected to an overcharge test. The voltage and temperature response are shown in Figs. 13a and 13b. CID activation occurred first on the cell aged at 10 °C followed by the 25 °C cell around QOV = 0.5 Ah (114.7% SOC). The cell aged at 40 °C could be overcharged to QOV = 0.8 Ah (123.5% SOC) before the CID activation. This indicates that despite cycling them to the same extent of 20% CF, the degradation caused in the cells is different depending on the environmental temperature. A significant difference in response voltage is the peak voltage reached by the cell before failing. The maximum voltage achieved, decreased as the operating temperature increased. The maximum temperature of the cell, during overcharge, was also affected by the different environmental temperature conditions. The cell aged at 10 °C reached a maximum temperature of 54 °C and then decreased. On the other hand, the cell aged at 40 °C reached a maximum temperature of 98 °C.
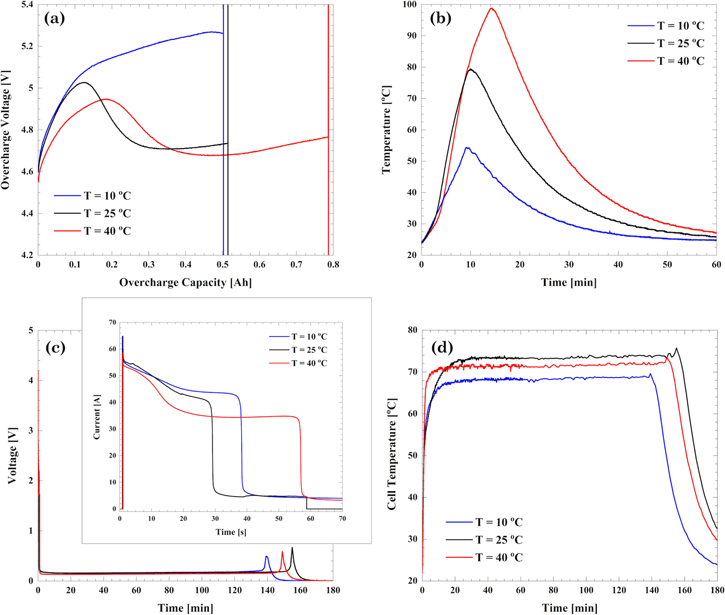
Figure 13. Overcharge and external short tests conducted on cells aged with the drive cycle pattern. (a) Voltage and (b) temperature response to the overcharge test; (c) Current and cell voltage and (d) temperature response to the external short test.
Download figure:
Standard image High-resolution imageThe results for the cells aged using the drive cycle protocols and then externally shorted with a 50 mΩ external load are shown in Figs. 13c and 13d. The maximum current recorded was 64 A, 64 A, and 58 A, for cells aged at environmental temperatures of 10, 25, and 40 °C, respectively. Due to the activation of the PTC present in the cell headers, the cell voltage for all the cells fell from 4.2 to 0.2 V in less than a minute. The low voltage due to the activated PTC is observed until most of the capacity from the cell is removed. The maximum temperature in all three cells was observed for approximately two hours. The maximum temperature recorded varied with the environmental conditions, for the cells aged at 10 °C, a maximum temperature of 68 °C was observed while the cell aged at 25 °C reached a maximum temperature of 74 °C. The end of the test was marked by a small voltage spike in the cell and a drop in temperature, Fig. 13c. This may be due to the resetting of the PTC which then drains the cell completely causing the complete drop in voltage.
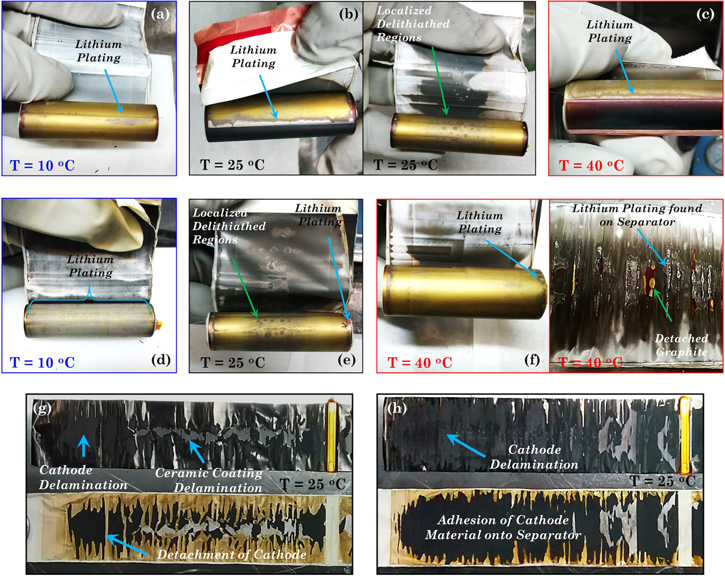
The post-mortem analysis of the cells aged with the drive cycle is shown in Fig. 14. A major observation was the fact that in all three cases, the aged electrodes displayed a lack of lithiation in the center one-third of the cell in the axial direction (Fig. 13b). The effect of aging the cells with the drive cycle protocol manifests as a non-uniform lithiation in the center of the electrode. This degradation appears as small dots scattered throughout the anode, Fig. 14b with a more visible evidence of lithium plating on the edges, Figs. 14a–14c. The overcharge test on the aged cells aggravates the degradation in the regions already degraded by the aging test, Figs. 14d–14f. The silver color on the overcharged electrode aged at 10 °C is lithium plated throughout the whole electrode, Fig. 14d. Lithium deposition occurred in a more localized way in the 25 °C overcharged cell where it was found in the center and the edges of the electrode, Fig. 14e. The excessive presence of lithium dendrites could have internally shorted the cell and caused the dark charred appearance in the separator. In the case of the 40 °C overcharged cell, the anode active material had detached from the electrode, and charring and residuals of lithium plating was found on the separator, Fig. 14f. Overcharge worsens the detachment of the cathode material and ceramic coating from the separator as shown in Figs. 14g and 14h. In the 25 °C overcharged cell, the shorting caused in the anode side transferred to the cathode side causing the presence of small spots on the cathode electrode where all the active material had delaminated and exposed the aluminum current collector Fig. 14h. The fact that the electrodes exhibit localized degradation as they age with the drive cycle can be interpreted as electrochemical interference. By charging and discharging the cell with a frequently fluctuating current, certain regions of the electrode especially near the center are neither fully lithiated nor fully delithiated compared to the rest of the electrode. This caused the variation in the extent of lithiation observed in the anode electrodes. Post-mortem analysis of the externally shorted cells did not show any additional degradation to the one caused by the aging process.
Figure 14. Photos showing the degradation found in anode and cathode electrodes from cells aged with the drive cycle profile. Anode electrodes extracted from aged (a)–(c) and overcharge aged (d)–(f) cells. Cathode electrodes extracted from the aged (g) and overcharged aged (h) cells. Operating temperature during aging is indicated on the picture.
Download figure:
Standard image High-resolution image
The external short circuit tests were conducted on the cells indicated in Part I as well in the cells aged with the drive cycle. 19 Despite the level of degradation or the operating temperature, the results did not show any significant difference between the cells that were fresh and those that underwent just aging as well as the aged cells that underwent the external short circuit tests hence they are not discussed in detail here. This may be due to the performance of the PTC in a similar manner irrespective of the aging process.
Conclusions
In this study, the analytics of degradation associated with overcharging fresh and cycle-life aged cells and modules is presented. A set of cells and modules cycle-life aged under two voltage windows and another set of cells subjected to cycle life aging using an EV drive cycle protocol at three different operating temperatures were subjected to overcharge and external short tests. The electrochemical, thermal, and morphological results for fresh single cells as well as for fresh cells and cycle-life aged cells subjected to safety are compared.
Electrochemical results for overcharge test indicate that all aged cells have their CID activated at similar times and this occurs in a shorter time frame compared to the CID activation in fresh cells. This is attributed to a collection of gases due to degradation reactions inside the cells during the aging process that causes an earlier CID activation. Without the presence of the CID, under an overcharge condition, the cell temperature would increase dramatically leading to a catastrophic fire and thermal runaway. In the case of the modules, the module with fresh cells undergoes catastrophic thermal runaway while the 20% CF aged modules cycled under the normal and reduced voltage windows do not undergo thermal runaway. This has been observed in the past in previous studies carried out internally by the authors. And this type of behavior is attributed to the significantly reduced energy, absence of free electrolyte and degradation of the electrodes observed in the aged cells. In the absence of cell balancing in the module configuration, voltage deviation with cycle life is observed and the deviations are more obvious in the discharge step than in the charge step. The voltage deviation was also significantly pronounced and resulted in hazardous high temperatures for the module cycled under the normal voltage window.
The CID activates and protects the cells from going into a catastrophic failure condition in all the cell level studies. The disconnection of the CID disks was verified by disassembling the head of each one of the cells. Inspection of the electrodes and separators shows less degradation in graphite compared to the cathode electrode and the separator facing it.
The electrochemical and thermal results for the externally shorted cells did not show a clear trend with respect to the capacity fade effect. PTC activation protects the cells from the large current demanded by the external short circuit load and regulates the thermal response. Despite the PTC activation, degradation on the anode was observed on the externally shorted fresh cell. No major difference was observed with the fresh or cycle-life aged cells with respect to electrode and separator morphology that were subjected to the short circuit tests.
Cells aged with the drive cycle pattern took different times to achieve greater than 20% capacity loss based on the environmental temperatures they were cycled in. All cells showed localized degradation of anode with non-uniform lithiation and charring of the separator. Overcharged cells aged at low temperature produced more lithium plating but generated the least amount of heat.
The stress-induced by aging combined with the overcharge test exacerbates the cathode electrode degradation. The aging process causes dissolution and migration of the Ni and Co metals that leads to a cracking of the electrodes. When the degraded electrodes are taken into an overcharge condition, further heating occurs that causes the ceramic coating from the separator facing the cathode side to stick to the cathode or for the cathode active material to stick to the coating on the separator. Degradation induced in the graphite electrodes is found to be caused by lithium plating specially on the electrode edges.
Acknowledgments
Financial support from Underwriters Laboratories (UL) is gratefully acknowledged for funding the research carried out in the Energy and Transportation Sciences Lab (ETSL) at Purdue University. Dr. Juarez Robles was a graduate student in the ETSL at Purdue University under Dr. P. Mukherjee's guidance at the time this work was carried out. The use of microscope at Birck Nanotechnology Center at Purdue University is acknowledged. The safety tests at the module-level was carried out by Dr. Surampudi and his team at Southwest Research Institute (SWRI), San Antonio, TX.