

Abstract
Entangled stainless steel single wire was used as a promising 3D anode for Microbial Fuel Cells (MFCs). Two complementary techniques were coupled to precisely characterize the anode structure and activity: X-Ray Computed Tomography (XRCT) and Electrochemical Impedance Spectroscopy (EIS). XRCT provides an acurate estimation of the pore distribution and size while EIS allows to check and monitor the electrochemical activity. Electrochemical measurements were performed with activated sludges and synthetic medium at an imposed potential of −0.2 V vs Ag/AgCl in a single chamber MFC. Modified Transmission Line Model was used to follow the evolution of the anode in both media including the formation and the growth on the biofilm.
Export citation and abstract BibTeX RIS
The environment that surrounds us contains a multitude of potential sources of energy, sometimes even unsuspected. In the current environmental context, a lot of research is being conducted today in the field of alternative energies (wind, solar, hydraulic, geothermal,....) aiming at a massive production of electricity. But a myriad of solutions on a much smaller scale are also being developed. They could make it possible to convert into electricity even the smallest amounts of energy available in the surrounding environment or extracted from human activity: these are named energy harvesting solutions. Microbial Fuel Cells (MFCs) are a perfect illustration of this type of solutions.
In bioelectrochemical systems such as MFCs, a respiration mechanism converts part of the energy contained in various biodegradable substrates into electricity. The anode material can be used as a final electron acceptor by the exo-electrogenic micro-organisms that will grow on its surface. 1
Given that it is an energy harvesting solution, the challenges are obviously to obtain the best possible power densities but with the lowest possible cost, ensuring the good stability over time of the material and its easy use at industrial scales. These essential compromises led us to use stainless steel anodes which appears to be a promising material because, in addition to the criteria previously mentioned, it exhibits a high electrical conductivity, high mechanical properties and easy formability. 2–4 In order to improve the performance of this electrode, a simple and effective method was also employed: the architecturization of the electrodes. 5–7 The use of 3D anodes, like entangled single wire used in this study, permits an increase in the specific surface area (in m2/m3) of the electrode and thus provides the micro-organisms a larger surface area for growth. The intrinsic dimensions must be optimized to promote mass transport within the entire developed surface. 7 The size of the porosities is a particularly important parameter to control. Using anodes with too small pores would lead to clogging problems, conversely, using anodes with too large pores would reduce the active surface of the electrode and in both cases this would lead to a decrease in performance.
3D characterization of architectural materials is particularly complex. X-Ray Computed Tomography (XRCT) is one of the few techniques that is particularly relevant to tackle this challenge. This non-destructive technique indeed allows to reconstruct a volumetric image of the material from 2D radiographies taken at different viewing angles. Now very commonly used in material science, this technique is also beginning to make its mark in the field of batteries and fuel cells 8–15 where it provides valuable information on the morphology of electrode materials. In this paper, XRCT will be used to determine the pore size within the highly porous anodes employed.
The use of 3D electrodes for electrochemical devices increases the active surface, thus enhances the performance. However, regarding the architecture of the electrode, the exact determination of active surface and overall reactivity is still challenging. Indeed as a function of the pore size, tortuosity and connectivity, distribution of kinetics of the desired electrochemical reactions could be observed due to local electrolyte and surface modifications, diffusion of reactive species through the structure. 16–18 Determining accurately the interface kinetic and transport parameters is still the main issue for 3D electrode characterization. Moreover, the heterogeneity of reactivity is enhanced in the case of MFC by the essential presence of micro-organisms that form clusters rather than a homogeneous biofilm at the surface of the electrode. Electrochemical Impedance Spectroscopy measures the dispersion of time constants at electrolyte/electrode interface. It is often used to characterize porous or 3D electrodes. It allows the in situ determination of the different electrochemical parameters useful for the monitoring or the optimization of the electrode. Regarding how geometrical parameters affect the electrochemical response, different impedance analyses inspired by the De Levie impedance which considers the reactivity inside a cylindrical pore, were proposed. 19 The Transmission Line Model (TLM) which is directly related to the De Levie approach was mainly used to study porous electrodes in the case of both faradaic and non faradaic processes. 17,20–24 In different works, TLM was modified and adapted to the complexity of the electrode, and the literature is full of different equation forms. 17,22,24 Generally, numerous geometrical parameters, as depth of pore, diameter of pore or tortuosity need to be fitted or postulated in addition to the electrochemical parameters. By only performing Electrochemical Impedance Spectroscopy (EIS) with numerous unknown parameters, it is sometimes a real issue to accurately assess all the parameters and thus characterize electrochemically such electrode. The use of other characterization techniques (such as XRCT in this study) can provide useful information, complementary to EIS.
This paper shows the interest of XRCT / EIS linkage in the field of bioelectrochemical systems. Tomography data have been coupled with EIS measurements to develop models integrating the dimensional characteristics of architected electrodes and provide considerable and in-depth information on the metabolism of exo-electrogenic bacteria, electron transfer mechanisms, material and surface properties of the electrodes. This is essential for understanding the processes involved in electricity generation and their limiting factors in order to improve the energy efficiency of MFCs.
Experimental
Fabrication of anodes
The anodes used in this study were made from an entangled 304L stainless steel monofilament. They were shaped by oedometric compression: the monofilament was first entangled manually to obtain a homogeneous ball, and then, was placed in a matrix where a piston was used to compress it (Fig. 1). 25

Figure 1. Anode shaping: (a) manual preforming then (b) compression in a mould.
Download figure:
Standard image High-resolution imageMorphological characterization of anode
The thickness of the anode, Thanode , was directly controlled by the displacement applied on the piston. The diameter of the anode, ∅anode was equal to the diameter of the mould used. The projected surface, Sprojected , could be determined by the formula:

The diameter of the wire used, ∅wire, as well as its length, Lwire , being perfectly known, the anode developed surface, Sdevelopped , also called active surface, was easily calculated as:

The volume fraction of wire in the anode, Vf , is also simple to determine with the formula:

All units are in meters.
The pore size was determined by X-ray tomography. A non-destructive, three-dimensional technique, the principle of X-ray tomography is illustrated in Fig. 2 and a very detailed description is available in the many articles, for instance in 26 . The method provides a volumetric image of the reconstructed specimen from 2D radiographs taken from different viewing angles. It is based on the difference in X-ray absorption of the different phases that are part of the material. In the present study, the samples were scanned in a v∣ tome ∣x s tomograph from GE Sensing & Inspection Technologies Phoenix X∣ ray equipped with a Varian Paxscan detector with a 1920 × 1536 pixels matrix.
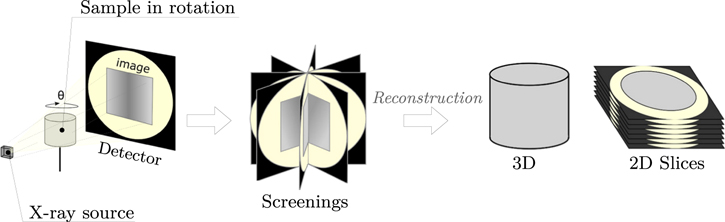
Figure 2. Principle of X-ray tomography. 27
Download figure:
Standard image High-resolution imageThe acquisitions were carried out with a polychromatic source operating at a voltage of 120 kV and a voxel size of 30 μm3. The reconstructions were obtained using the commercial software supplied with the tomograph.
The analysis of the X-ray tomography data was carried out using Fiji software. 28 The method used is summarised in Fig. 3. The Computed Tomography (CT) volumes were first processed with a median filter to smooth the image and were then segmented. The pore size was next determined using a granulometry tool (Local Thickness plugin 29 ). This tool measures the size of the largest possible sphere located in each pixel of the pores. A histogram of the size distribution of the pores can then be plotted.

Figure 3. Principle of image analysis: (a) volume just after reconstruction; (b) threshold volume; (c) examples of parameters available with X-ray tomography (3D rendering, pore size, ...).
Download figure:
Standard image High-resolution imageFor this 3D characterization, the anodes used in tomography were manufactured identically to the anodes embedded in the MFC but with smaller dimensions. The tomograph used in this study did not allow imaging the anodes in their entirety because the absorption of X-rays was too high through them. Tests were carried out with different matrix diameters (15 and 40 mm) and showed that this parameter had a very limited influence on the diameter of the pores formed within the entanglement. The results presented in this article refer to those obtained with 40 mm diameter anodes. Parameters that have an important influence on the pore size are rather the volume fraction of wire within the anode and the diameter of the monofilament used. We therefore assume in the rest of the paper that the pore diameters measured in tomography are representative of those found within the anodes.
Table I summarises the architectural parameters of the anodes tested in this study.
Table I. Anode parameters.
| Wire diameter, ∅wire | 280 μm |
|---|---|
| Wire length, Lwire | 169 m |
| Anode diameter, ∅anode | 115 mm |
| Anode thickness, Thanode | 10 mm |
| Volume fraction, Vf | 10 % |
| Projected surface, Sprojected | 104 cm2 |
| Active surface, Sdvelopped | 1480 cm2 |
Experimental electrochemical protocol
The stainless steel wire entangled anodes were embedded in single compartment MFCs with an electrolyte volume of 1100 ml (Fig. 4). These reactors were equipped with air-cathodes manually manufactured according to the process described by Middaugh, 30 with a layer of platinum-based catalyst (0.5 mg. L−1) applied on the side in contact with the electrolyte in order to improve the oxygen reduction reaction. The air-cathode had a developed surface area of 95 cm2. A reference electrode (Ag/AgCl) was placed at an equal distance of 2 cm from the two MFC electrodes. The MFCs were inoculated with two batches of activated sludge collected at the Feyssine wastewater treatment plant (Villeurbanne, 69100 FRANCE). After 10 days of inoculation, the activated sludge was replaced by a synthetic medium doped with acetate (1 g. L−1). This medium was then regularly renewed as soon as substrate shortages were observed with sudden drops in performance. Tests were carried out at room temperature and in the dark to prevent algae formation. The ionic conductivity of the synthetic medium used was 3.2 mS. cm−1 and the pH was 7.2. During the entire test (inoculation and monitoring), a potential of −0.2 V vs Ag/AgCl was imposed at the anode. The choice of this potential is consistent with literature 31 and will be discussed according to the polarization curve.
Electrochemical characterization of the studied anode
The electrochemical measurements were carried out using an Interface 1000 potentiostat from Gamry instrument. The previously described single compartment MFC outfitted with an Ag/AgCl reference electrode was used as 3-electrode set-up. The stainless steel wire entangled anode and the air-cathode were considered working electrode and counter electrode, respectively. Reproducibility of the measurement was validated through three different measurement campaigns. Only representative results were reported in the presented work.
Polarisation curve
After 16 days of operation (at an imposed potential of −0.2 V vs Ag/AgCl), the electrochemical behavior was determined using linear scanning voltametry. The potential applied to the anode varied linearly from −0.65 to +0.2 V vs Ag/AgCl with a scanning rate of 1 mV. s−1.
Chronoamperometry and electrochemical impedance spectroscopy
For the duration of the test, a potential of −0.2 V vs Ag/AgCl was imposed at the anode and the current was recorded every 300 s. EIS tests in potentiostatic mode were carried out every 24 hours at the same potential to describe the interface state and reactivity. Impedance measurements were performed over the frequency ranging from 100 kHz to 1 mHz, with 9 points per decade and a sine wave of 10 mV amplitude signal. For the sake of clarity, only the impedance diagrams obtained at 24 h, 72 h and 120 h for the first and second inoculation periods (activated sludge 1 and 2) and for testing period (synthetic medium) are shown in the present manuscript.
Theoretical Approach
Impedance diagrams were analysed using enhanced graphical representation and analysis and a non-commercial fitting software developed at the LISE CNRS, Paris. As the entangled wire anode could be considered a macroporous electrode, a model derived from the transmission line model (TLM) was used. 17,24 In the present case, charge transfer occurs at the electrode surface in presence of the biofilm. Consequently, we have to consider the following expression of the impedance described for cylindrical pores by use of the transmission line model:
Where ω is the pulsation (s−1), Rion,L is the ionic resistance per unit pore length (Ω. cm−1), Rct,A is the charge transfer resistance per unit surface area (Ω. cm2), Cdl,A is the electric double layer capacitance per unit surface area (F. cm−2) and r and L are the average radius of the pores and the total thickness of the electrode. In the present work, the total thickness was fixed to 1 cm (geometrically determined) and the average radius was determined by X-ray tomography. Rion,L is a characteristic parameter that expresses the mobility of charged species inside the electrode mesh. In this equation, the electrochemical reaction is assumed to occur similarly on the overall active surface. Indeed, Rct,A and Cdl,A should be constant along the wall of the pores. With the studied electrode, it is not the case for, at least, two reasons: the electrode is not fully recovered by the bacterial film (even after inoculation) and some bacterial clusters are reported at wire crossing; the electrode is made of stainless steel, a passive material, for which a constant phase element (CPE) behavior is generally observed at high frequency rather than a pure capacitance. For these reasons, the capacitance used in Eq. 4 is replaced by the impedance of a CPE:

In Equation 5, Q is the CPE parameter and α the CPE exponent accounting for the non ideality of the surface. α value is included between −1 and 1. CPE behavior is generally observed when there is a time constant distribution at the electrode surface due to electrode surface heterogeneity, geometry of the electrode or in presence of dielectric film (as passive film). Using enhanced graphical representation of the impedance data as proposed in 32 it is generally possible to determine α and Q. In the present case, the electric double layer capacitance per unit surface area (F. cm−2) could be calculated from the CPE by the Brug formula 33,34 considering a surface dispersion of the time constant. Taking into account the dispersion of the time constants at the surface of the wire entangled electrode, the anode impedance is then calculated by (Eq. 6):
The overall impedance measured (in Ω) may be calculated by:

Where Rsolution is the resistance of the solution (depending on the distance between the anode and the reference electrode). According to Eq. 7, the limiting values of the real and imaginary parts, Z' and Z'' respectively, as the frequency tend to 0 may be written as follows:

Where Rion is the ionic resistance in pores (Rion = Rion,L . L, in Ω) and Rct is the total charge transfer resistance (Rct = Rct,A /2πrL, in Ω). In most of the cases, these parameters can be determined graphically on Nyquist diagrams. 24 This graphical determination is useful to discuss the results obtained by the fitting software. In the present study, it is worth mentioning that almost all the parameters used to describe the reactivity of the interface could be estimated by another way than by software fitting procedure. Geometrical parameters were determined by physical techniques as XRCT while numerous electrochemical parameters were assessed by different graphical representations of the impedance data. This methodology insures the consistency of the fitting and the physical meaning of the parameters.
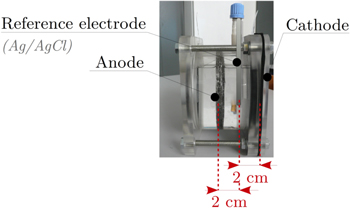
Figure 4. Experimental set-up. 3-electrode assembly: working electrode = anode, counter electrode = air-cathode and reference electrode = Ag/AgCl electrode.
Download figure:
Standard image High-resolution imageResults and Discussion
Determination of pore size
The pores within the entanglements are quite heterogeneous in size. An important edge effect can be observed within these materials: the wire tends to press against the walls of the mould when the entanglements are shaped and therefore the pores found in the central part of the anode are much larger than those at the edge. Figure 5 shows the pore size distribution measured in the studied anode. The dispersion of the pore size reach a maximum around 1–1.5 mm with an average measured pore diameter equal to 2.02 mm. This indicates that the anode could be considered as a meso-macroporous electrode. This finding has to be taken into account to model the electrochemical behavior of the electrode. A pore radius around 1 mm will be used for the analysis of the impedance diagrams.
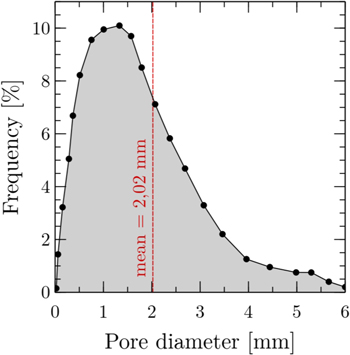
Figure 5. Pore size distribution within the anodes.
Download figure:
Standard image High-resolution imageElectrochemical characterization
Polarisation curve
To determine the most suitable working potential to be applied to the anode, a linear sweep voltametry test was carried out. The polarizarion curve shown in Fig. 6 exhibits the common trend of anode. The zero current potential was −0.47 V. The quasi-linear shape of the curve from −0.47 V to 0.098 V vs Ag/AgCl seems to indicate an ohmic behavior of the electrode.

Figure 6. Anode polarization curve.
Download figure:
Standard image High-resolution imageThe potential value of −0.2 V vs Ag/AgCl is included in this electrochemical regime and appears to be an interesting compromise allowing a high generated current and preventing other anodic reaction contributions or depletion of reactive species. Moreover, this choice is consistent with the work of Aelterman, 31 who showed that a potential of −0.2 V vs Ag/AgCl was optimal because it allowed faster biofilm growth, was more electrochemically active and resulted in higher electricity generation.
Anode current evolution over time
The results of chronoamperometric measurements carried out with an applied potential of −0.2 V vs Ag/AgCl are shown in Fig. 7. During the first inoculation period, the current remains constant at a low value up to 72 h. After this latency period, The increase in current indicates that the biofilm is nucleated but does not cover totally the anode or is not totally active. After 72 h, the anodic biofilm begins to form on the surface of the anode and electron transfer between the micro-organisms and the anode material starts. After 96 h, the current reaches a plateau at 2.4 mA. Steady state is achieved. During the second inoculation, the latency phase is reduced. In fact, after 24 h, the same plateau is reached. When the cell is supplied with the synthetic medium, a drop of current and a new latency period are observed. The biofilm needs time to accommodate to the new electrolyte. After 72 h, the steady-state is then achieved and a current plateau at 15.1 mA is reached. Note that the change of the solution has an effect on the activity of the micro-organisms who need time to reach their optimal activity.

Figure 7. Anode current evolution over time.
Download figure:
Standard image High-resolution imageEvolution of the anode/electrolyte interface: Analysis of the EIS diagrams
Nyquist representations of the impedance data obtained at 24 h, 72 h and 120 h during inoculation 1, inoculation 2 and in service are plotted in Figs. 8, 9, 10 respectively. Dashed lines display the results of the fitting using Eq. 7. Experimental impedance diagrams and fitted curves are close, except at low frequencies, where the EIS signal is disturbed and not exploitable (loss of stationarity or causality). The fit is consistent with the experimental diagram.
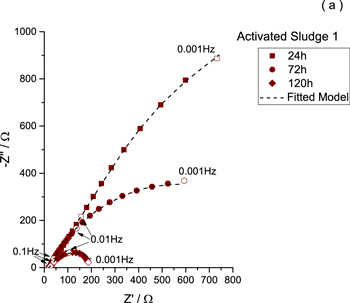
Figure 8. Nyquist representations of the impedance data obtained at 24 h, 72 h and 120 h during inoculation 1.
Download figure:
Standard image High-resolution image
Figure 9. Nyquist representations of the impedance data obtained at 24 h, 72 h and 120 h during inoculation 2.
Download figure:
Standard image High-resolution image
Figure 10. Nyquist representations of the impedance data obtained at 24 h, 72 h and 120 h in service.
Download figure:
Standard image High-resolution image
For all the reported results, the impedance diagram is composed of three parts: the first part at high frequencies is related to the reference electrode or set-up artefact; then at high-middle frequencies (in a restricted frequency range), the impedance diagram reveals a linear tendency related to a diffussive behavior through the mesoporous structure and finally a depressed semicircle more or less defined, linked with the charge transfer at the electrode surface. In Fig 8, the size of the semicircle decreases with time suggesting that the electrode surface is modified and that charge transfer is promoted. In the case of the second inoculation (Fig 9), impedance diagrams are almost the same. This finding proves that the stationarity is reached. The biofilm is mature and stable. Finally, when the medium is changed (from activated sludge to synthetic medium), it is necessary to wait for the adaptation of the bioactivity before reaching again stability. Indeed after 24 h, the impedance diagram highlights a capacitive behavior, while for 72 h and 120 h the size of the semicircle is small indicating a small polarization resistance for this system.
All the fitted parameters obtained by the adjustment of the impedance spectra are reported in Table II. The calculated total charge transfer resistance Rct (Rct = Rct,A /2πrL, in Ω) and the total electric double layer capacitance Cdl (Cdl = Cdl,A × 2πrL, in F ) are also reported in this table. Among the adjusted parameters, the thickness is fixed to 1 cm, i.e. equal to the thickness of the electrode. Conversely, the average radius is a "free" fitted parameter. Then, it is worth mentioning that the obtained value is straightforwardly consistent with the value obtained by the X-ray tomography measurement. Moreover, the fact that it remains the same for all the adjusted impedance diagrams also indicates a good adjustment accuracy.
Table II. Electrochemical parameters and their deviation determined by fitting the impedance spectra obtained at −0.2 V vs Ag/AgCL as a function of time and medium.
| 24 h (activated sludge 1) | 72 h (activated sludge 1) | 120 h (activated sludge 1) | 24 h (activated sludge 2) | 72 h (activated sludge 2) | 120 h (activated sludge 2) | 24 h (synthetic medium) | 72 h (synthetic medium) | 120h (synthetic medium) | |
|---|---|---|---|---|---|---|---|---|---|
| Rsolution (Ω) | 20,3 ± 0,2 | 17,8 ± 0,4 | 19,1 ± 0,2 | 20,5 ± 0,2 | 21,4 ± 0,4 | 23,4 ± 0,3 | 8,8 ± 0,4 | 8,9 ± 0,2 | 9,8 ± 0,5 |
| Rion,L (Ω. cm−1) | 9,9 ± 0,8 | 10,0 ± 1,2 | 14,8 ± 0,9 | 11,8 ± 1,0 | 30,0 ± 2,2 | 32,0 ± 3,2 | 6,0 ± 0,6 | 3,5 ± 0,9 | 1,6 ± 0,2 |
| Rct,A (Ω. cm2) | 13 055 undefined | 694 ± 22 | 128 ± 5 | 129 ± 2 | 179 ± 8 | 144 ± 8 | 1,3.107 undefined | 3,3 ± 0,4 | 2,5 ± 0,3 |
| Qdl,A (F. sα−1. cm−2) | 0,038 ± 0,012 | 0,052 ± 0,002 | 0,075 ± 0,010 | 0,062 ± 0,005 | 0,078 ± 0,011 | 0,089 ± 0,014 | 0,052 ± 0,008 | 0,146 ± 0,007 | 0,130 ± 0,014 |
| α | 0,65 ± 0,04 | 0,72 ± 0,01 | 0,70 ± 0,02 | 0,62 ± 0,03 | 0,75 ± 0,02 | 0,75 ± 0,03 | 0,82 ± 0,01 | 0,71 ± 0,02 | 0,60 ± 0,05 |
| Cdl,A (mF. cm−2) | 2,09 ± 0,10 | 7,03 ± 0,09 | 7,07 ± 0,05 | 2,43 ± 0,07 | 1,19 ± 0,05 | 13,42 ± 0,10 | 19,09 ± 0,07 | 30,81 ± 0,08 | 36,09 ± 0,11 |
| L (cm) | 1 undefined | 1 undefined | 1 undefined | 1 undefined | 1 undefined | 1 undefined | 1 undefined | 1 undefined | 1 undefined |
| r (cm) | 0,11 ± 0,01 | 0,11 ± 0,02 | 0,13 ± 0,01 | 0,10 ± 0,01 | 0,12 ± 0,04 | 0,12 ± 0,05 | 0,10 ± 0,01 | 0,11 ± 0,01 | 0,10 ± 0,02 |
| Rct (Ω) | 20788 undefined | 1395 ± 22 | 204 ± 5 | 206 ± 2 | 220 ± 8 | 211 ± 8 | 2,4.107 undefined ± 5 | 5,3 ± 0,5 | 4,7 ± 0,5 |
| Cdl (mF) | 1,31 ± 0,11 | 4,41 ± 0,10 | 4,44 ± 0,06 | 1,53 ± 0,08 | 9,08 ± 0,08 | 10,71 ± 0,13 | 14,31 ± 0,08 | 19,42 ± 0,11 | 19,33 ± 0,12 |
The solution resistance remains stable for the activated sludge during both inoculation periods with a value two times higher than for the synthetic medium. During all the period using synthetic medium the solution resistance is constant. These findings indicate that all along the test, the solution is not modified by the bioactivity. Most of the time, the value of Rion,L stays at a value of a few Ω or a few dozens of Ω which proves that with the studied 3D structure, there is no limitation by the transport of ionic species or nutriment inside the pores.
According to the evolution of the current during the first inoculation period (Fig. 7), Rct,A decreases with time. The important value of Rct,A after 24 h suggests that the biofilm is not well-established and that the electrode is passivated. The native passive film grown on the surface of the stainless steel acts as a protective barrier. The biofilm seems to be well-developed 120 h after the inoculation period. The value of Rct,A proves that the native passive film is modified by the presence of the micro-organisms. The interface is less resistant to charge transfer. Different hypotheses could be proposed: micro-organisms are embedded in the passive layer and act as a local short-circuit; passive film is broken down by the presence or the activity of the micro-organisms. Whatever the real phenomenon, the value of Rct,A indicates that the current is correctly collected by the electrode. During this first inoculation period, Rion,L slightly increases suggesting a small slowdown of the ionic species transport through the electrode or a local depletion of nutriments due to micro-organisms consumption. It is also possible that for long time immersion with activated sludge, nutriments could sediment and limit the activity of the micro-organism. The slight increase of the double layer capacitance confirms the modification of the electrode/solution interface and the passive behavior of the stainless steel at the beginning of the test.
For the second inoculation period, steady state is reached 24h after the renewal of the activated sludge. The value of Rct,A and Rion,L are similar to the ones obtained at the end of the first inoculation. Besides, Rct,A remains constant and relatively low during all this second inoculation period. Rion,L increases for the reasons mentioned above. Cdl,A increases during this second period suggesting that even if the biofilm is formed and steady state is achieved, maturation of the biofilm still occurs.
When solution is changed and synthetic medium is used, the evolution of the current shown in Fig. 7 points out that a latency period is again required to achieve functional steady-state. At 24 h, Rct,A exhibits a high value related to the biological inactivity of the micro-organism caused by the solution change. This very high value seems to confirm that the passive film still exists at the surface of the electrode protecting it against corrosion. After 72 h, Rct,A reaches a lower value which remains similar at 120 h. The activity of the micro-organisms reaches its optimum for the considered applied potential. Rion,L decreases with time indicating that the transport of reactive species is not limited through the electrode. In addition, Cdl remains constant after 72 h evidencing that steady state is achieved in terms of charge transfer, but also maturation and activity of the biofilm. At this stage, Rsolution , Rion and Rct are in the same order of magnitude (few Ω). This result clearly evidences that 3D entangled wire anodes do not provide limitation in terms of efficiency and performance of the fuel cell. Furthermore the value of Rsolution is higher than the two others suggesting that the limitation for the anodic part of the fuel cell is rather related to the conductivity than to the charge transfer at the surface of the electrode. 35
Conclusions
Accurate characterization and monitoring of 3D anodes by coupling X-Ray tomography and EIS were presented in this paper.
X-ray tomography, although new in the field of MFCs, proved to be a very relevant technique to precisely characterize the morphology of 3D anodes. In this study, it was used to show the non-homogeneous distribution of porosities within a stainless steel entanglement with larger pore sizes in the center of the material. The pore size distribution shows a maximum around 1–1.5 mm, a meso-macrovalue that was retained for impedance analysis.
Electrochemical measurements performed in a single chamber MFC for activated sludge and synthetic medium demonstrates:—At least 96h is required in activated sludge to achieve the stability of current for an applied potential of −0.2 V vs Ag/AgCl. After this delay, the biofilm is formed and maintains an electrochemical activity. -A current of 2.4 mA was obtained in activated sludge while for synthetic medium the maximum current was 15.1 mA. The use of X-ray tomography results and enhanced graphical determination of impedance parameters allow in-depth characterization of the evolution of the surface of the anode using modified TLM. The high polarization resistance of the anode due to passive film decreases significantly during the formation and growth of the biofilm, even if the latter do not fully cover the electrode (micro-organisms cluster). Moreover, EIS results indicate that the main limitation of this single MFC chamber is the resistance of the electrolyte which is 2 times higher than the charge transfer resistance. Optimization of the distance between electrodes or design of the cell are then required improvements for the development of the MFC technology.
Data availability
The raw/processed data required to reproduce these findings cannot be shared at this time because of technical or time limitations.
Acknowledgments
This study was supported by Rhône-Alpes Region (ARC Energy).