
Abstract
The initiation of corrosion can be triggered by defects in the adsorbed layer of organic inhibitors. A detailed knowledge of the intermolecular forces between the inhibitor molecules and the interfacial bonding will be decisive to unravel the mechanisms driving the corrosion initiation. In this work, adsorbed organic layers of 2-mercapto-5-methoxybenzimidazole (SH-BimH-5OMe) and 5-amino-2-mercaptobenzimidazole (SH-BimH-5NH2) were compared regarding their performance mitigating copper corrosion. Atomic force microscopy was used to address the stability and intermolecular forces of the self-assembled monolayers, using imaging and force measurement modes. For a film formed by amino-derivative molecules, a gold-coated tip frequently picked up individual molecules (molecular fishing) in force-distance measurements. For layers of the methoxy-derivative, no fishing events were observed, pointing to a constant functional layer. X-ray photoelectron spectroscopy revealed that SH-BimH-5OMe molecules form a stronger bond with the surface and more stable SAM layers on Cu surfaces as compared to SH-BimH-5NH2 molecules. Results of computational density functional theory modeling and electrochemical corrosion tests are in line with the microscopy and spectroscopy results. In particular, with aid of computational modeling the less ordered structure of the SH-BimH-5NH2 monolayer is attributed to dual bonding ability of SH-BimH-5NH2 that can adsorb with either S or NH2 groups.
Export citation and abstract BibTeX RIS

This is an open access article distributed under the terms of the Creative Commons Attribution Non-Commercial No Derivatives 4.0 License (CC BY-NC-ND, http://creativecommons.org/licenses/by-nc-nd/4.0/), which permits non-commercial reuse, distribution, and reproduction in any medium, provided the original work is not changed in any way and is properly cited. For permission for commercial reuse, please email: permissions@ioppublishing.org.
Copper and copper alloys were probably the first metals used in ancient times to improve human life. 1 Nowadays, their use is widespread in a broad range of applications owing to their high electrical and thermal conductivities as well as mechanical workability. Copper and its alloys are used as wires, sheets or pipes employed in power stations, heat exchangers, cooling towers and marine industry, 2 they are also found as ancient artifacts to be kept in museums. In all this context, Cu corrosion is a major subject of concern regarding the structural integrity and functional performance of Cu-systems. At the same time, knowledge of fundamental corrosion processes 3–6 is important for understanding corrosion, interface science in general, as well as surface technology. Corrosion is a spontaneous (electro) chemical process, governed by laws of thermodynamics. It causes the degradation of metal structures and devices and thus creates a significant economic burden to renovate or replace degraded structures or to develop new materials. About 3% of the world's GDP is annually spent for corrosion-related loss and maintenance, and any sustainable way to reduce this huge economic loss has a big impact. 7–10 Copper is a rather noble metal and shows a high corrosion resistance when exposed to the atmosphere or to some chemical environments due to the formation of a passive oxide film. However, in aqueous environments containing anions such as chloride or sulfate, the probability of formation of a passive oxide film is low. 11,12
Corrosion inhibitors, divided into inorganic and organic inhibitors, reduce the rate of corrosion and degradation. 13 In the last decades, research has been devoted to copper corrosion and protection by selecting appropriate non-toxic and eco-friendly corrosion inhibitors in order to minimize corrosion-related damages. In general, the efficiency of inorganic inhibitors is lower than that of organic ones. The efficiency of organic inhibitors depends on several factors such as i) the metal (oxide)−organic adsorbate interaction (number of binding sites, nature of the bond and formation of metallic complexes, or bond strength), ii) properties of the film (strength of van der Waals forces and related film order, stability, film dimensions) and iii) external factors (solution pH, temperature). These factors render the selection of corrosion inhibitors for copper not straightforward and have motivated the study of a plethora of organic inhibitors among which azoles (benzotriazoles, imidazoles, thiazoles) are by far the most studied, showing high corrosion inhibition efficiency in general. 14–18 In azole compounds, the hetero elements such as N, O, or S with lone pair electrons enable chemical adsorption of azole molecules onto Cu surfaces. 15,19,20
The efficiency of organic inhibitors is traditionally evaluated using methods that provide macroscopic insights into the corrosion (inhibition) processes and their products, such as weight loss measurements, potentiodynamic polarization curves and electrochemical impedance spectroscopy. 21–23 Information at the nanoscale level is typically obtained from ex situ characterization tools using imaging and surface analytical methods to reveal the morphology and composition of the samples after corrosion. 18,24–26 Molecular simulations have provided valuable information at the atomic level regarding the molecular adsorption probabilities and corresponding bonding energies of organic inhibitors to copper. 27–37 Despite considerable efforts devoted to unravel the mechanisms of copper corrosion inhibition by a large variety of organic molecules, there is a need to provide a unified picture combining in situ nanoscale experiments and molecular simulations and further link the nanoscale information to macroscale corrosion inhibition efficiency. 3
To this end, atomic force microscopy (AFM), and more specifically AFM-based force spectroscopy, is a versatile tool to study surface−molecular interactions in situ at a nanoscale level and evaluate molecular film stability. 38,39 Scanning force-measurement imaging (also called quantitative imaging or QI-mode) is a specific type of AFM force-spectroscopy representing dynamic 2-dimensional (2D) force vs tip−sample distance curves taken at each pixel of an array. Here, we performed in situ QI-mode force spectroscopy on self-assembled monolayers of two benzimidazole-based molecules formed on Cu surfaces in the presence of a corrosive aqueous sodium chloride (NaCl) salt solution. Two molecules from the mercapto-benzimidazole family were selected (Fig. 1a). The first molecule is 2-mercapto-5-methoxybenzimidazole (SH-BimH-5OMe), with a methoxy group at the benzene ring as the second end-group. The second molecule is 5-amino-2-mercaptobenzimidazole (SH-BimH-5NH2) with an amino group at the benzene ring as the second end-group. Both molecules were chosen to have a similar chemical structure and differ only in the second end-group. Such mercapto-based benzimidazoles have been widely employed for Cu corrosion protection. 40–44 Mercaptobenzimidazoles and their derivatives exist in two tautomer forms, thiol (C−SH) and thione (C=S), with thione being about 0.5 eV more stable than thiol in aqueous solution (Fig. 1a). 30,41 Thiones are not only more stable but also adsorb stronger than thiols, although DFT calculations indicate that both of them can undergo transformation to thiolates by cleaving either the S–H (thiol) or the N–H bond (thione). 30 Due to inferior stability of thiols and their propensity to quickly transform to thiolates, 30 only thione and thiolate adsorption modes are considered herein (Fig. 1b). It should be noted that the labels SH-BimH-5OMe and SH-BimH-5NH2 will be used as generic labels for the two molecules without any reference to specific molecular tautomer form, whereas labels S-BimH2-R and S-BimH-R (R = 5OMe or 5NH2) will specifically indicate thiones and thiolates, respectively.
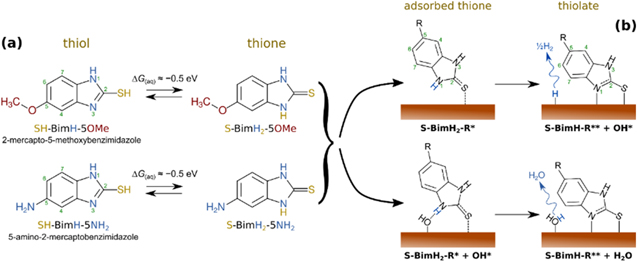
Figure 1. Adsorbed thione and thiolate forms of the two molecules considered herein; thiol forms are not considered due to their inferior stability and propensity to transform to thiolates. 30 Note that here the label SH-BimH-R (R = 5OMe or 5NH2) indicates a thiol tautomer, whereas in the text the labels SH-BimH-5OMe and SH-BimH-5NH2 are used as a generic labels without any specific reference to thiols.
Download figure:
Standard image High-resolution imageOur approach here is based on a thorough overnight formation of the inhibitor film, i.e. a pre-formation before the corrosion test in inhibitor-free 3% NaCl solution. The statistical analysis of force-distance curves obtained by the QI mode in the present work revealed significant differences in the adhesion and stability of the two types of SAMs formed on copper surfaces. Complementary density functional theory (DFT) calculations supported the experimental results and their combination provided a comprehensive picture of how adhesion and film organization affect corrosion inhibition efficiency. The chemical characterization and bonding behavior of the applied inhibitor layer was performed by X-ray photoelectron spectroscopy (XPS). Nanoscale insights were then successfully correlated to macroscopic electrochemical corrosion tests in NaCl solution.
Experimental
Chemicals, Cu substrates and sample preparation
2-mercapto-5-methoxybenzimidazole (SH-BimH-5OMe, 95%) and 5-amino-2-mercaptobenzimidazole (SH-BimH-5NH2, 97%) were obtained from Fluorochem. Absolute ethanol (≥ 99.85%),2-propanol (≥ 99.7%) and sulfuric acid (≥ 95%) were obtained from VWR Prolab Chemicals, sodium chloride (NaCl, 99.7%, Fisher Scientific) was purchased from Sigma Aldrich and Milli-Q water from Arium Pro-VF pore size 0.2 μm (0.057 μS cm−1) (Sartorius Stedim Biotech, France). All chemicals were used without further purification.
Commercial polycrystalline Cu samples (99.99%), with one-side "light chemical-mechanically" polished and sized 10 mm × 10 mm × 1 mm, were purchased from MTI Corporation, USA. Prior to corrosion tests or inhibitor modification, Cu samples were, as received, rinsed with water and ethanol for a few seconds, and then dried under N2 gas (denoted "bare"). To form adsorbed organic layers the samples were then immersed overnight in inhibitor solution. 45 Ethanolic solutions of organic SH-BimH-5OMe and SH-BimH-5NH2 compounds were prepared at a concentration of 1 mM. After the overnight immersion, Cu samples were shortly rinsed with water and pure ethanol, and then dried under N2 gas.
Electrochemical measurements of bare and inhibitor-coated Cu samples were carried out in 3 wt.% aqueous NaCl solution. For immersion test in 3 wt.% NaCl, a 0.5 mm thick Cu foil supplied by Advent Research Materials Ltd. (99.99%) was used. The foil was cut to samples sized 1 cm × 1 cm × 0.5 mm.
Atomic force microscopy characterization
AFM experiments were performed using a JPK NanoWizard 3 (JPK Instruments AG, Berlin, Germany). AC mode or tapping mode imaging in the air was carried out using silicon ACTA-50 tips (AppNano, USA) with quoted cantilever length of 125 μm, resonance frequency 300 kHz, and spring constant of 40 N m−1. The images were scanned on different image sizes using a pixel ratio 256 × 256 with tip line rate of 1 Hz. Contact mode imaging and force spectroscopy measurements were carried out using triangular-shaped antimony (n) doped silicon tip (model: RESP-20, Bruker, Germany, 450 μm, 20 kHz, and 0.9 N m−1), as well as gold coated tips (SHOCONGG-20, AppNano, USA, 225 μm, 8–37 kHz, 0.01–0.6 N m−1). Each probe was cleaned by successive twofold dipping in 95% H2SO4, water and ethanol for 1 min each, and dried with a gentle N2 gas stream. The clean cantilevers were then mounted immediately on the AFM tip holder to perform the measurement. The tip sensitivity is estimated from 10 random approach curves, and its spring constant is determined using the thermal noise method. Typical spring constants obtained for the silicon tips are ∼0.1–0.5 N m−1, while for the gold-coated tips are about 0.03–0.3 N m−1. These sensitivities and spring constant values were obtained by tip−sample force-distance curve profiles during tip calibration. Either clean glass or gold surfaces were used to calibrate the tip, and the closest approach point was set to zero distance between the tip and the sample. The arithmetic mean surface roughness (Sa) of the samples was estimated by analyzing the AFM topographic images. Advanced quantitative imaging (QI) mode was used to get information about the local tip−sample interactions with high spatial resolution since this mode enables a complete control of the tip−sample interaction force at every image pixel. QI measurements provide height, adhesion, baseline and slope image data on each image pixel by constant force and tip speed. The QI measurements were carried out by using a pre-set 2.5 nN force and tip speed of 2 μm s−1 within an array of 256 × 256, i.e. 65536 individual force curves can be obtained from each QI image recorded typically on a 3 μm × 3 μm surface area. Around 60 force curves (extend curves) were selected upon approaching to analyze AFM tip−sample force-distance (F-D) plots statistically. Similarly, around 60 representative force curves were selected upon retraction (retract curves) to evaluate adhesion and identify molecular fishing events on SH-BimH-5NH2 immersed samples. During molecular fishing events individual molecules were picked up by the AFM tip in force-distance measurements visible as a second peak next to the surface adhesion peak. All the AFM measurements were carried out separately in air, in 3 wt.% NaCl solution, and in deionized (DI) water.
X-ray photoelectron spectroscopy
XPS spectra (PHI-5600LS, Physical Electronics, USA) were recorded using monochromatic Al Kα X-rays (1486.6 eV). The photoelectrons were collected at 70° with respect to the surface normal and detected with a hemispherical analyzer. The spot size of the X-ray source on the sample was 1 mm. The analyzer operated with a pass energy of 187 eV for survey spectra and 12 eV for high resolution core levels spectra. Chamber pressure during data acquisition was 10−9 mbar. Survey spectra as well as and high-resolution core levels spectra of C 1s, S 2p, O 1s, N 1s and Cu 2p were recorded. Peak analysis was carried out by CasaXPS software. The position of the XPS peaks was normalized to binding energy of C 1s peak at 284.8 eV.
Corrosion tests
For electrochemical corrosion measurements, bare Cu samples and Cu-samples pre-exposed to 1 mM SH-BimH-5OMe and SH-BimH-5NH2 ethanolic solutions served as working electrodes (bare and inhibitor-modified). Electrochemical measurements were performed in 3 wt.% NaCl, pH = 5.5, at room temperature in a three-electrode cell with Ag/AgCl (3 M KCl) as reference electrode (E = 0.202 V vs standard hydrogen electrode) and either graphite or gold electrodes as counter electrodes. An Autolab potentiostat (PGSTAT128N and PGSTAT302N with NOVA 2.1 software) was used as electrochemical workstation. All potentials in the text refer to the Ag/AgCl scale. Two types of electrochemical techniques were explored: (i) sample was left to stabilize for 1 h at the open circuit potential (Eoc) to attain steady-state conditions. Potentiodynamic polarization curve (PPC) was then recorded starting 0.25 V more negative vs Eoc and progressing in anodic direction at a scan rate of 1 mV s−1. The anodic potential limit was 0.1 V. (ii) Long-term measurements were carried out using linear polarization resistance (LPR) technique 46 which measures the dependence of current density on electrode potential in a close vicinity of Eoc (±10 mV) using a scan rate of 0.1 mV s−1. From the slope of the dj/dE curve a value of polarization resistance (Rp) is then deduced and taken as a measure of resistance to general corrosion. Compared to PPC, LPR technique is much less destructive for the sample surface and thus suitable for long-term evaluation of inhibitor performance. LPR measurements were carried out for 100 h and Rp values were determined every 10 h.
For immersion tests, Cu samples were directly hung in polyethylene containers with 3 wt.% NaCl, and 3 wt.% NaCl with added 1 mM SH-BimH-5OMe or 1 mM SH-BimH-5NH2. The electrolyte volume/sample ratio was larger than 25 ml cm−2. The long-term immersion tests lasted 60 d. After that, the samples were rinsed and photographed. Note that the immersion in inhibitor-containing NaCl solution for the long-term tests differs in sample preparation from the pre-formed inhibitor film mainly studied here.
Computational DFT modeling
DFT calculations were performed using the PBE exchange-correlation functional 47 and the plane-wave pseudo-potential method as implemented in the PWscf code from the Quantum ESPRESSO distribution, 48,49 while molecular graphics were produced by the XCRYSDEN graphical package. 50 Nuclei and core electrons were described by ultrasoft pseudopotentials 51 and Kohn–Sham orbitals were expanded in a plane-wave basis set with a kinetic energy cut-off of 30 Ry (240 Ry for the charge-density cut-off). To better describe lateral intermolecular interactions, we utilized a reparametrized D2 empirical dispersion correction of Grimme, 52 labelled as PBE + D''. 53 The reason for the reparametrization is that the original PBE-D overestimates molecular bonding to metal surfaces. 54,55 In particular, the C6 parameter of Cu and Au was set to 140 Ry/Bohr 6 and 470 Ry/Bohr, 6 respectively (the original values are 375 Ry/Bohr6 and 856 Ry/Bohr6); the so reparametrized C6 parameters reproduce the experimental adsorption energies of benzene on Cu(111) and Au(111). a Copper surfaces were described by two different surface models, one based on bare Cu(111) and the other on hydroxylated Cu2O(111) (Figs. 2a, 2b), where the latter was modeled by the PBE + U + D'' scheme using the simplified version of GGA + U method of Cococcioni and de Gironcoli 56 with U = 7.75 eV for Cu ions. This U value was calculated self-consistently for Cu2O bulk using the hp.x code. 57
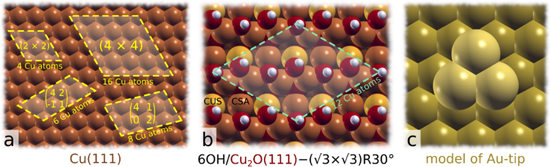
Figure 2. Surface models utilized in DFT calculations. (a) Cu(111) and the supercells used to model inhibitor adsorption from 1/4 to 1/16 ml coverage; the number of surface Cu atoms in each supercell is also indicated. (b) Hydroxylated Cu2O(111) with 6 OH groups per (√3×√3)R30° supercell; 42 molecular coverages of 1/12 ml and 1/6 ml were modeled by adsorbing one or two inhibitor molecules per supercell, respectively. (c) A model of the Au-tip, consisting of a cluster of 3 Au atoms on Au(111).
Download figure:
Standard image High-resolution imageCu(111) and Au(111) surfaces were modeled by periodic slabs consisting of four (111) layers using the calculated Cu and Au bulk lattice parameters of 3.65 and 4.15 Å, respectively (Fig. 2). As Au(111) is a poor model of the gold-coated tip used in AFM, the Au-tip (Fig. 2c) was instead modeled as a cluster of three Au adatoms on Au(111). Brillouin zone (BZ) integrations were performed with a Methfessel–Paxton smearing 59 of 0.03 Ry using uniformly shifted k-meshes compatible with a (12 × 12) k-mesh for the (1 × 1) unit-cell. The hydroxylated Cu2O(111) model, labeled as OH/Cu2O(111), was modeled by the Cu2O(111) slab consisting of four O−Cu−O three-layers with the in-plane lattice spacing set to calculated Cu2O-bulk lattice parameter of 4.39 Å. 42 This model contains 6 OH groups per (√3×√3)R30° supercell (Fig. 2b), which were generated by dissociating 3 H2O molecules at the upper side of the O-terminated Cu2O(111)−(√3×√3)R30° slab, i.e., 3H2O + 3 O* + 3* → 6OH*, where O* and OH* stand for a lattice O ion at the surface and a surface OH group, respectively (for more details about this model, see our previous publication 42 ). The model can be descriptively labeled as 6OH/Cu2O(111)−(√3×√3)R30°. BZ integrations were performed with a shifted 2 × 2 × 1 k-mesh and a Marzari-Vanderbilt cold smearing 60 with the smearing parameter of 0.01 Ry. The bottommost layer of the metal slabs and the bottommost O−Cu−O three-layer of the OH/Cu2O(111) slab were fixed to bulk positions, whereas all other degrees of freedom were relaxed. Inhibitor molecules were adsorbed on the top side of the slab at various surface coverages, ranging from 1/4 to 1/16 monolayer (ML) for Cu(111) and from 1/6 to 1/12 ml for OH/Cu2O(111), where ml is defined as the inverse of the number of surface Cu atoms per adsorbed molecule. Adsorption calculations were performed in the aqueous phase that was described implicitly using the self-consistent continuum solvation model 61 as implemented in the Environ plugin for Quantum ESPRESSO.
Adsorption calculations were performed with respect to a hydrated thione tautomer as a reference, because it is more stable than the thiol one. We considered both non-dissociative (thiones only) and dissociative (thiolates) adsorption modes, as schematically illustrated in Fig. 1b. Adsorption binding energies (Eb) for non-dissociative adsorption mode were calculated according to the reaction:

Where the label S-BimH2-R specifically indicates a molecule in thione form, * and S-BimH2-R* stands for a free adsorption site and an adsorbed thione molecule, respectively, whereas the subscript (aq) represents the aqueous phase (i.e. solvated species).
Adsorption energies (∆Eads) for dissociative adsorption (i.e. thiolate formation) on bare Cu(111) model were calculated according to following reaction:

where S-BimH-R* stands for an adsorbed thiolate and H2(g) for a gas-phase hydrogen molecule. On a hydroxylated Cu2O(111) model, the respective adsorption energies were calculated according to the following reaction:

where OH* stands for a surface hydroxyl and H2O(aq) for a self-hydrated water molecule.
Results and Discussion
Atomic force microscopy characterization
The Cu surfaces were modified by overnight immersion in 1 mM ethanol solution containing either methoxy (–OMe) or amino-terminated (–NH2) mercaptobenzimidazoles. Firstly, the inhibitor-modified Cu surfaces were scanned in non-contact mode AFM in air to evaluate the changes of the surface roughness upon inhibitor modification. The mean roughness values (Sa) of the Cu surface modified with SH-BimH-5OMe and SH-BimH-5NH2 SAM layer are 2.0 ± 0.5 nm and 2.3 ± 0.5 nm, respectively, while the Sa of the bare Cu surface is 0.5 ± 0.2 nm (Fig. 3a). The SH-BimH-5OMe-covered surface thus showed a slightly smaller Sa value than the SH-BimH-5NH2-covered surface, indicating the self-assembled monolayer of SH-BimH-5OMe is more compact and homogenous. Secondly, for each sample, in situ AFM force imaging measurements were carried out using a maximum force of 2.5 nN and tip approach speed of 2 μm s−1.
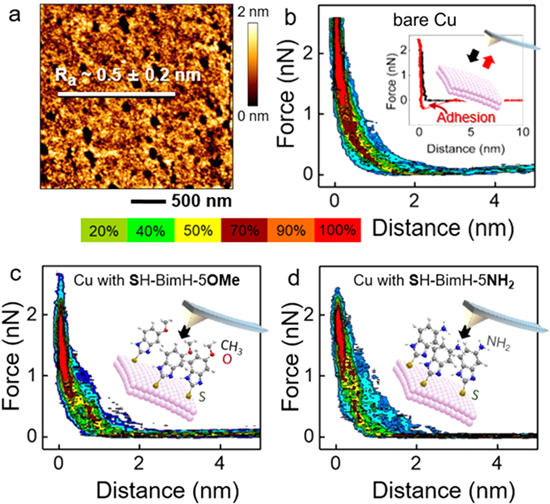
Figure 3. AFM experiments. (a) AFM topography image of bare Cu surface, (b) Statistical heat plots of AFM tip−sample force-distance (F–D) approach curves on bare Cu, inset: Typical F–D approach and retract curves. (c), (d) Statistical heat maps of AFM tip−sample F–D approach curves on Cu covered with SH-BimH-5OMe and SH-BimH-5NH2, respectively (insets: schematics of tip−molecule interactions with different molecules). Color map in the middle is related to the F–D curves.
Download figure:
Standard image High-resolution imageFigures 3b–3d depict so-called heat maps created by plotting a large number of force-distance curves obtained in 3 wt.% NaCl aqueous solution from a bare polycrystalline Cu surface and from Cu surfaces covered by SH-BimH-5OMe and SH-BimH-5NH2, respectively. The plots represent 60 random curves selected among the 256 × 256 approach curves from each set of quantitative imaging measurements. In Fig. 3b, a few jump-in events of the AFM tip to the surface are observed from ∼0.5 nm, visible as a slight smooth shoulder towards larger force-distance values, indicating that the bare Cu surface is homogeneous in accordance with the topography image in Fig. 3a. In addition, force curves showed a similar behavior in experiments using DI water (results not shown), which indicates no major influence of the salt ions in the solution. This reveals that the jump-in events of the tip at around 0.5 nm are due to the presence of hydrated surface layers. The inset of Fig. 3b represents a typical AFM F–D curve with approach (black) and retract force (red) curves of bare Cu. Upon approach, no interaction was observed at large distances (D > 1 nm). Repulsive interactions take over at very small tip−sample distances (D < 0.5 nm) approaching the hard-wall value when the tip contacts the clean Cu surface.
Upon retraction, a large adhesion force is observed as a result of a strong interaction and large adhesion energy between the metallic Cu surface and the Au-coated tip. The nature of the force curves and the observed adhesion behavior changed when the inhibitor film was added to the clean surface. At large distances, there was again no visible tip−sample interaction (Figs. 3c and 3d). Repulsive forces start at a diameter of around 2 nm as the tip starts compressing the SAM layers until a jump-in feature appears or perforation starts, indicating that the tip has penetrated the SAM layer and eventually directly contacted the surface (strong repulsive hard wall interaction). The insets of both plots (Figs. 3c and 3d) illustrate the respective molecular processes during tip−sample interaction. While for SH-BimH-5OMe a layer below 1 nm is visible, the layer for SH-BimH-5NH2 (Fig. 3d) is less defined.
The individual behavior of each event is visible in single approach and retract curves. Figure 4a shows a typical AFM F-D curve taken on a SH-BimH-5OMe-covered Cu surface. As the tip approaches the inhibitor (D < 3 nm), repulsive forces arise and the layer starts to be compressed. At a distance of 2 nm, a starting slow jump-in process can be observed indicating that the tip penetrates the monolayer and reaches the hard wall (Cu surface). Upon tip retraction, a large minimum corresponding to an adhesion force is representing the barrier for the tip to leave the surface. An average adhesion force value of 400 ± 120 pN has been computed by averaging 60 randomly selected curves, corresponding to an adhesion energy of 12.5 eV. About 5% of the curves were discarded due to irregular curve shapes, which could not be interpreted for various reasons including occasional surface contaminations. But, nearly 95% of the recorded force-distance curves show similar tip−sample interactions. Figure 4b represents the most abundant F–D curves observed on SH-BimH-5NH2-covered surfaces. The F-D curve shape is similar to that of surfaces covered with SH-BimH-5OMe, however, an average adhesion force and energy yielded typically smaller values for the amino-terminated as compared to the methoxy-terminated inhibitors, namely 300 ± 90 pN and 3 eV, respectively. The energy required to pull-off the tip from the inhibitor-modified surface was smaller for the SH-BimH-5NH2 covered surface, which could signify a lower ordering of the film. The flat-lying molecules being trapped between the tip and the surface may reduce the Hamaker constant of Cu-Au interaction. 62,63 The difference in adhesion forces may also indicate the different chemical states on the surface such as metallic Cu, SH-BimH-5NH2 covered Cu and Cu oxide layer. About 75% of the F–D curves showed this type of tip−sample interactions on SH-BimH-5NH2 covered surfaces. Interestingly, 20% of the remaining F–D retract curves (Fig. 4c) show additional minima at larger tip−sample distances which account for the molecular fishing events. During molecular fishing, the interaction of the AFM-tip and a molecule is eventually stronger than the intermolecular molecule−molecule and molecule−surface attraction forces and consequently the tip may pull out the inhibitor molecule during retraction. The average molecular fishing force is about 150 ± 50 pN and the energy for a single fishing event is 1.6 eV. This fishing force value is close to the single molecular forces observed on a wide range of molecules, for example, antibiotic-modified tips for measuring the specific binding forces of vancomycin 64 or adhesion force of an individual mannose (or glucose)-rich polysaccharides on LGG bacteria. 65 Up to a quarter of the retract curves show relatively low or invisible adhesion peaks which means a low Hamaker constant between the Au-tip and Cu, indicating that the tip did not reach to the Cu surface but rather picked up weakly bound molecules from the top of the SAM layer. All force measurements were carried out also in DI water (results not shown) to check the ion layering effect of 3 wt.% NaCl and gave a similar amount of fishing curves, confirming that the force measurements are not affected by ion layering. The magnitude of the adhesion energy is overall in line with an Au-tip and a metallic Cu surface in 3 wt.% NaCl.

Figure 4. Selection of typical AFM F–D curves and tip−sample interaction illustrations of (a) SH-BimH-5OMe, (b) SH-BimH-5NH2 and (c) SH-BimH-5NH2 with fishing event on Cu surfaces. (d) Force curve distributions on both inhibitor-covered areas.
Download figure:
Standard image High-resolution imageX-ray photoelectron spectroscopy
XPS characterization was carried out to identify the chemical state of the Cu surfaces and trace in more detail the differences before and after inhibitor modifications. The survey spectra of as-received (non-rinsed) and bare (rinsed with ethanol) Cu samples show the presence of Cu, O and C (Fig. S1 available online at stacks.iop.org/JES/168/051504/mmedia). The Cu samples immersed in 1 mM ethanolic solution of either SH-BimH-5OMe or SH-BimH-5NH2 show in addition the presence of nitrogen and sulfur, as noticed previously for mercapto-based benzimidazole. 40
High-energy resolution spectra reveal differences between species of particular elements (Figs. 5 and S2). Also for samples with an inhibitor film present strong Cu peaks are clearly visible and in turn reveal the ultra-thin nature of the adsorbate layers (a single-molecule-thick SAM layer has a thickness of about 0.6 ± 0.1 nm as deduced from DFT calculations). The Cu 2p spectrum of the bare sample consists of the following three features: a peak at 932.5 eV and a peak at 934.5 eV which scales together with a broad satellite peak at about 944 eV (Fig. 5a). The peak at 932.5 eV can be ascribed to a Cu metal and/or Cu(I) oxide by judging the peak area and peak width. 66–68 It is highly unlikely that without an inhibitor adsorbed Cu would be present in a metallic state so the main peak is related to the presence of Cu(I) oxide. The peak at 934.5 eV is attributed to the presence of Cu(II) species, which is corroborated by the appearance of a rather broad satellite peak at 10 eV above the main peak. 66–68 The presence of Cu(II) species may be here related to the pre-treatment of commercially supplied Cu samples or to the formation during air exposure. Similar spectra have been observed on Cu surfaces after rinsing with ethanol (Figs. 5a and 5b), but the intensity of the Cu peak centered at 932.5 eV is slightly smaller than that of the non-rinsed bare Cu due to the slightly reducing nature of ethanol. 69 However, rinsing with ethanol could not remove the Cu(II) species completely. Carbon C 1s and oxygen O 1s spectra are not significantly affected by rinsing with ethanol (Fig. S2,).
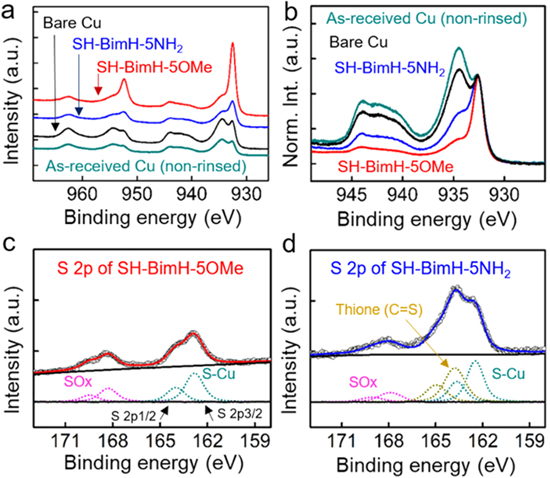
Figure 5. XPS characterization of different Cu surfaces, (a) High-resolution spectra of Cu 2p shifted for clarity. (b) High resolution Cu 2p3/2 spectra normalized to the Cu(I) peak. High-resolution S 2p spectra of (c) SH-BimH-5OMe and (d) SH-BimH-5NH2-covered Cu.
Download figure:
Standard image High-resolution imageThe Cu 2p3/2 spectra clearly changed after immersing the sample in 1 mM ethanolic inhibitor-containing solution. (Figs. 5a and 5b) the Cu(II) peak intensity is considerably reduced with the Cu(II) satellite peak becoming smaller. Overall, the Cu(0)/Cu(I) peak is more intense and sharper for the SH-BimH-5OMe-covered Cu. This can be interpreted by SH-BimH-5OMe preferentially adsorbing on Cu2O or metallic Cu and eventually replacing the Cu(II) oxide layer (Fig. 5a). Accordingly, the intensities of the peak at 934.5 eV and of the satellite peak at 944 eV are reduced as going from Cu exposed to blank ethanol solution, to the SH-BimH-5NH2-covered surface, and finally to the SH-BimH-5OMe-covered Cu surface. Further, the SAM layer of SH-BimH-5NH2 may not be as ordered as that of the SH-BimH-5OMe. Also, some SAM-uncovered areas or sites may remain oxidized or re-oxidized once the sample was taken out from the ethanolic solution, and the effect of the remaining, non-replaced surface oxide on the homogeneity of the SAMs is not addressed in more detail here. A deeper surface-science type study with full control of the initial surfaces would be beneficial but is not in the scope of this study. Yet, in any case, SH-BimH-5OMe appears much more efficient for replacing the Cu(II) oxide than SH-BimH-5NH2,with the peak intensity at 934.5 eV being much smaller as compared to the bare samples.
Moreover, sulfur 2p spectra provide important information for a comprehensive understanding of the chemical composition and environment of the inhibitor SAM. Sulfur S 2p spectra of SH-BimH-5OMe and SH-BimH-5NH2-covered Cu surfaces are presented in Figs. 5c and 5d. The S 2p spectrum consists of a 2p3/2 and 2p1/2 doublet which is often considered as singlet in the literature due to a small chemical shift of 1.18 eV between the two peaks (we use the doublet). The spectrum for SH-BimH-OMe shows a peak with a shoulder reflecting the doublet centred at 163.1 eV, which is ascribed to S−Cu bonding. 42 This indicates that most of the sulfur of SH-BimH-5OMe molecules was bonded to Cu in a thiolate form, 70 making a SAM layer with a negligible amount of detectable weakly bound molecules. 71 In the case of SH-BimH-5NH2 covered Cu, two peaks appear at 162.5 eV and 163.5 eV. The latter can be assigned to molecules that are adsorbed to the surface via S−Cu bonding, whereas for the former, the S atom seems not to be involved in the molecule−surface bond 44 (we will argue below in the DFT section that the unbound S species likely corresponds to the SH-BimH-5NH2 molecules bonded to the surface via the amino NH2 group). Another possibility is that the 162.5 eV peak corresponds to molecules physisorbed on top of the SAM monolayer. The peak at ca. 168 eV ("SOx") is probably related to a contamination as it was also detected for the used inhibitor product solutions on pure SiO2 surfaces pointing to an existing (minor) contamination of the used commercial product or some formed thiosulfonate. 57 A more comprehensive XPS study, required to investigate the surface composition in more details, is beyond the scope of the present study.
Corrosion tests
Typical corrosion tests add inhibitors to the corrosive solution while here we mainly chose a complementary way of pre-adsorbing inhibitors in pure ethanol. Potentiodynamic polarization curves (PPCs) and long-term linear polarization resistance (LPR) measurements show differences in inhibition performance (defined above) of layers formed on Cu in SH-BimH-5OMe and SH-BimH-5NH2 solutions. PPCs recorded for bare Cu and Cu samples modified by inhibitors are presented in Fig. 6a. Cu was freshly mechanically polished down to #2000 grit and is shown for comparison in Fig. S3, but showed no marked difference from the bare Cu sample shown in Fig. 5a. The corrosion potential (Ecorr) of bare Cu samples is located at −0.19 V. The cathodic parts of the curves are related to reduction process, which is, in air-exposed near-neutral chloride solution, mainly the reduction of dissolved oxygen. A partial reduction of surface oxide layer can take place, as indicated by a small hump at ca. −0.27 V. At potentials more anodic than Ecorr, the current density increased with potential within the Tafel region but then, at ca. −0.16 V, a narrow passive range is established with the current density being nearly independent on the applied potential. At the breakdown potential (Ebreak) at ca. −0.1 V, the current density increased again due to breakdown of the oxide layer and formation of soluble chloride complexes. 3 It is noteworthy that the commercial Cu samples, covered by a Cu(II) oxide layer, are more resistant to chloride attack than freshly ground Cu in other works. The latter samples are subject to dissolution with the current density increasing exponentially with potential up to ca. 0.2 V (SCE). 40,42

Figure 6. Electrochemical characterization of bare and inhibited Cu samples. (a) Potentiodynamic polarization curves of bare (solid black line), SH-BimH-5OMe-covered (solid red line), and SH-BimH-5NH2-covered (solid blue line) Cu after 1 h of immersion in 3 wt.% NaCl. (b) Rp values as a function of immersion time during 100 h of immersion in 3 wt.% NaCl. (c) Optical microscopy images of Cu samples immersed for 60 d in 3 wt.% NaCl with and without (blank) added 1 mM SH-BimH-5OMe and SH-BimH-5NH2.
Download figure:
Standard image High-resolution imageFor SH-BimH-5NH2-covered Cu, the Ecorr was nearly identical to that of a bare Cu surface. Both cathodic and anodic curves are very similar to bare Cu, indicating that SH-BimH-5NH2 has almost no inhibiting effect. In contrast, for the SH-BimH-5OMe covered surface, the polarization curve displays a remarkably different behavior. Ecorr was shifted in the positive direction up to 0.12 V, in line with predominantly anodic control of the inhibition reaction. This is corroborated by a strong decrease of anodic current density by over three orders of magnitude. The cathodic current density was also reduced compared to that for bare and SH-BimH-5NH2-covered Cu. Therefore, SH-BimH-5OMe acts as a mixed inhibitor with a predominant effect on the anodic reaction, i.e. inhibition of the dissolution of copper via cuprous chloride complexes. 72
Longer-term LPR measurements giving the dependence of polarization resistance (Rp), a parameter reflecting the resistance to general corrosion, as a function of time over 100 h are presented in Fig. 6b. The Rp values of SH-BimH-5NH2 covered surfaces are only marginally larger than those of bare Cu surfaces at ca. 2–3 kΩ cm2, indicating that SH-BimH-5NH2 is not an efficient inhibitor. Values were relatively stable in the course of 100 h. However, for the SH-BimH-5OMe covered Cu surface Rp values were consistently larger compared to the other two samples. Upon the immersion, Rp for SH-BimH-5OMe was 30 kΩ cm2, i.e., 10 times larger than that of Cu and SH-BimH-NH2. In the course of 100 h immersion the Rp is gradually reduced to 15 kΩ cm2 but it is still ca. three to five times larger compared to the other two samples. These results confirm that SH-BimH-5OMe is superior to SH-BimH-5NH2 in terms of short-term PPC measurements in a broad potential region and longer-term LPR measurements in a close vicinity of Eoc.
Immersion tests were carried out to substantiate the electrochemical results. The samples were immersed in inhibitor-containing solution similar to more typical corrosion tests to compare with our general approach of pre-formation of the inhibitor films. Samples were immersed to 3 wt.% NaCl with and without 1 mM of SH-BimH-5OMe and 1 mM of SH-BimH-5NH2 (Fig. 6c). Both blank- and SH-BimH-5NH2-immersed Cu samples show a corroded surface covered with red and green products typical for chloride containing compounds. In contrast, the sample immersed in NaCl with added SH-BimH-5OMe is not corroded under the same conditions.
Computational DFT modeling
Molecular fishing relies on a complex interplay of film adhesion, bonding, both to substrate and tip, and geometrical or steric constraints. To this end, density functional theory (DFT) based modeling can provide important insights. While polycrystalline Cu samples were used for the experiments, the Cu(111) and hydroxylated Cu2O(111) slabs (Fig. 1) were chosen in calculations as representative models to simulate the stability of the two inhibitor molecules on a copper substrate. Mercaptobenzimidazole-type molecules can exist, in principle, in two tautomer forms in aqueous solution, thiol and thione (Fig. 1a), but the latter is almost exclusively present. 30,41 Furthermore, DFT calculations suggest that the most stable adsorbed state is a thiolate, 30,37,42 with an H atom abstracted from the molecule, which binds to the surface via S−Cu and N−Cu bonds (Fig. 1b). For these two reasons only thiones (non-dissociative adsorption) and thiolates (dissociative adsorption) were considered in modeling and the respective adsorption modes on the two surface models are schematically shown in Fig. 1b.
Let us first consider the non-dissociative thione adsorption modes. Figure 7 shows the most stable identified molecular adsorption structures along with the respective adsorption binding energies (at low surface coverage) on the two models of Cu surface and on the Au-tip. In addition to the S-bonding, the bonding via the second end-group is also considered, i.e., via amino group for S-BimH2−5NH2 and via methoxy group for S-BimH2−5OMe. The following observations are relevant: (i) the molecules bind the strongest to Au-tip, followed by Cu(111), whereas the bonding to OH/Cu2O(111) is the weakest. This would suggest that Au-tip has some probability to "fish" the adsorbed thione molecule. (ii) The S-BimH2−5NH2 molecule can bind with either S or the NH2 group to Cu surfaces and the Au-tip (on a given surface model the two binding energies are within about 0.1 eV). This implies that S-BimH2−5NH2 has two reactive groups on the opposite side of the molecule and regardless of which one is attached to the surface the other points outward and is available for bonding with the Au-tip during the AFM measurements. In contrast, (iii) S-BimH2−5OMe adsorbs preferentially via S−Cu bond, because the bonding via the methoxy group is considerably inferior. (iv) On a given substrate, the S-bonding mode is of similar stability for the two molecules (S-BimH2−5OMe binds marginally stronger than S-BimH2−5NH2 to the Au-tip and vice-versa on the Cu surface models). (v) In addition to the S−Cu bond or the N−Cu bond (bonding via amino group) the molecules also form a few hydrogen bonds with the surface hydroxyl groups on OH/Cu2O(111). An interesting observation that stems from configurational search of the adsorbed molecular structures on OH/Cu2O(111) is that thione molecules are prone to dissociate via the N−H bond cleavage during the relaxation. In particular, such bond cleavage happens for several trial structures and results in the formation of thiolate and adsorbed water molecule, i.e., S-BimH2-R* + OH* → S-BimH-R* + H2O* with the energy gain of about 0.2 eV with respect to intact adsorbed thione molecule. This is consistent with the observations from our previous studies that surface hydroxyls facilitate N−H bond cleavage 28,35,42 and that the most stable adsorbed state of mercaptobenzimidazole on copper is a thiolate. 30,42 For this reason we now turn our attention to thiolate adsorption modes. The corresponding results obtained on Cu(111) are shown in Fig. 8, whereas Fig. S4 shows analogous results for the OH/Cu2O(111) model.

Figure 7. The most stable identified thione adsorption modes of mercaptobenzimidazoles containing amino (S-BimH2−5NH2, left) and methoxy (S-BimH2−5OMe, right) groups on Au-tip [top row], Cu(111) [middle row], and hydroxylated Cu2O(111) [bottom row]. Bonding via both functional groups is considered, i.e., via either S or the second end-group (amino for S-BimH2−5NH2 and methoxy for S-BimH2−5OMe). Calculated low coverage adsorption binding energies (Eb) are also given. Note that S-BimH2−5NH2 can adsorb via either S or the NH2 group (the stability of the two modes is within about 0.1 eV), whereas S-BimH2−5OMe can adsorb only via S-bonding, because the bonding via methoxy group is considerably weaker.
Download figure:
Standard image High-resolution image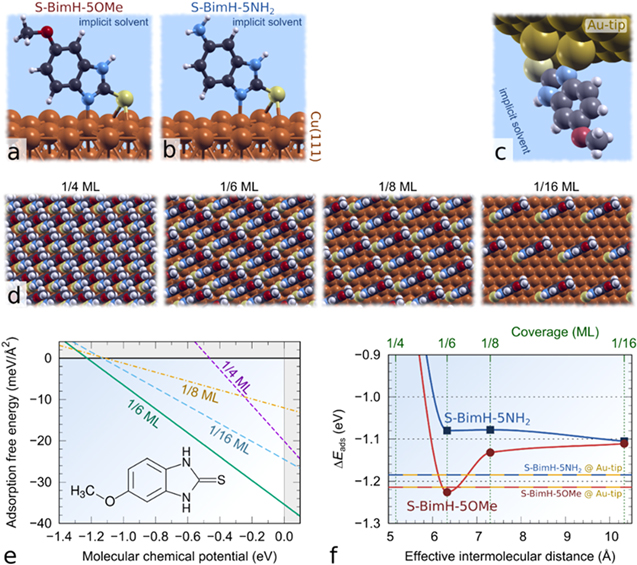
Figure 8. DFT results for thiolate adsorption mode and respective molecular film stability on Cu(111); the corresponding results for OH/Cu2O(111) model are presented in Fig. S4. Identified thiolate adsorption structure of (a) S-BimH-5OMe and (b) S-BimH-5NH2 on Cu(111) and (c) S-BimH-5OMe attached to Au-tip. (d) Ordered adsorbate films with different molecular densities, ranging from high 1/4 ml to low 1/16 ml coverage. (e) Adsorption phase diagram for S-BimH-5OMe. (f) Adsorption energy of S-BimH-OMe and S-BimH-NH2 on Cu(111) as a function of lateral intermolecular distance (points and curves), compared to that on Au-tip (horizontal lines).
Download figure:
Standard image High-resolution imageThe atomistic models of the identified thiolate adsorption structure of S-BimH-5OMe and S-BimH-5NH2 (these two labels omit the H from the -SH group to indicate the thiolates) on Cu(111) are shown in Figs. 8a and 8b, whereas Fig. 8c shows S-BimH-5OMe bonded to the Au-tip that was modeled as a cluster of three Au adatoms on Au(111). The stability of the inhibitor film or equally of an individual molecule inside the film depends on the bonding to the substrate as well as lateral intermolecular interactions (while neglecting possible defect configurations). To this end, we considered different molecular coverages on Cu(111), ranging from high 1/4 monolayer (ml) down to low 1/16 ML coverage, where ml is defined as the inverse of the number of surface Cu atoms per molecule. Figure 8d shows the respective molecular overlayers. The lowest considered surface coverage of 1/16 ML can be taken as an approximation for the adsorbed state without lateral intermolecular interactions. A thermodynamic analysis reveals that for the S-BimH-5OMe the most stable identified molecular configuration displays the coverage of 1/6 ml, as evident from Fig. 8e, which shows the adsorption free energy of S-BimH-5OMe as a function of molecular chemical potential. Figure 8f compares the adsorption energy as a function of lateral intermolecular distance (i.e. effective nearest neighbor distance between the adsorbed molecules b ); it is worth noting that in this case the adsorption energy (∆Eads) does not reflect the molecule−surface bond strength but instead corresponds to adsorption reaction (2) that involves bond-making and bond-breaking, i.e. S-BimH2-R(aq) + *(aq) → S-BimH-R*(aq) + ½H2(g). By taking bond-breaking and bond-making into account, the relation between adsorption reaction energy and molecule−surface binding energy is given by Eb = ∆Eads − DN−H + ½DH−H ≈ ∆Eads—1.7 eV, where DN−H and DH−H are the N−H and H−H bond strengths, respectively. This implies that for thiolates the molecule−surface bond strength is about 3 eV (this bond is by about 1.7 eV stronger than the thione−surface bond). Figure 8f reveals three important facts: (i) The lateral interactions are attractive for S-BimH-5OMe up to the point where Pauli repulsion sets in (notice the stabilization as going from the low 1/16 ml to the most stable 1/6 ml coverage) and slightly repulsive for S-BimH-5NH2. Because of these attractive interactions (ii) the S-BimH-5OMe SAM at 1/6 ml is by about 0.15 eV more stable than the SAM of S-BimH-5NH2 and consequently, (iii) S-BimH-5OMe shows similar adsorption bonding on Cu(111) and Au-tip, whereas S-BimH-5NH2 binds stronger to Au-tip than to Cu(111). Also on OH/Cu2O(111) S-BimH-5OMe adsorbs slightly stronger than S-BimH-5NH2 and its lateral interaction are slightly less repulsive than for S-BimH-5NH2 (Fig. S4f).
Discussion
Experimental evidence and DFT calculations both reveal that the SH-BimH-5OMe molecular layer on Cu is more homogeneous and stable than that of SH-BimH-5NH2 (here the two labels are used generically without specific reference to a particular molecular form). In particular, DFT calculations reveal that in the thione form the molecule containing the OMe group adsorbs via the S−Cu bond, whereas the NH2-analogue can adsorb either via S or via the NH2 group. Furthermore, for the more stable and strongly bonded thiolate adsorption mode the calculations reveal that lateral dipolar interactions are more attractive for the OMe-terminated molecule than for the NH2-terminated one. For these reasons, the molecular assemblies are more homogeneous and better ordered for the former than for the latter. A larger amount of molecular fishing events is only observed on SH-BimH-5NH2-covered surfaces in line with its dual binding nature (via S or via NH2) and, consequently, less ordered structure of the adsorbed film. Thiolates form considerably stronger molecule−surface bonds than thiones, hence it is reasonable to assume that an Au-tip most likely picks molecules in thione form. The fishing of the amino molecules can be attributed to the fact that one of the two reactive groups is always available for bonding with the Au-tip, regardless of which one is attached to the copper surface in combination with the fact that the film is more disordered. Electrochemical corrosion tests reveal that only the OMe-terminated molecule is a good corrosion inhibitor for copper, whereas the NH2-terminated compound forms a less stable layer on Cu as indicated by the XPS evidence. DFT calculations suggest that the inhomogeneity of the SAM formed by SH-BimH-5NH2 may be related to the bonding behavior of the two different end-groups, which both can bind sufficiently strong to Cu surfaces. Furthermore, the NH2 group can be protonated in aqueous solution and this would enhance the tendency of the molecule to stay solvated in the aqueous phase, because charged molecules solvate considerably stronger than neutral molecules. Potentiodynamic polarization curves confirm that the SH-BimH-5OMe inhibitor layer acts as a barrier and suppresses the dissolution of the underlying substrate. This molecule tends to facilitate a reduction of the surface oxide layer on the Cu surface, thus promoting the formation of a more homogeneous layer. DFT calculations indeed suggest that molecular adsorption is slightly more exothermic on a metallic Cu than on Cu(I) oxide. Conversely, SH-BimH-5NH2 shows a much poorer inhibition efficiency, less oxide layer reduction, and allows for molecular fishing events. The complex interplay of inhibitor molecules and substrates, and the precise role of surface oxides has just started to be addressed. 73–76
Conclusions
Cu surfaces exposed to two different organic inhibitor compounds, SH-BimH-5OMe and SH-BimH-5NH2, were characterized by AFM imaging and in situ force spectroscopy, electrochemical corrosion tests, and XPS. In addition, DFT modeling was utilized to scrutinize the molecular bonding to an Au-tip and Cu surfaces as well as to illuminate lateral intermolecular interactions. The importance of control and characterization of the initial surface state is highlighted. The mean surface roughness in the presence of SH-BimH-5OMe is increased from 0.5 nm to about 2.0 nm and for SH-BimH-5NH2 to about 2.3 nm. The force-distance curves recorded during the approach on molecular-covered surfaces indicate the formation of thin molecular layers, i.e., monolayers for SH-BimH-5OMe and a less homogeneous layer for SH-BimH-5NH2. The two molecules show retract curves of different types. For SH-BiMH-5NH2, fishing events are frequently occurring with about 20% of total events, with a force magnitude representative of intermolecular attractions rather than a surface bond strength. For SH-BimH-5OMe molecules, no molecular fishing events are observed, which indicates a relatively compact SAM in line with the efficient corrosion protection. With aid of DFT modeling, the fishing of the SH-BimH-5NH2 molecules and the less homogeneous structure of SH-BimH-5NH2 adsorbed layers can be attributed to dual binding ability of SH-BimH-5NH2, i.e., the molecule can bind to Cu surfaces and Au-tips via either S or NH2 groups. In contrast, SH-BimH-5OMe adsorbs only with the S group oriented to the surface. Corrosion potentials are more positive and the polarization resistance is significantly larger for SH-BimH-5OMe covered surfaces compared to SH-BimH-5NH2-and bare Cu surfaces. Further, the intermolecular forces are more attractive for SH-BimH-5OMe and the inhibitor molecular layers are accordingly more compact and stable. This molecular compactness of the inhibitor SAM layers is therefore regarded as a key indicator or descriptor for the ability of a compound to protect the surfaces from corrosion.
Acknowledgments
This work is a part of the M.Era-Net project entitled "CoinDesc: Corrosion inhibition and dealloying descriptors." The financial support of the project by FWO (Fonds Wetenschappelijk Onderzoek), MESS (Ministry of Education, Science and Sport of Republic of Slovenia, grant no. C3330-17-500074), NWO (Nederlandse Organisatie voor Wetenschappelijk Onderzoek, grant no. 732.016.014), and MINECO (Ministry of Economy and Competitiveness, grants PCIN-2016-027 and FIS2014-54734-P) is acknowledged. Financial support by FWO Odysseus program under the G0D0115N project is acknowledged.
Footnotes
- a
Experimental physisorption energies of benzene on Cu(111) and Au(111) were estimated from experimental TPD (temperature programmed desorption) data with Redhead equation by using the TPD peak temperatures of 225 and 239 K. 58
- b
Effective nearest neighbor distance (deff) is defined as
 where Amol is the surface area per molecule. This definition stems from the equation for the surface area per molecule of the perfect hexagonal layer, which is given by where d is the intermolecular nearest neighbor distance.

