
Abstract
Increasing the Ni content of a Ni-rich layered positive electrode material is one common way to improve energy density of Li-ion cells but normally leads to shorter cell lifetimes. Single crystalline materials have been shown to improve the cell lifetime by reducing the degree of material degradation. This first study in a two part series investigates the synthesis of Co-free single crystalline LiNi0.95Al0.05O2 and LiNi0.975Mg0.025O2 via a two-step lithiation method. This method consists of a first step heating of the precursors at high temperatures but with deficient Li to grow crystalline particles and then a second step at lower temperature to fully lithiate the material. The synthesized materials were characterized by scanning electron microscopy and X-ray diffraction to understand the impact of synthesis conditions. Single crystal materials were successfully synthesized, and Mg-containing single crystal materials achieved micron-sized particles with as low as 2% Ni in the Li layer. Al-containing single crystal materials could not avoid the formation of Li5AlO4 impurity for all conditions tested. The presence of Li or Mg and high temperatures were identified as factors that promote crystallite growth. Selected samples were characterized electrochemically and compared to their polycrystalline counterparts. Mg-containing single crystal materials are not yet competitive with their polycrystalline counterparts yet, and further understanding and development is needed.
Export citation and abstract BibTeX RIS

This is an open access article distributed under the terms of the Creative Commons Attribution 4.0 License (CC BY, http://creativecommons.org/licenses/by/4.0/), which permits unrestricted reuse of the work in any medium, provided the original work is properly cited.
As lithium ion battery technology expands into demanding applications such as electric vehicles, where higher energy density is desired, attention continues to shift away from Co-containing materials. The cost and sourcing issues of Co 1,2 are driving the market towards Ni-rich positive electrode materials, namely LiNi1-x–yMnxCoyO2 (NMC) and LiNi1-x-yCoxAlyO2 (NCA). 3–17 Research has been continually pushing to increase the Ni content and lower the Co content, invariably pushing both NMC and NCA to converge towards LiNiO2 (LNO).
LNO was actually under consideration, along with LiCoO2 (LCO), as the positive electrode for the first Li-ion cells. While LCO was ultimately used, LNO is still not yet commercialized due to a myriad of issues. LNO undergoes phase transitions as Li gets removed during charging and as Li gets inserted during discharging. 7,18–20 In particular, the material experiences a large volume change when it transitions from the H2 phase to the H3 phase at low Li content. This volume change is believed to contribute to the poor lifetime of the material. Additionally, the poor thermal stability of LNO is a huge concern. 10,12,16,21,22 Another issue is the sensitivity of the Li content. If the stoichiometry is Li deficient, Ni exists in both the +2 and +3 oxidation states to balance the charge. Some of the Ni2+ will migrate to the Li layer due to Ni2+ being a similar size as Li+, 23 and this is undesirable since Li diffusion, reversible capacity and rate capability are all negatively impacted. 5,6,16,17,20,24–26 On the other hand, excess Li during sintering will result in residual Li compounds that remain on the surface as impurities. These surface impurities have been shown to reduce the capacity, rate capability and capacity retention of materials. 11,13,20,26–30 Regardless of the stoichiometry, it is believed that the presence of Ni2+ in the material cannot be avoided and LNO will always have some amount of Ni in the Li layers. 5,16,18,20,24,25,31,32 Likewise, some amount of residual Li compounds will form from reactions of the surface with the ambient atmosphere due to the reactivity of LNO with water and CO2 in the air. 11,16,27–30,33
One popular approach to mitigating issues with LNO has been to substitute some portion of the Ni with other metals, resulting in the development and commercialization of NCA and NMC. Many different metals have been studied as substitutions for Ni. 5–8,12–14,16,34–36 Al and Mg are two low cost substitutes that have been found to benefit the material at relatively low amounts. Al substitution has been shown to stabilize impedance growth as well as improve the cycling performance and the thermal stability. 5,12,16,17,37,38 Mg can reduce Ni migration into the Li layer, stabilize impedance growth, improve cycling performance and improve thermal stability. 6,12,14,17,31,32,36,38–41 The use of Al and Mg dopants comes with some minor drawbacks. With electrochemically inactive substituents, the specific capacity of the material is reduced. Mg and Al generally exist in the material with an oxidation state of +2 and +3, respectively, so the same fraction of Mg reduces the capacity of the material more than Al due to the formation of a Ni4+ for charge balance. 12,14 The inclusion of Al complicates the synthesis of hydroxide precursors by disrupting particle growth 42–47 and forming a layered double hydroxide (LDH) phase to balance the Al3+. 44–48 For the most part, issues with Al have been addressed to some extent from advances in synthesis and processing procedures.
Reports summarizing the impact of compositional changes of Ni-rich materials have similar messages: as the Ni content of the material increases, the capacity increases but at the cost of cycling performance. 6,7,9,13,15–17 Recent work found that the unit cell volume change can be related to the cycling performance and the study proposed that a main failure mode for Ni-rich materials stem from the anisotropic volume change compromising particle integrity. 13 The unit cell contraction of the Ni-rich electrode was found to be a universal behavior that is dependent on the degree of delithiation, regardless of chemical composition, and this was summed up as "an unavoidable challenge". The benefits of metal substitution to the cycling performance are mainly due to reducing the capacity (degree of delithiation) of the material and thus reducing the volume change, and the choice of substitute may not be significant. 13,49 Since the volume change causes anisotropic stresses and strains on polycrystalline materials, single crystalline materials may be able to preserve particle integrity by undergoing isotropic volume change within a particle.
Single crystalline (SC) NMC have been synthesized and studied previously. 50–69 When compared against polycrystalline (PC) counterparts, SC materials have been consistently found to improve the cycling performance, 6,8,53,55,56,58,65,67,69–73 improve performance at high temperature 55,58,67,69,71,73 and high voltage, 6,55,73 reduce parasitic side reactions between positive electrode and electrolyte, 50,56,67,72 reduce the degree of microcracking 6,8,53,55,56,58,67,69,71,74 and improve the thermal stability of the material. 6,8,55,70,71 Most recently, SC materials have been shown to be more tolerant to air exposure compared to PC materials. Li-ion cells with SC materials can have further improved cycling performance when appropriate electrolyte additives are used. 62,64,72,73,75 However, SC materials are not perfect and are reported to have less specific capacity than their PC counterparts. 6,53,55,56,62,64,67,73
The majority of studies on SC materials have been on NMC grades with less Ni but increasing amounts of work on NMCs with 80% Ni or higher have been reported recently. 52,53,55,56,58,63,65–67 The Ni content in SC material studies lags behind those of materials in metal substitution studies, 12–14,34–36 likely due to difficulties in synthesis. Grain growth of particles is promoted by increasing the temperature, increasing the Li/TM ratio or by adding a fluxing agent, but a washing step is often required to remove the excess Li or fluxing agent. 6,53,54,61–63,69,76 With Ni-rich materials, their sensitivity to moisture suggests that a washing step will deteriorate the performance and should be avoided. 6,11,13,20,26–30,62 Additionally, NCA materials have been reported to form Li5AlO4 at high temperatures and with excess Li, 26,64 so a two-step lithiation method was introduced to synthesize SC NCA. 64 This method consists of a first step that heats the precursors to high temperatures but a deficient amount of Li to grow particles and a second step at lower temperature to fully lithiate the material. Well grown single crystal NCA particles without Li5AlO4 impurity were made using this method. 64
Eliminating Co from the material is another challenge that research has focused on. The inclusion of Co in the material has been shown to ease the synthesis and benefit the performance of the material by reducing the cation disorder, maintaining or reducing the irreversible capacity and increasing the rate capability. 12,38,77,78 However, the use of Co comes with economic and ethical challenges, which include higher prices, price volatility, supply chain instability and reports of child labour. 1,2,79 The costs that come with using Co have generally been justified by the benefits Co imparts, but recent advances in synthesis and materials have demonstrated that Co may not be necessary for Ni-rich materials to perform adequately. 12,36,78,80
Improved energy density and reduced costs of positive electrode materials can be achieved by increasing the Ni content of the positive electrode material but at a trade-off of shorter cell lifetimes. Single crystalline materials have been shown to improve the cell lifetime by reducing the degree of material degradation. There have been many studies of Co-free Ni-rich materials 12–14,22,34–36,57,78,80–83 but no work on the synthesis and electrochemical characterization of Co-free Ni-rich single crystalline materials have been reported as far as the authors are aware. This study investigates the synthesis of single crystalline LiNi0.95Al0.05O2 and LiNi0.975Mg0.025O2 via the two-step lithiation method. The two compositions were chosen based on benefits to thermal stability compared to LNO, with the dopant content selected to have a similar theoretical capacity. 12,14 The synthesized materials were characterized by scanning electron microscopy (SEM) and X-ray diffraction (XRD) to understand the impact of synthesis conditions. Selected SC materials were characterized electrochemically and compared to their PC counterparts.
Experimental
Synthesis
Samples were synthesized using metal hydroxide precursors obtained from Hunan Zoomwe Zhengyuan Advanced Material Trade Co., Ltd (Zoomwe). There were 3 precursors used in this work. Ni0.95Al0.05(OH)2 (Al-doped materials will be denoted as NiAl) and Ni0.975Mg0.025(OH)2 (Mg-doped materials will be denoted as NiMg) precursors used to make single crystalline (SC) samples had similar sizes (D50 ∼3 μm) while the NiMg precursor used to make the polycrystalline (PC) comparator was larger (D50 ∼ 18 μm), in line with previous work on this composition. 13,14 The total mass of the materials in each synthesis batch was 2.5 g before heating.
The two-step lithiation procedure to produce SC materials has been detailed in previous work. 56,64 In the first step, the precursor materials were mixed with LiOH•H2O (FMC Corporation, > 99.8%) in a lithium/transition metal molar ratio of < 1 (a Li/TM ratio of 0 would be just the precursor). The mixtures were ground together by mortar and pestle until homogenous. Samples were first preheated in a furnace for 3 h at 480 °C before a second round of grinding. The samples were then heated in the furnace for 2 h at 480 °C then at a higher temperature (850 °C, 900 °C or 950 °C) for 5 h. In the second step, additional LiOH•H2O was added to reach an overall Li/TM ratio (1.02, 1.05 or 1.15) and ground together until homogenous. A preheat step (480 °C for 3 h) was included only for samples with significant amounts of added lithium (first step Li/TM ratio < 0.9). Samples were heated in the furnace at 480 °C for 2 h then at 700 °C or 750 °C for 12 or 20 h. All heating steps used a heating rate of 10 °C min−1. Samples with an expected Li/TM ratio of 0.9 or higher were heated in a tube furnace (4.4 cm diameter) with an oxygen flow of 60 sccm to promote the oxidation of Ni to the +3 state. Heated samples were ground once more before characterization.
The PC comparator lithiation procedure has also been detailed before. 12–14,26 The NiMg precursor (D50 ∼ 18 μm) was mixed with LiOH•H2O in a Li/TM ratio of 1.02 and ground until homogenous. Samples were preheated in a tube furnace for 3 h at 480 °C, ground again and then heated for 2 h at 480 °C then at 700 °C for 20 h with the same heating rate and atmosphere as described above.
Scanning electron microscopy (SEM) imaging
SEM imaging was conducted using a NanoScience Phenom Pro G2 Desktop Scanning Electron Microscope with a back-scattered electron detector or a Hitachi S-4700 with a secondary electron detector depending on equipment availability. Samples imaged by the Phenom Pro SEM were prepared by mounting the powders onto adhesive carbon tape while samples imaged by the Hitachi SEM were prepared by adhering the powders onto a drop of conductive graphite paint.
X-ray diffraction (XRD)
XRD patterns of samples were collected with a Bruker D8 diffractometer equipped with a Cu target X-ray tube and a diffracted beam monochromator. Samples were measured in the scattering angle (2θ) range of 15°–70° for 3 s at intervals of 0.02°. Rietveld refinements were performed on XRD patterns of synthesized samples showing a layered structure. Materials were refined based on a hexagonal α-NaFeO2 structure with the R-3m space group. 18–20,26 Li was assumed to occupy 3a sites (lithium layer) while the 3b sites (metal layer) contained Ni, Co, Al and Mg and 6c sites contained oxygen. The exchange of Ni and Li between 3a and 3b sites was allowed with the constraint of maintaining the stoichiometry of the material.
Coin cells
SC materials selected for electrochemical characterization underwent separation of the particle aggregates before electrode making and coin cell assembly. The materials were placed in a jar along with 20 hardened stainless steel balls (3 mm diameter, ∼3:1 ball:material ratio) and mixed in a planetary mixer (Mazerustar) for 100 s. The jar was then taken out and given a shake to reduce caking before mixing again, for a total of 3 × 100 s. A more detailed study of separation methods and its impacts is included in part II. 84
Positive electrodes for electrochemical testing were prepared as described elsewhere. 85 A mixture was formed by combining the active material, Super-S carbon black (Timcal) and polyvinylidene fluoride (PVDF, Arkema, Kynar 301F) in a ratio of 92:4:4 by weight. An appropriate amount of N-methyl-2-pyrrolidone (NMP, Sigma-Aldrich, 99.5%) was added to form a slurry and mixed in a planetary mixer for 300 s. This slurry was then coated onto Al foil using a 150 μm notch bar and dried in an oven at 110 °C. Dried electrodes were calendared at a pressure of ∼2000 atm, punched into discs (1.2 cm diameter, electrode material loading of 9–12 mg cm−2) and dried in vacuum overnight at 110 °C. 2325-type coin cells were then assembled using a positive electrode, two pieces of Celgard 2320 separator (Celgard) and a Li metal negative electrode using 1.0 M LiPF6 (BASF, 99.9%) in a fluoroethylene carbonate (FEC, BASF) and dimethyl carbonate (DMC, BASF) mixture (FEC:DMC 1:4 v/v) as the electrolyte. Electrochemical testing was performed on coin cells using an E-One Moli Energy Canada battery testing system. Cells were cycled between 3.0–4.3 V (vs Li/Li+) at 30 °C. Cells were cycled 2 times using a current density of 10 mA g−1 (∼C/20), cycled 50 times using a current density of 40 mA g−1 (∼C/5) then finally cycled 2 times more using a current density of 10 mA g−1.
Results and Discussions
Figure 1 shows the SEM images of NiAl and NiMg samples after the first step. The Li/TM ratios of these samples were either 0 (mixed with no Li, denoted as 0Li) or 0.5 (half the lithium needed to fully lithiate, denoted as 0.5Li) and samples were heated to either 850 °C, 900 °C or 950 °C for 5 h in air.
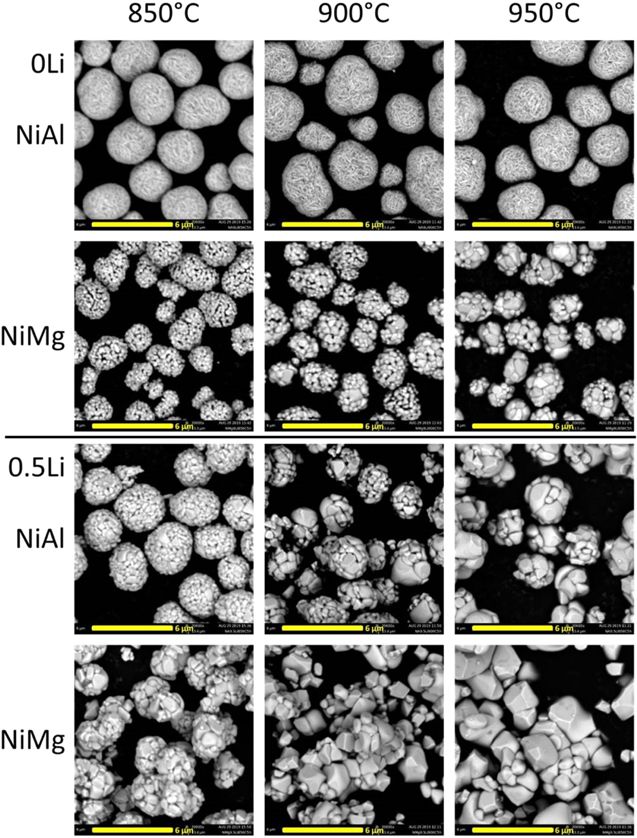
Figure 1. SEM images of samples after heating Ni0.95Al0.05(OH)2 (NiAl) or Ni0.975Mg0.025(OH)2 (NiMg) at various temperatures for 5 h with no Li (0Li) or with half the amount of Li needed to fully lithiate (0.5Li).
Download figure:
Standard image High-resolution imageAll NiAl 0Li samples have similar morphology and there were no observable changes when changing the first step heating temperature. Conversely, the NiMg 0Li samples do not have similar morphologies. As the first step heating temperature increases, primary particle size increases, indicating that grain growth is occurring as temperature increases. This suggests that 2.5% Mg is enough to promote grain growth when heating to 850 °C and higher, while 5% Al does not promote grain growth at the same temperatures. Comparing the 0.5Li samples to their 0Li counterparts show that all samples with 0.5Li have more grain growth. Unlike NiAl 0Li samples, NiAl 0.5Li samples heated to a higher temperature had larger particles. NiMg samples with 0.5Li showed even larger particles than the 0Li counterparts. Both Mg and Li are able to promote grain growth, and this growth accelerates as the heating temperature increases. Previous works have reported the importance of Li 51–57,62,63,69 and higher temperatures 50–54,56,57,59,62–64,66–69 on single crystal growth and Fig. 1 corroborates with the literature.
Figure 2 shows the XRD patterns of the NiAl and NiMg samples after the first step, along with an expanded view between 42.75°–44.5°. The dominant phase in all these samples are the rocksalt phase, a NiO derivative containing the Al or Mg dopant for 0Li samples and a partially lithiated form for 0.5Li samples. Some amount of ordering of the Li and Ni into Li-rich and Ni-rich layers can be observed in the 0.5Li samples, with the peaks in the 18°–20° range being the signature. 86
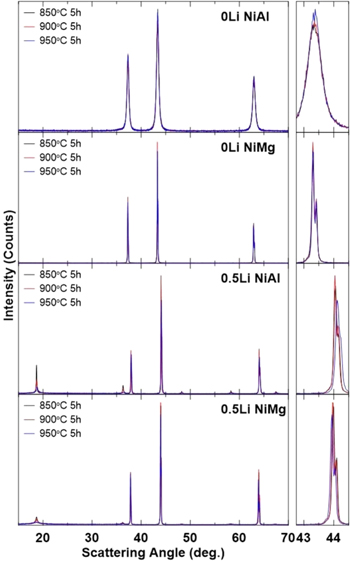
Figure 2. XRD patterns (Cu Kα radiation) of samples after heating Ni0.95Al0.05(OH)2 (NiAl) or Ni0.975Mg0.025(OH)2 (NiMg) at various temperatures for 5 h with no Li source (0Li) or with half the amount of Li needed to fully lithiate (0.5Li). XRD patterns were collected from 15°–70°.
Download figure:
Standard image High-resolution imageBoth NiAl and NiMg 0Li samples exhibit only the rocksalt phase with the expected composition being Ni1-xMxO (x = 0.05 for M = Al and x = 0.025 for M = Mg). The NiAl samples have much broader Bragg peaks than the corresponding NiMg samples. This is due to a lack of grain growth in NiAl samples, and the small grain sizes contribute to peak broadening as described by the Scherrer equation. 87 The NiAl 0Li series of samples are the only samples with broad peaks in Fig. 2. This corroborates with Fig. 1 which shows that the NiAl 0Li samples are the only samples that do not undergo grain growth.
The NiAl and NiMg 0.5Li samples show a few differences compared to their 0Li counterparts. One difference is that the reflections are slightly shifted to the right. This can be seen more clearly in the expanded view. This suggests that the unit cells of 0.5Li samples are slightly smaller than the 0Li samples, due to the presence of Li atoms in the structure. The incorporation of Li+ will increase the population of Ni3+, which has a smaller ionic radius than Ni2+. 23 The other difference between the 0.5Li samples and the 0Li samples is the presence of alternating Ni-rich layers and Li-rich layers leading to peaks that are not seen in the rock-salt phase. 86 However, as the heating temperature of the first step increases, the peaks associated with this ordering shrink. This may be due to an increase in the amount of Li lost as the temperature increases 26,51,59,62,63,66–69 leading to less lithium being incorporated into the material which decreases the amount of layer-type ordering.
Figures 1 and 2 indicate that both Li and Mg promote grain growth while Al does not promote growth. When Li and/or Mg are present, an increase in temperature will accelerate grain growth. While it is known that Li and high temperatures promote grain growth, the ability for Mg to promote growth has not been reported as far as the authors are aware, and Mg is able to do so at only 2.5%. It seems that the factors that promote growth are factors that facilitate diffusion of ions within the material. Higher temperatures provide more thermal energy for diffusion, but thermal energy is by itself not enough to promote growth in this study as evidenced by the NiAl 0Li series. The inclusion of an ion that can diffuse easily in the material seems to also be required, and Li+ and/or Mg2+ fill that role. While it is known that Li+ diffuses in these materials (otherwise the lithiation procedure would fail), there are fewer reports on Mg2+ diffusion. Two studies that the authors are aware of both show 88 or suggest 82 that Mg is a better diffuser than Al, corroborating with this work. The individual impact of each factor (Li content, Mg content and heating temperature) on grain growth is not probed in this work but the grain sizes of the NiMg 0Li sample heated at 950 °C for 5 h seem to be qualitatively similar to the grain sizes of the NiMg 0.5Li sample heated at 850 °C for 5 h and both seem to be just slightly smaller than the NiAl 0.5Li sample heated at 900 °C for 5 h.
Figure 3 shows the SEM images of NiAl and NiMg samples from Figs. 1 and 2 after the second step. The samples were all heated to 700 °C for 20 h in oxygen, with the addition of enough Li to attain an overall Li/TM ratio of 1.05 for 0Li samples and 1.15 for 0.5Li samples to account for the Li loss seen in Fig. 2. Samples in this Figure are labelled according to their first step conditions. The SEM imaging of the NiAl 0.5Li second step samples was performed using the Hitachi SEM due to equipment availability.
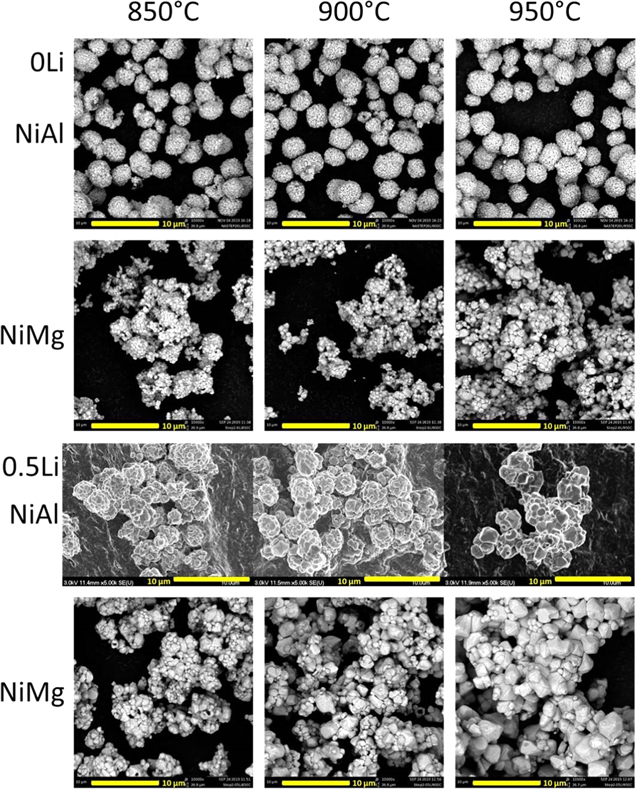
Figure 3. SEM images of NiAl and NiMg samples after the second heating step at 700 °C for 20 h. Samples are labelled by their first step temperature and Li amount, with 0Li samples being lithiated to a final Li/TM ratio of 1.05 and 0.5Li samples being lithiated to a final Li/TM ratio of 1.15.
Download figure:
Standard image High-resolution imageThe morphology of the samples after second step (Fig. 3) follows the same trends as after the first step (Fig. 1). The NiAl 0Li series of samples have a similar morphology after the second step, just like the first step. This is not surprising since there was no grain growth observed in the first step, the second step would be similar to the synthesis procedure for PC materials. The NiAl 0Li particles look similar to other PC samples made from Zoomwe precursors. 13,14,26 The other series of samples produced particles with increasing grain size as the first step heating temperature increased and there was no significant growth seen in between step 1 and step 2. Once again, this is not surprising as the second step heating only reached a temperature of 700 °C, which is the temperature used to make PC materials. All synthesized materials produced secondary particles containing primary particles, regardless of primary particle size. The materials with larger primary particles seem more like particle aggregates that can be separated to single crystal particles and a detailed study of separation methods and their impacts is presented in part II. 84
Figure 4 shows the XRD patterns of NiAl and NiMg samples from Figs. 1 and 2 after the second step, along with an expanded view of the (003) reflection, the (104) reflection and the Li impurity region. The dominant phase in all these samples is the layered phase. The NiAl 0Li series of samples were the only series that did not have any impurities. The other series of samples have a rocksalt impurity phase, seen more clearly in the expanded view of the (104) reflection, and the NiAl 0.5Li samples have an observable amount of Li5AlO4 (JCPDS #00–027–1209). The formation of the Li5AlO4 impurity is undesired because it draws away Li and Al from the material, causing the electrode material to be more Li and Al deficient than targeted.
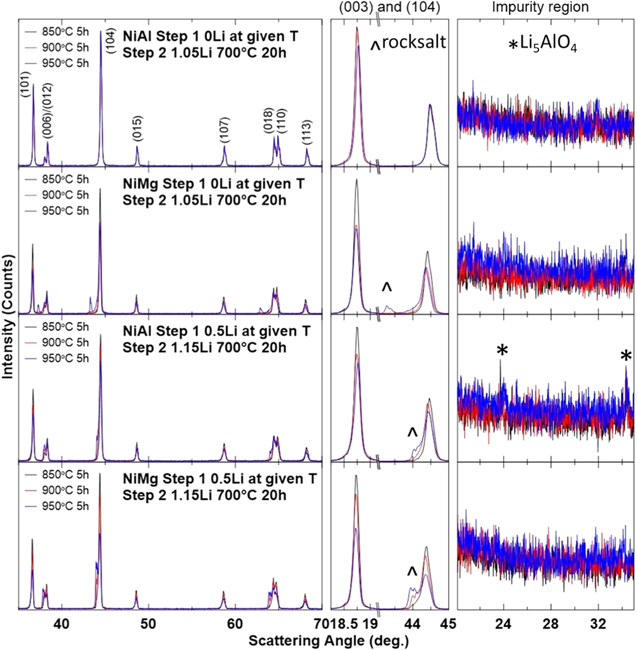
Figure 4. XRD patterns (Cu Kα radiation) of NiAl and NiMg samples after the second heating step at 700 °C for 20 h were collected from 15°–70° and expanded views of the (003) reflection, the (104) reflection and the Li impurity region are included.
Download figure:
Standard image High-resolution imageThe rocksalt impurity phase, as seen in the expanded view of the (104) reflection, is observed in the NiMg 0Li series and the NiAl and NiMg 0.5Li series and is more noticeable at higher first step temperatures. This is likely connected with the degree of grain growth observed in Fig. 1. If the Li cannot fully diffuse through the particle and reach the core, there will be portions of the material that remain in the rocksalt structure. The amount of material that the Li cannot reach would increase with larger grain sizes and this is observed in Fig. 4. The different scattering angles at which the rocksalt phase is observed for the NiMg 0Li samples and NiAl and NiMg 0.5Li samples further support that the rocksalt phase is due to material that did not incorporate further lithium in the second step and not the formation of a new impurity. The formation of a new impurity would be expected to form a phase that has a consistent pattern between all the samples, whereas materials with the same lithium content as after the first step would have reflections at the same scattering angle as observed in Fig. 2 and that is the case.
The presence of the Li5AlO4 impurity phase in some, but not all, of the NiAl samples suggests that formation occurred during the first step. The observation of the Li5AlO4 impurity phase in the NiAl 0.5Li samples is not surprising in the context of the synthesis conditions needed to form single crystal materials. Previous reports on the synthesis of Al-containing Ni-rich materials have observed this impurity phase. 26,64 These reports have shown that Li5AlO4 formation occurs with higher temperatures and higher Li/TM ratios. While the NiAl 0.5Li synthesis temperature of 850 °C is within the reported range of Li5AlO4 formation (> 800 °C), the Li/TM ratio of 0.5 is well below the reported range of Li5AlO4 formation (> 0.8–0.9Li). It is uncertain why Li5AlO4 formation occurred at such a low Li/TM ratio for these materials. Perhaps the composition plays a role in facilitating Li5AlO4 formation since the materials in this work are higher in Ni content (95% Ni, 5% Al) compared to the reported works (92% Ni and 3% Al, 90% Ni and 5% Al, 88% Ni and 3% Al). 26,64
Figure 5 shows the Rietveld refinement results as a function of the first step heating temperature for the XRD patterns in Fig. 4. The left panels (Figs. 5a, 5b) show the a and c lattice parameters obtained from the refinements, while the right panels (Figs. 5c, 5d) show the calculated unit cell volume and the percentage of Ni in the Li layer.
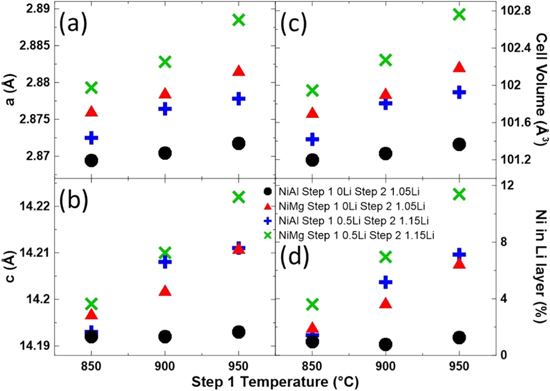
Figure 5. Unit cell lattice constants (a, b), the calculated unit cell volume (c) and amount of Ni in the Li layers (d) as a function of the first step heating temperature for NiAl and NiMg samples after the second heating step at 700 °C for 20 h.
Download figure:
Standard image High-resolution imageThe unit cell volume (Fig. 5c) increases as the first step heating temperature increases for all sample series. However, the NiAl 0Li series shows a smaller increase than the other sample series. A similar trend can be seen for the Ni content in the Li layer (Fig. 5d), where samples in a series would have more Ni in the Li layer as the first step temperature increases except for the NiAl 0Li series, which hovered around 1% Ni in the Li layer. The divergence of behaviours between the NiAl 0Li series and the other series may be due to increased diffusivity, by inclusion of Li+, Mg2+ and increasing the heating temperature, in the other series. The increased unit cell volume with increasing synthesis temperature has been reported previously 11 and the authors have associated the cell volume increase with cation migration in that study. This work reinforces that correlation and suggests that Ni content in the Li layer is a larger factor than synthesis temperature to the increase in cell volume, since the NiAl 0Li samples remain relatively stable in the Ni content in the Li layer and the cell volume is only slightly increased as the synthesis temperature increased.
Figures 1 to 5 showed that the Li content, the Mg content and first step heating temperature are all factors in promoting grain growth. However, some of these factors have drawbacks if relied on heavily to grow particles. Higher temperatures would increase the Ni content in the Li layer as well as increase Li loss 26,51,59,62,63,66–69 (Figs. 2 and 5) and increasing the Mg content would lower the capacity of the material, 12,14 so increasing the Li/TM ratio of the first step was investigated. The additional benefit of increasing the first step Li/TM ratio is that it should avoid the presence of rocksalt impurities, which stem from unlithiated material (Fig. 4) as there is enough Li to create a well layered phase in the first step. 64,86
Figure 6 shows the SEM images of NiMg samples after the first step and after the second step. Unfortunately, SEM imaging was not available when NiAl samples were synthesized. However, based on a SEM comparison of NiAl samples and NiMg samples shown later, it is expected that the morphology of NiAl samples be similar to NiMg samples. The samples were all heated to 850 °C for 5 h in oxygen in the first step, with a Li/TM ratio of 0.9Li, 0.95Li or 0.975Li. The samples were all heated to 700 °C for 12 h in oxygen in the second step, with the addition of enough Li to attain an overall Li/TM ratio of 1.02. Samples in this figure are labelled according to their first step Li/TM ratios.
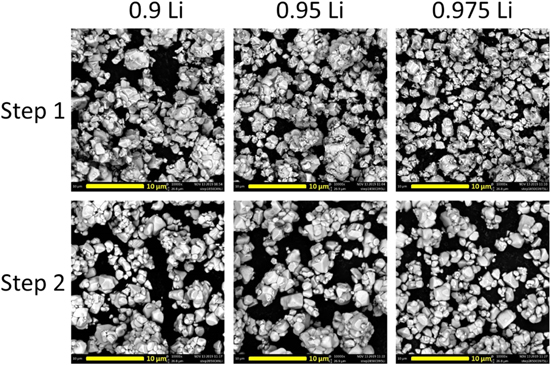
Figure 6. SEM images of NiMg samples after the first heating step at 850 °C for 5 h and after the second heating step at 700 °C for 12 h. Samples are labelled by their first step Li amount, samples are lithiated to a final Li/TM ratio of 1.02 for the second heating step.
Download figure:
Standard image High-resolution imageThe samples look well grown after the first step, with particle sizes slightly larger than the NiMg 0.5Li sample heated to 850 °C and slightly smaller than the sample heated to 900 °C. There does not seem to be significant morphological differences between the 3 Li/TM ratios at the scale shown in Fig. 6. Similar to Fig. 3, there was no significant growth seen between step 1 and step 2 due to the lower second step heating temperature, which is the temperature used to make PC materials. Once again, the particles seem like particle aggregates that can be separated to single crystal particles.
Figure 7 shows the XRD patterns of NiAl and NiMg samples after the first step and after the second step, along with an expanded view of the (003) reflection, the (104) reflection and the Li impurity region. The samples were heated to 850 °C for 5 h in oxygen in the first step, with a Li/TM ratio of 0.9Li, 0.95Li or 0.975Li, and heated to 700 °C for 12 h in oxygen in the second step, with the addition of enough Li to attain an overall Li/TM ratio of 1.02. The dominant phase in all these samples is the layered phase even after the first step. No samples have a rocksalt impurity phase but the NiAl samples still have an observable amount of Li5AlO4. In fact, the peaks are even more pronounced, which is not too surprising as the first step now has more Li at 850 °C.
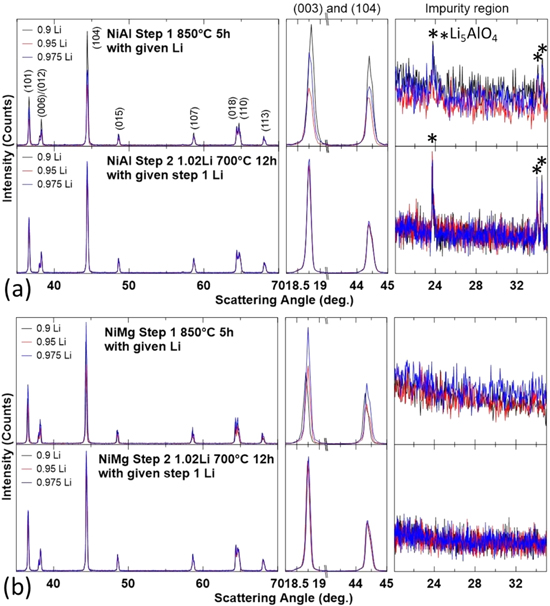
Figure 7. XRD patterns (Cu Kα radiation) of NiAl (a) and NiMg (b) samples after the first heating step at 850 °C for 5 h and second heating step at 700 °C for 12 h. Samples are labelled by their first step Li amount, samples are lithiated to a final Li/TM ratio of 1.02 for the second heating step. XRD patterns were collected from 15°–70° and expanded views of the (003) reflection, the (104) reflection and the Li impurity region are included.
Download figure:
Standard image High-resolution imageFigure 8 shows the Rietveld refinement results as a function of the first step Li/TM ratio for the XRD patterns in Fig. 7. The left panels (Figs. 8a1–8a4) show the refinement results for NiAl samples and the right panels (Figs. 8b1–8b4) show the results for NiMg samples. From top to bottom, the panels show the a (Figs. 8a1–8b1) and c (Figs. 8a2–8b2) lattice parameters obtained from the refinements, the calculated unit cell volume (Figs. 8a3–8b3) and the percentage of Ni in the Li layer (Figs. 8a4–8b4).
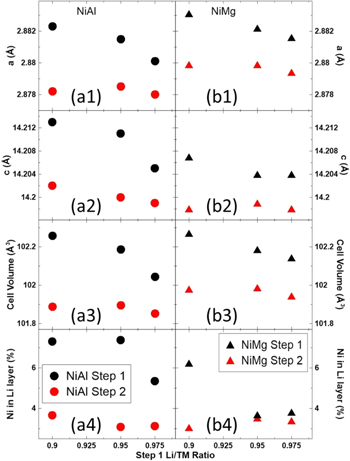
Figure 8. Unit cell lattice constants (a1-b1, a2-b2), the calculated unit cell volume (a3-b3) and amount of Ni in the Li layers (a4-b4) as a function of the first step Li amount for NiAl (a) and NiMg (b) samples after the first heating step at 850 °C for 5 h and second heating step at 700 °C for 12 h.
Download figure:
Standard image High-resolution imageFor almost all the samples, the second step resulted in a sample with a smaller unit cell and less Ni in the Li layer. The only exceptions are the NiMg 0.95Li and 0.975Li samples retaining a similar Ni in Li layer content after the second step. A previous study on the synthesis conditions of NCA has shown that as the Li content in the material approaches 1, both the c lattice parameter and the Ni content in the Li layer will decrease. 26 This supports the results seen in Fig. 8, as the first step is more Li deficient and the second step has a Li content closer to 1.
Figures 6 to 8 showed that having a higher Li/TM ratio in the first step (between 0.9–0.975Li) and heating to 850 °C for 5 h is a viable approach to making well grown single crystalline materials that avoids rocksalt impurities. However, the final materials all hovered around 3% Ni in the Li layer (Fig. 8) while Fig. 5 showed that 2% Ni in the Li layer may be attainable. In an effort to lower the Ni content in the Li layer of the final material, a slightly higher temperature was used in the second step.
Figure 9 shows the SEM images of NiAl and NiMg samples after the second step. The samples were all heated to 850 °C for 5 h in oxygen in the first step, with a Li/TM ratio of 0.95Li or 0.975Li, and then heated to 750 °C for 12 h in oxygen in the second step, with the addition of enough Li to attain an overall Li/TM ratio of 1.02. Samples in this figure are labelled according to their first step Li/TM ratios. The SEM images in Figs. 6 and 9 were imaged using different SEMs so comparison is not straightforward, but the particles seem to be qualitatively similar in particle size and morphology. This is not too surprising as the first step is the growth step and the conditions are the same for that step. At these Li/TM ratios for the first step, the 2.5% Mg does not seem to have a significant impact on grain growth, as the particles for the NiMg samples are similar in size as NiAl samples.
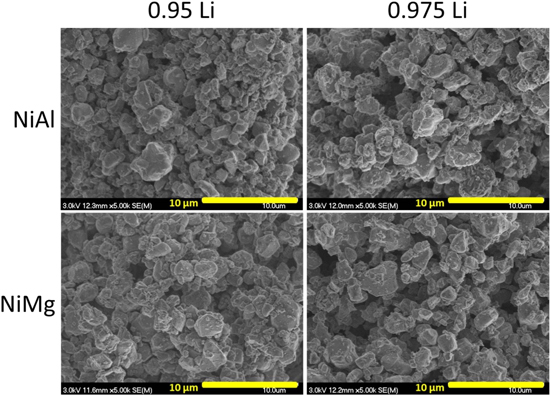
Figure 9. SEM images of NiAl and NiMg samples after the heating steps at 850 °C for 5 h and then at 750 °C for 12 h. Samples are labelled by their first step Li amount, samples are lithiated to a final Li/TM ratio of 1.02 for the second heating step.
Download figure:
Standard image High-resolution imageFigure 10 shows the XRD patterns of NiAl and NiMg samples after the first step and after the second step, along with an expanded view of the (003) reflection, the (104) reflection and the Li impurity region. The samples were heated to 850 °C for 5 h in oxygen in the first step, with a Li/TM ratio of 0.95Li or 0.975Li, then heated to 750 °C for 12 h in oxygen in the second step, with the addition of enough Li to attain an overall Li/TM ratio of 1.02. Similar to Fig. 7, the dominant phase in all these samples are the layered phase. No samples have a rocksalt impurity phase but the NiAl samples still have an observable amount of Li5AlO4.
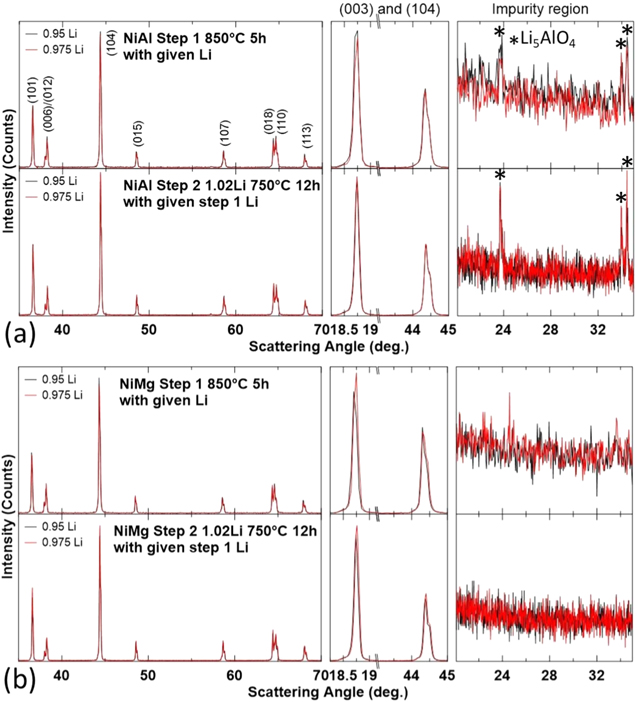
Figure 10. XRD patterns (Cu Kα radiation) of NiAl (a) and NiMg (b) samples after the first heating step at 850 °C for 5 h and second heating step at 750 °C for 12 h. Samples are labelled by their first step Li amount, samples are lithiated to a final Li/TM ratio of 1.02 for the second heating step. XRD patterns were collected from 15°–70° and expanded views of the (003) reflection, the (104) reflection and the Li impurity region are included.
Download figure:
Standard image High-resolution imageFigure 11 shows the Rietveld refinement results as a function of the first step Li/TM ratio for the XRD patterns in Fig. 10. The left panels (Figs. 11a1–11a4) show the refinement results for NiAl samples and the right panels (Figs. 11b1–11b4) show the results for NiMg samples. From top to bottom, the panels show the a (Figs. 11a1–11b1) and c (Figs. 11a2–11b2) lattice parameters obtained from the refinements, the calculated unit cell volume (Figs. 11a3–11b3) and the amount of Ni in the Li layer (Figs. 11a4–11b4). The refinement results of Fig. 10 (second step at 750 °C) are shown as filled circles and triangles while refinement results of Fig. 7 (second step at 700 °C, shown in Fig. 8) are shown as empty circles and triangles.
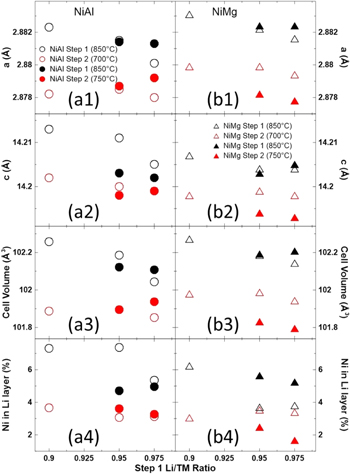
Figure 11. Unit cell lattice constants (a1–b1, a2–b2), the calculated unit cell volume (a3–b3) and amount of Ni in the Li layers (a4–b4) as a function of the first step Li amount for NiAl (a) and NiMg (b) samples after the first heating step at 850 °C for 5 h and second heating step at 750 °C for 12 h along with the results in Fig. 8 (second step at 750 °C). The refinement results of Fig. 10 (second step at 750 °C) are shown as filled circles and triangles while refinement results of Fig. 7 (second step at 700 °C, shown in Fig. 8) are shown as empty circles and triangles.
Download figure:
Standard image High-resolution imageSimilar to Fig. 8, the second step produced samples that have a smaller unit cell and less Ni in the Li layer. For the most part, the samples after the first step have a similar unit cell volume but slightly different Ni content in the Li layer. Heating the second step at 750 °C did not have an impact on NiAl samples compared to heating at 700 °C. On the other hand, NiMg samples heated to 750 °C for the second step had a reduced Ni content in the Li layer (∼2%) compared to heating at 700 °C (∼3%). It is uncertain why the NiMg samples had less Ni in the Li layer when heated to 750 °C compared to 700 °C but the NiAl samples did not see such a reduction. Perhaps the formation of the Li5AlO4 impurity left the sample slightly Li deficient. Since using a second step heating temperature of 750 °C resulted in a reduction of the Ni content in the Li layer for NiMg samples and no observable detriment, these NiAl and NiMg samples were selected for electrochemical testing after separation of the particle aggregates. 84
Figure 12 shows the voltage (vs Li/Li+) versus specific capacity (V vs Q, Fig. 12a), the differential capacity versus voltage (dQ/dV vs V, Fig. 12b) and the 1st cycle capacity data (Figs. 12c1–3) for the NiAl and NiMg samples synthesized with a first step temperature of 850 °C then a second step temperature of 750 °C. Samples in this Figure are labelled (Figs. 12a–12b) or plotted (Figs. 12c1–3) according to their first step Li/TM ratios. Solid and dashed lines represent two duplicate cells for Figs. 12a–12b.

Figure 12. Cell voltage as a function of capacity (a) and differential capacity as a function of cell voltage (b) for the NiAl and NiMg samples after the second heating step at 750 °C for 12 h. First cycle capacities as a function of the first step Li amount (c1–c3) for the NiAl and NiMg samples.
Download figure:
Standard image High-resolution imageFigure 12a shows that NiAl cells have a slightly lower 1st charge capacity and that NiMg 0.975Li cells have a slightly higher irreversible capacity, but otherwise the voltage curves look similar. However, dQ/dV vs V curves (Fig. 12b) show that NiAl cells have less capacity at high voltage compared to NiMg cells, resulting in smaller features around 4.2 V (vs Li/Li+). The NiAl features occur at a slightly higher voltage than NiMg. The NiMg 0.975Li cells also seem to have more polarization than the other cells. Considering the 1st cycle capacities (Figs. 12c1–3), the NiMg cells have more capacity than NiAl cells but have more irreversible capacity.
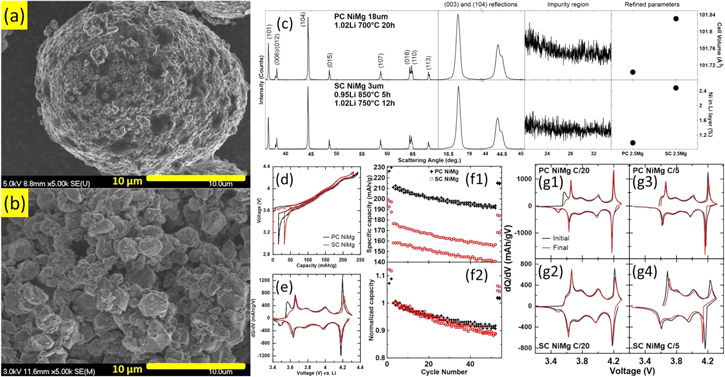
Figure 13 compares a selected SC NiMg material (NiMg 0.95Li from Figs. 9 to 11) with a PC NiMg material of the same composition (97.5% Ni, 2.5% Mg). Fig. 13a shows the SEM image of the PC NiMg material and Fig. 13b shows the SEM image of the SC NiMg material. Fig. 13c shows the XRD patterns of PC and SC NiMg materials, along with expanded views of the (003) reflection, the (104) reflection and the Li impurity region, the calculated unit cell volume and the percentage of Ni in the Li layer. The V (vs Li/Li+) vs Q curves (Fig. 13d) and the dQ/dV vs V curves (Fig. 13e) of the initial cycles, the cycling performance (Figs. 13f1–2) and the dQ/dV vs V curves for the initial and final C/20 and C/5 cycles (Figs. 13g1–4) are also shown. Solid and dashed lines represent two duplicate cells for Figs. 13d–13e. Data for duplicate cells are also shown for Figs. 13f1–2 but not for Figs. 13g1–4 for clarity.
Figure 13. Comparison of a polycrystalline (PC) NiMg sample with a single crystalline (SC) NiMg sample synthesized from differently sized precursor particles (d50 ∼ 18μm and ∼3μm, respectively). SEM images of (a) the PC NiMg sample and (b) the SC NiMg sample. XRD patterns (Cu Kα radiation) of the samples (c) were collected from 15°–70° and expanded views of the (003) reflection, the (104) reflection and the Li impurity region, calculated unit cell volume and amount of Ni in the Li layers are included. Cell voltage as a function of capacity (d) and differential capacity as a function of cell voltage (e) for the samples. Specific capacity (f1) and normalized capacity (f2) as a function of cycle number for the samples. Differential capacity as a function of cell voltage before and after (g1-g2) or at the beginning and at the end (g3-g4) of the 50 C/5 cycles for the samples.
Download figure:
Standard image High-resolution image
The SEM image of the PC NiMg material (Fig. 13a) shows that the synthesized product maintains its secondary particle size with small primary particles, in contrast to the SC NiMg material (Fig. 13b) which grows its primary particles to the point where the secondary particle is no longer intact. Comparing the XRD patterns of PC and SC NiMg materials (Fig. 13c) show similar patterns and no observable Li impurities for either material. The Rietveld refinement results show the SC material has a larger unit cell volume and more Ni content in the Li layer as expected from heating the material to a higher temperature (Fig. 5). 11
Comparison of the electrochemical data of the initial cycles shows a significant difference between the capacity of PC and SC NiMg materials. SC NiMg materials have a smaller capacity and a larger irreversible capacity (Fig. 13d) than PC NiMg materials. Other studies on SC Ni-rich materials have also reported less capacity compared to their PC counterparts. 6,53,55,56,62,64,67,73 This loss in capacity in SC NiMg materials can be pinpointed to two regions in the dQ/dV vs V curves (Fig. 13e). SC NiMg materials lose virtually all capacity around the ∼3.5 V region and have smaller features around the 4.2 V region compared to PC NiMg materials. A similar occurrence was reported for SC NCA 88/9/3 but to a lesser degree, perhaps due to a lower Ni content. 64 Although no dQ/dV vs V curves were reported, voltage curves in several other works on SC Ni-rich electrodes (80%–91% Ni) seem to corroborate this occurrence. 53,55,66 Both of these voltage regions have been associated with kinetic hindrances of Li diffusion in the material. 5,89 A more in-depth investigation in the reduction of capacity in SC NiMg materials is included in part II. 84
The cycling performances of the NiMg materials (Figs. 13f1–2) indicate that SC NiMg materials do not have any benefits over PC NiMg materials in this study. The PC NiMg cells outperform the SC NiMg materials when considering both specific capacity (Fig. 13f1) and normalized capacity (Fig. 13f2). This is unexpected since SC materials have generally been reported to experience less capacity fade than PC materials. 6,8,53,55,56,58,65,67,69,71–73 Examination of the dQ/dV vs V curves at various cycles (Figs. 13g1–4) suggests that the PC and SC NiMg cells degraded in different ways. The dQ/dV vs V curves for the initial and final C/20 cycles of PC NiMg cells (Fig. 13g1) show the loss of capacity in the ∼3.5 V region whereas the dQ/dV vs V curves for the initial and final C/20 cycles of SC NiMg cells (Fig. 13g2) remain quite stable in terms of the features in the curves. A loss of capacity in the ∼3.5 V region in the dQ/dV vs V curves suggests that the main mode of degradation for PC NiMg cells is related to structural change, specifically in the low V kinetic hindrance region. It is hard to pinpoint what the structural change is without further testing, but possibilities include the increase of Ni content in the Li layer hindering Li diffusion or reaction heterogeneity leading to the filling of the electrode particle surface earlier, reducing the amount of Li that can be intercalated back into the particle. 58 The dQ/dV vs V curves for the initial and final C/20 cycles of SC NiMg cells show relatively minimal changes, suggesting the structure of the SC material is more stable. Instead, the main mode of degradation for SC NiMg cells seem to be a large increase in the polarization of the cell as evidenced by the dQ/dV vs V curves for the initial and final C/5 cycles (Fig. 13g4). The cause of this polarization growth is uncertain and work is being carried out to try and understand this degradation mechanism.
While SC NiAl and NiMg materials have been successfully synthesized in this study, more work is needed to improve these materials. The formation of Li5AlO4 impurities for all SC NiAl synthesis conditions tested in this study suggests that the synthesis of SC ultrahigh Ni materials containing Al will lead to a material that is more Li and Al deficient than targeted. SC NiMg synthesis did not experience issues with impurity formation once sufficient lithium was included in the first step, but the SC NiMg materials as synthesized and characterized in this study are not yet competitive when compared to its PC counterpart. These SC NiMg cells have lower capacity, higher irreversible capacity and increased cycling fade than PC NiMg cells. The lower capacity and higher irreversible capacity of SC NiMg cells stems from kinetic hindrances to Li diffusion impacted negatively by larger path lengths for solid state diffusion while the increased cycling fade stems from an increase in cell polarization. More work is needed to understand and address these issues.
The two-step lithiation method was introduced to try and avoid the formation of Li5AlO4 in NiAl materials but this work has shown that Li5AlO4 formation occurred for all tested synthesis conditions for this composition. NiMg did not experience the formation of impurities and is not expected to even for a one-step lithiation process. As such, part II focuses on the synthesis of SC NiMg using a simpler one-step lithiation process. The separation of particle aggregates and the low capacity of the synthesized SC NiMg materials will also be studied in more detail.
Conclusions
This work studied the synthesis of Co-free single crystalline NiAl (95% Ni, 5% Al) and NiMg (97.5% Ni and 2.5% Mg) materials using a two-step lithiation method. The presence of Li or Mg is required for grain growth and higher temperatures enhance grain growth as well. Grain growth of rocksalt materials in the first step may lead to incomplete lithiation of the material in the second step, resulting in rocksalt impurities, so the first step should contain enough Li to fully convert the material to the layered phase. A first step Li/TM ratio of 0.9–0.975 and heating temperature of 850 °C can be used to grow particles to a suitable size. While a second step temperature of 700 °C can be used to produce decent materials, a higher second step temperature of 750 °C was able to reduce the Ni content in the Li layer down to ∼2% for NiMg materials. SC NiAl materials synthesized in this study could not avoid the formation of Li5AlO4 impurity even at a Li/TM ratio of 0.5. SC NiMg cells are not yet competitive with PC NiMg cells. Compared to PC NiMg cells, SC NiMg cells have lower capacity, a higher irreversible capacity, and higher cycling fade. Further development is needed to improve SC NiMg materials.
Acknowledgments
The authors would like to acknowledge NSERC and Tesla Canada for funding this work under the auspices of the Industrial Research Chair program. AL thanks Nutthaphon Phattharasupakun for his help with the PC NiMg sample. AL thanks the Walter C. Sumner Foundation for financial support. NZ thanks the China Scholarship Council for financial support. HL thanks the Nova Scotia Graduate Scholarship program for financial support. The authors thank Yiqiao Wang, Shuo Yin and Haohan Wu of Zoomwe for providing the precursors used in this work.