

Abstract
A series of spirocyclic copolymer membranes with varying ion exchange capacities (IECs) were investigated to probe the impact of polymer properties on in situ fuel cell performance and stability. In-situ electrochemical tests and post-mortem electron microscopy analysis of cross-sectioned membrane electrode assemblies (MEAs) have been combined with voltage loss breakdown analysis to evaluate the performance and degradation of different MEAs, and to probe the catalyst morphology and electrode structure at different stages of operation. Voltage loss breakdown results show that membrane degradation and kinetic losses played only a minor role in observed performance degradation and that performance losses were primarily related to increasing mass transport losses. From microscopy studies, carbon corrosion and Pt nanoparticle growth were identified at both the cathode and anode although more pronounced on the cathode resulting in significant structural changes. The membrane with the lowest IEC (1.3 mmolg−1) demonstrated the lowest peak power density ~ 1.16 W cm−2, however, it showed the most stable performance (constant 0.6 A cm−2 hold) with ~ 5% degradation over 540 h. Isolation of performance losses and microscopic analysis of electrodes for anion exchange membrane fuel cells has not been reported previously, and these results help identify critical performance degradation concerns.
Export citation and abstract BibTeX RIS

This is an open access article distributed under the terms of the Creative Commons Attribution Non-Commercial No Derivatives 4.0 License (CC BY-NC-ND, http://creativecommons.org/licenses/by-nc-nd/4.0/), which permits non-commercial reuse, distribution, and reproduction in any medium, provided the original work is not changed in any way and is properly cited. For permission for commercial reuse, please email: permissions@ioppublishing.org.
Fuel cells are electrochemical energy conversion devices that are a promising technology to provide clean, sustainable energy. These scalable devices can be utilized for transportation, remote and distributed power, and large-scale electricity production. While proton exchange membrane fuel cells (PEMFCs) are the current leading FC technology, anion exchange membrane fuel cells (AEMFCs) have emerged as an attractive lower-cost option due to their recently demonstrated improvements in power densities and stability. 1–3 Because of the alkaline environment of the AEMFC, non-platinum-group metal catalysts and less expensive metal hardware can be employed to offer potential cost reductions. There is an abundance of research towards optimizing fuel cell operation of AEMs and continuing efforts to improve properties of anion exchange membranes (AEMs). Ideally, such a membrane would possess long-term chemical and mechanical stability in high pH at elevated temperatures (80 °C or higher) along with high hydroxide ion conductivity. Until recently, achieving high hydroxide conductivity in AEMs was a critical barrier for the development of AEMFCs. However, recent reports have demonstrated AEMs with hydroxide conductivities of 200 mS cm−1 at 80 °C. 4–6 This major improvement over the past decade in the development of highly conductive AEMs combined with advances in chemical stability has significantly contributed to the advancement of research focusing on in situ fuel cell performance. 7–10
Several exceptional AEMFC performances have been reported in the recent years. 11–13 Since 2017, multiple researchers have demonstrated high conductivity AEMs paired with optimized electrodes to achieve peak power densities greater than 1 W cm−2. 14,15 Omasta et al. showed the importance of electrode water balance affecting AEMFC performance by conducting both operando electrochemical measurements and neutron imaging; in addition, they reported an outstanding peak power density of 1.9 W cm−2 in oxygen utilizing a series of systematically designed electrodes. 16–18 The first AEMFC to exceed 2 W cm−2 was reported in 2018 by Wang et al. for an LDPE radiation-grafted AEM with a benzyltrimethylammonium (BTMA) cation. 19 The LDPE radiation-grafted AEM had a hydroxide anion conductivity of 200 mS cm−1 at 80 °C and 100% relative humidity (RH), which led to an AEMFC performance of 2.0 W cm−2 (80 °C, RH = 92%, PtRu/carbon anode, Pt/carbon cathode) in oxygen. In 2019, Huang et al. reported the current record in peak power density of 3.4 W cm−2 (80 °C, PtRu/Vulcan carbon anode, Pt/Vulcan carbon cathode) using hydrogen and oxygen, the highest AEMFC performance to-date. 20 These AEMs, which were lightly crosslinked, reinforced block copolymers of poly(norbornenes) with pendant quaternary ammonium head-groups, were stable (no change in membrane resistance and minimal loss of operating voltage) for over 500 hours (h) under load.
Although high power densities have now been demonstrated in AEMFCs, long-term performance degradation remains a limiting factor for the realization of the technology, even though recent advances have demonstrated the ability to reach 2000 h. 21 Reports of over a few hundred hours operation remain limited to a few reports, 1,20,22–24 and the mechanisms responsible for performance degradation are only starting to be investigated. While there are many possible reasons contributing to performance loss over time (e.g. chemical degradation of the polymer/ionomer, changes in hydrophobicity, carbon corrosion, catalyst migration/coalescence, catalyst-ionomer interactions, or catalyst poisoning), they have not yet been well quantified by the research community. Systematic changes to polymer backbones, functional cations, and electrode processing and operating conditions combined with fuel cell studies can lend insight into the importance of different degradation mechanisms.
The research community has put significant effort into exploring alternative cations with higher base stability due to implied impact on AEMFC lifetimes. 25 In 2015, in a broad examination by Marino and Kreuer of quaternary, nitrogen-based cations, it was determined that heterocyclic and spirocyclic ammonium small molecules were significantly more base-tolerant compared to common tetraalkylammonium and imidazolium cations. 26 More specifically, the spirocyclic small molecule 6-azonia-spiro[5.5]undecane (ASU) achieved a half-life twenty-six times greater than the half-life of BTMA, the most common cation used in AEMs, at 160 °C in 6 M NaOH. These results have catalyzed the development of new spirocyclic-based AEMs that hold promise for improved stability in AEMFCs.
Previously, Strasser et al. reported a series of hydrophobic-hydrophilic block-type copolymer AEMs containing polysulfone segments and spirocyclic poly(diallylpiperidinium hydroxide) segments. 27 Figure 1 depicts the chemical structure of these polysulfone-poly(diallylpiperidinium hydroxide) (PSF) multiblock copolymers. In the previous study, PSF demonstrated promising chemical stability, mechanical properties, and conductivity. These multiblock copolymers achieved hydroxide conductivities as high as 102 mS cm−1 at 80 °C and no degradation of the cation was observed by 1H NMR after 1000 h at 80 °C in a 1 M KOH/methanol-d4 solution. Herein, we explore the ex situ membrane properties (e.g. chloride conductivity, base stability, water uptake) of PSF membranes at different IEC levels, and obtain fuel cell performance and stability results for these AEMs. Additionally, we perform post-mortem electron microscopy on MEA cross-sections to prove the degradation mechanisms occurring in both anode and cathode. These results provide a strong basis for the critical performance and stability issues for AEMFCs.
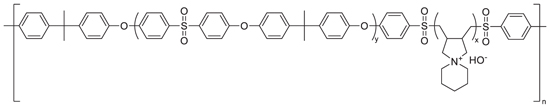
Figure 1. Chemical structure of multiblock polysulfone-poly (diallylpiperidinium hydroxide) (PSF) multiblock copolymers.
Download figure:
Standard image High-resolution imageExperimental
Polymer synthesis
A straightforward method for producing AEMs with spirocyclic ammonium cations involves the cyclopolymerization of N, N-diallylammonium chloride heterocycles. This type of radical polymerization propagates through the formation of 5-member rings to introduce the cation as part of the polymer chain. The detailed polymer synthesis of polysulfone–PDApipPF6 (PSF) multiblock copolymers was reported previously. 27 Herein, polymers with three different ion exchange capacity (IEC) (IECs: 1.3, 1.5, and 1.7 mmol g-1) were synthesized and cast into AEMs. Polymers are named according to their corresponding IECs (i.e. PSF-1.3, PSF-1.5, and PSF-1.7).
Membrane fabrication
PSF membranes were fabricated by casting the multiblock copolymer solution onto a glass substrate. Polymer solutions were 15% w/v of copolymer in dimethylacetamide and were filtered through a plug of glass wool prior to casting. The polymer solutions were deposited onto a glass sheet and were made uniform with a doctor blade set to 750 μm. The glass was heated to 75 °C on a hotplate to slowly evaporate solvent. PSF membranes were removed from the substrate by soaking in water. The free-standing membranes were then dried for 12 h minimum in a laboratory convection oven exposed to air at 60 °C.
Anion exchange
AEM samples were exchanged into the chloride form by soaking in 100 ml of 1 M NaCl for 30 min, repeated three times with fresh solution. The AEM was then washed by soaking in 100 ml of DI water for 30 min, repeated three times with fresh DI water. The chloride-exchanged membrane was then dried for 12 h minimum in a laboratory convection oven exposed to air at 60 °C.
Ion conductivity
The membrane was cut into a geometry of approximately 5 mm wide by 30 mm long. The membrane was placed in a four-point in-plane conductivity cell with parallel platinum electrodes (Bekktech cell or other). For liquid water conductivity, the AEM was equilibrated at room temperature in DI water for 1 h. Ionic conductivity was measured in the chloride form as a surrogate for hydroxide conductivity without concerns for carbonation with electrochemical impedance spectroscopy (EIS; Solartron, 1470E 8-channel potentiostat, 1400 A frequency response analyzer, Zplot software) over a frequency range of 10−105 Hz at 10 mV. This approach has been proposed to be a standard, more accurate protocol for establishing ion conductivity of anion exchange membranes. 28,29 Conductivities in varied temperature at high humidity were also collected in an environmental chamber, where temperature and relative humidity are controlled to T: 30 °C, 40 °C, 50 °C, 60 °C, 70 °C, 80 °C and RH: 95%, respectively, for 1 h at each condition. The in-plane conductivities of the polymer films were measured in a cell with four-parallel electrodes, where an alternating current is applied to the outer electrodes and the real impedance or resistance, R, is measured between the two inner reference electrodes. The resistance was determined from the high x-intercept of the semicircle regression of the Nyquist plot. Conductivity is calculated as

Where L is the distance between the two inner reference electrodes measured by caliper, W is the wet/humidified film width measured by caliper, l is the wet/humidified film thickness measure by micrometer, and R is the resistance measured between the two reference electrodes. Samples were allowed to equilibrate for 1 h at each temperature and humidity followed by a measurement at the equilibrium condition.
Ion exchange capacity
A dry, Cl-exchanged AEM sample was weighed; dry weight of the membrane sample was recorded and must be greater than 50 mg. The AEM sample was soaked in a 100 ml sample cup containing 60 ml of 0.1 M NaNO3 solution for a minimum of 6 h. The sample cup containing the AEM and the 0.1 M NaNO3 solution were added to a Mettler Toledo (MT) T90 auto-titrator. The MT T90 was used for titration with a 0.1 N AgNO3 solution. Sensor DM141-SC was used to monitor titration. IEC results are displayed in units of (mmol cation/g dry polymer). Measurements were performed twice per AEM and reported as an average value for improved accuracy.
Hydroxide stability measurements
After IEC was measured, the AEMs used during IEC measurements were dried overnight at 60 °C in a vacuum oven or convection oven exposed to ambient air. Total AEM mass used was around 100–150 mg to ensure reliable measurements. The membranes were placed in a 20 ml Teflon-lined Parr reactor. A solution of 1 M KOH was freshly made, and 10 ml of the solution was added to the Parr reactor, taking care that the entire membrane was well covered by solution. The Parr reactor was closed tightly and placed within an oven equilibrated at 80 °C for 1000 h. Upon completion of 1000 h testing, the Parr reactor was removed and quenched in cool water. The sample was removed and washed with DI water. The AEM was exchanged to chloride form according to the previously described anion exchange protocol. Membrane IEC and conductivity were measured post-degradation, according to the ionic conductivity and IEC protocols described above. Conductivity and IEC loss were measured comparing the values from before degradation to after degradation. Percent conductivity loss was calculated as

Where σ0 is the initial liquid water, room temperature, Cl− conductivity before degradation and σf is the final liquid water, room temperature, Cl− conductivity after 1000 h degradation experiment in 1 M KOH at 80 °C.
Water uptake, swelling and hydration number
AEM samples were cut into squares (surface area: 5 cm2) via die cutting. Water uptake was measured by fully submerging the Cl-exchanged AEM in DI water and soaking at room temperature for 24 h. The wet film sample was lightly patted dry using Kimwipes and weighed immediately. Three wet thickness measurements were also made in the center of the membrane using a micrometer and averaged. The membrane was then dried for at least 12 h in a laboratory convection oven exposed to air at 60 °C and weighed again, immediately upon removal from the oven. Three dry thickness measurements were also made in the center of the membrane using a micrometer and averaged. The water uptake (content) [wt%; (g H2O/g dry polymer) × 100] in the polymer was calculated according to the following equation:

Where W0 and W are dry and wet polymer weights measured at the end of the oven drying step and at the end of the water soaking step, respectively. The thickness swelling in the polymer was calculated according to the following equation:

Where l0 and l are dry and wet polymer thicknesses measured at the end of the oven drying step and at the end of the water soaking step, respectively.
Hydration number (λ) is also a commonly used parameter for water properties (moles of water per moles of cation), which was calculated as

Membrane electrode assembly (MEA) preparation
In this study, ethylene-co-tetrafluoroethylene-g-poly (vinylbenzyltrimethylammonium chloride) (ETFE-g-poly (VBTMA+Cl−)) polymer powder (in Cl− form) was used as the anion exchange ionomer (AEI) in all of the electrodes shown in this work, referred as ETFE ionomer in this manuscript. The detailed synthesis of the AEI powder has been previously reported. 30 In summary, ETFE powder (Z8820X, AGC Chemical Europe) with a particle size of 20–30 um was grafted with vinylbenzyl chloride (VBC) using an electron-beam followed by quaternizing by trimethylamine (TMA) solution to yield ETFE-g-poly(VBTMA+Cl−) AEI ionomer. The ionomer has an IEC equal to 1.24 ± 0.06 mmol g−1.
Two commercial carbon supported catalysts were used in the electrodes: platinum (Pt) supported on Vulcan carbon catalyst (40 wt.% Pt, 60 wt.% carbon, Alfa Aesar HiSPEC 4000) (denoted as Pt/Vulcan) and platinum ruthenium (PtRu) supported on Vulcan carbon catalyst (40 wt.% Pt, 20 wt.% Ru, 40 wt.% carbon, Alfa Aesar HiSPEC 10000) (denoted as PtRu/Vulcan) for cathode and anode, respectively. Using PtRu/Vulcan as the anode catalyst has been shown to increase performance compared to having Pt catalyst in the anode electrode due to Ru improving HOR kinetics by weakening the Pt-Had interaction, which motivates us to use this higher performing catalyst in our work. 31 The electrode fabrication procedure applied here was similar to a previous report 17 and summarized here. For the preparation of the cathode, the ETFE AEI solid ionomer was ground finely with agate mortar and pestle followed by mixing with Pt/Vulcan, DI water and 2-propanol so that the final ink composition (by weight) is 5:12:8 for ionomer, Vulcan carbon, and Pt, respectively. The ink is alcohol heavy which composes a ratio of water and 2-propanol of 1:9. The catalyst mixture was tip sonicated using a Branson S-4000 sonicator for 20 s, followed by bath sonicating in ice for 20 min using a Branson 3800 sonicator beforehand spraying the catalyst layer directly onto a gas diffusion layer (GDL, Toray TGP-H-060 with 5% PTFE wetproofing) to produce gas diffusion electrodes (GDEs). A similar electrode fabrication method was used to produce the anode electrode made with PtRu/Vulcan. Additional Vulcan was added so that the same ink compositions of 5:12:8 for ionomer, Vulcan carbon, and PtRu, respectively was maintained. The catalyst loading of Pt and PtRu was measured by an energy dispersive X-ray fluorescence (EDXRF) spectrometer. GDEs with an active area of 5 cm2 were cut to assemble with an over-sized 5 cm2 PSF AEM membrane for fuel cell testing. The high catalyst loadings targeted with this study were meant to be in line with other studies which have focused on maximizing cell power density and minimizing kinetic losses.
MEA assembly and in situ AEMFC testing
Each electrode (i.e., anode and cathode) and the PSF membrane were separately ion exchanged by immersion in 1 M KOH solution for 48 h exchanging fresh base solution at least three times prior to MEA assembly for fuel cell testing. To assemble the MEA, the membrane was sandwiched between two base-exchanged GDEs and pressed together and secured in a 5 cm2 Fuel Cell Technologies hardware between two single pass serpentine flow graphite plates using fiber reinforced PTFE gaskets to obtain a 25% compression with a torque of incremental steps of total 40 lb-in (4.5 N-m).
The assembled fuel cell was attached to a custom modified 890E Scribner Fuel Cell Test Station. The cell temperature, anode and cathode dew points were set at 60 °C initially. H2 and N2 were supplied to the anode and cathode, respectively, at 1.0 standard liter per minute (slpm) until the desired temperature was achieved. Then the N2 was switched to O2. Back pressure of 121 kPa was applied to the cell. After OCV stabilized, a constant voltage of 0.5 V was applied to "break-in" the cell and remove carbonates from the MEA that resulted from exposure to air during cell assembly. 18,32 Break-in was done until a plateau in the current density was observed, which usually took around 40–50 min. Polarization curves were measured by sweeping voltage from OCV to 0.1 V at a scan rate of 10 mVs−1 at various RH conditions. The cell was equilibrated at each RH condition for at least 15 min at a constant 0.5 V before its polarization curve was measured. High frequency resistance (HFR) was measured by single frequency (7.5 kHz) HFR measurement using the Scribner 880 loads.
Cyclic voltammetry and electrochemical surface area measurements
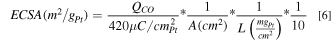
The electrochemical surface area (ECSA) of both anodes and cathodes were determined by carbon monoxide (CO) stripping voltammetry experiments based on an established procedure. 33 Specifically, the fuel cell was cooled to 30 °C for at least 30 min flowing fully humidified H2 and N2 at 0.2 slpm (through the counter and working electrode flow fields, respectively) without back pressure (i.e. at 84 kPa in Golden, Colorado). Then, 0.1% CO/Argon at 0.2 slpm was passed over the working electrode, where the cell was held at a potential of 0.2 V vs H2 at the reference electrode for 10 min to ensure complete adsorption of CO at all active sites. Following the CO adsorption, nitrogen was purged for 30 min to remove excess CO, then a cyclic voltammetry (CV) was run between 0.06 and 1.2 V at 20 mV s−1 for three cycles, where CO was stripped from all electrochemically active platinum sites during the first cycle. Total platinum surface area was determined by integrating the CO oxidation current over a linear baseline accounting for Pt oxidation features present at high potentials (V > 0.8 V) dividing by 420 μC cm−2 Pt. ECSA was then normalized by the catalyst metal loading as shown in the equation below.
Hydrogen crossover measurements
Hydrogen crossover measurements were conducted by flowing H2 at the anode and N2 at the cathode with a flow rate of 0.2 slpm at the end of the stability test at its final cell operating temperature, back pressure and relative humidity values (e.g. in the range of 61 °C–65 °C, 121–126 kPa back pressure and 100–115% RH). The H2 crossover current was measured by applying a voltage of 0.5 V across the cell to obtain H2 crossover limiting current density (iH2). The Department of Energy has targeted that the maximum H2 crossover current density for a novel electrolyte membrane to be less than 2 mA cm−2 at the beginning of life. 34
Deconvolution of AEMFC polarization curves
To understand the different fuel cell performance, the various contributions to the recorded polarization curve were deconvoluted following the method which was published by Gasteiger et al. 35 For the major polarization loss assumed to be a result of kinetic, ohmic and mass transfer resistance, the thermodynamic reversible cell potential can be described as:

where the Erev is thermodynamic reversible cell potential (can be convert from the standard reversible cell potential by Nernst equation), Ecell is measured cell potential, ηΩ, ηk, and ηMT represent to the ohmic, kinetic, and mass transport overpotential, respectively. Ohmic overpotential is the result of ionic and electronic resistance. This resistance obeys the Ohmic Law as shown below:

where the i is measured current density, Rohm was measured by frequency response analysis of the operating cell. This simplified analysis underestimates the impact of ionic conductivity in the electrodes and results in electrode ion conduction losses being calculated effectively as mass transport losses.
In the lower current region (less than 100 mA cm−2), it can be assumed that kinetic resistance dominates, and mass transfer resistance can be ignored. The Tafel equation describes the current density-voltage polarization curve in this region:

where the b is Tafel slope and a is kinetic parameter. The result fit is then used to extrapolate the kinetic overpotential through the entire curve. The mass transfer overpotential is then calculated by subtracting the ohmic and kinetic overpotentials from the reversible cell potential.
Transmission electron microscopy (TEM) characterization
For analysis of MEAs with transmission electron microscopy (TEM), MEA cross-sections were prepared using ultramicrotomy. The MEAs were embedded in Araldite 6005 epoxy resin mixture, that was cured at 60 °C for 16 h, followed by block trimming and ultramicrotomy using a 36° clearance angle Diatome diamond knife. TEM images were obtained using a FEI Talos F200X electron microscope operated at 200 keV. The MEA cross-sections were approximately 70 nm thick making them electron transparent for TEM.
Results and Discussion
Ex situ membrane property characterization and membrane chemical stability
Ex situ membrane properties including hydration number (λ), swelling, and conductivity were measured as a function of temperature and IEC. Figure 2a compares the λ and swelling at room temperature as a function of their IEC of chloride form membranes; and Fig. 2b compares conductivity at 95% RH as a function of temperature. Results are generally as expected, with membranes following an increasing trend in λ and swelling with increasing IEC (Fig. 2a). While PSF AEMs show a linear change in λ with IEC, the increase in swelling observed with IEC is more exponential in nature. This non-linearity is likely related to the high water uptakes of the high IEC (1.7 mmol g−1) sample and reflects the challenges in the hydrophobic portion of the polymer being able to resist swelling forces in the hydrophilic portion of the polymer. These trends of increasing water content and swelling with IEC have been well-established in other proton and hydroxide conducting polymer electrolytes. 36–40 Conductivity shows clear and expected trends of increasing conductivity as a function of temperature (Fig. 2b). Conductivity increases significantly between 1.3 and 1.5 IEC, but the 1.7 IEC sample shows essentially no change in conductivity compared to the 1.5 IEC sample. This result can be rationalized in terms of the water uptake in Fig. 2a, where increases in swelling offset the increasing IEC and additional water available and serve to dilute the active conducting ionic sites. To provide a baseline for comparison of PSF AEMs and Nafion® 211, Nafion® 211 was reported to exhibit 26.5 mS cm−1 in Na+ conductivity at room temperature at fully hydration condition. 41 Although it is not the most ideal comparison due to the different testing conditions (e.g. fully hydrated vs 95% RH, and room temperature vs temperature from 30 °C–80 °C, for Nafion® 211 and PSF AEMs, respectively), both Nafion® 211 and PSF AEMs have their salt-form conductivity of similar magnitude.
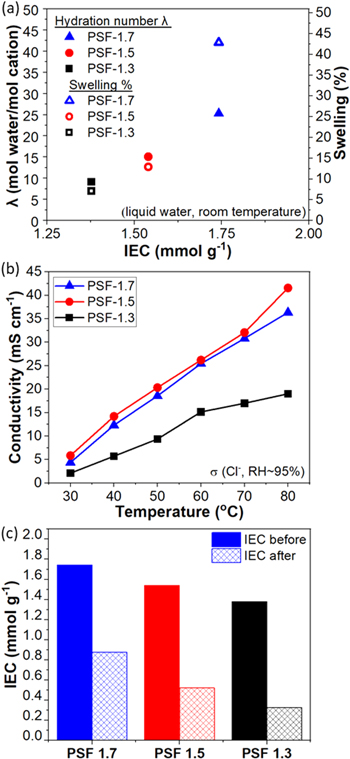
Figure 2. (a) Hydration number λ (solid) and swelling (hollow) were evaluated in PSF AEMs of varying IEC at room temperature in liquid water and (b) PSF AEMs of varying IECs were evaluated for chloride conductivity at 30, 40, 50, 60, 70, 80 °C at a constant RH of 95%. (c) IEC of the pristine and after-test of PSF AEMs over 1000 h in 1 M KOH at 80 °C.
Download figure:
Standard image High-resolution imageMajor strides have been made in the AEM community for increasing AEM stability. Despite reported progress towards improving AEM stability, longevity challenges remain for the stability of hydroxide-conducting membranes, particularly at higher temperatures (>80 °C). 1 Membrane chemical stability tests of AEMs were performed in alkaline environment at elevated temperature over a period of 1000 h. While radical attack may also result in chemical stability concerns, no specific probes of stability to radicals have been probed in this study. The stability results were previously reported by our group and it is evident from visual inspection of the membranes post-degradation, that the mechanical properties of the AEMs have been drastically diminished. 42 While further mechanical testing is required to expand upon the apparent thermal aging of the membranes, IEC was measured before and after the chemical stability experiment to allow quantifying the extent of degradation. Figure 2c shows IEC values before and after the stability test for each of the PSF AEMs. Poly aryl ether sulfones have been reported in the literature to be susceptible to hydroxide attack, 43,44 and we did find significant losses for the samples tested here. PSF-1.7 has the lowest IEC loss. One potential explanation for this would be the high water uptake of PSF-1.7 may have provided some protection against degradation within the membrane. This finding is consistent and supported by previous literature, 45,46 where it has been reported that higher stability in alkaline media can be associated with increased water solvation of head-groups. Overall, the ex situ stability of PSF membranes is not particularly compelling. In another study focused on ex situ screening of multiple membrane chemistries performed by our group, 42 PSF exhibited the lowest stability of IEC and conductivity of the samples tested. With PSF being relatively low stability compared to other AEMs in ex situ membrane stability testing, the primary reasons to pursue these materials in in situ tests were to study performance tradeoffs based on tuning IEC within a set of polymers, to probe the relationship between ex situ and in situ measured stability, and to apply established diagnostic approaches to understanding AEMFC performance and stability.
In situ AEMFC performance
To investigate in situ fuel cell performance and stability of PSF AEMs systematically, a set of equivalent electrodes with ETFE ionomer 30 were prepared for testing the different IEC AEMs. Performance of similar electrodes prepared with this type of ionomer using the same catalysts have been reported by several groups and yielded the highest reported AMFC performance. 11,16,20,22 PSF-1.5 and PSF-1.7 AEMs were initially selected to be tested for fuel cell performance and stability due to their higher water uptake and ionic conductivity compared to PSF-1.3. A similar thickness of PSF-1.5 and PSF-1.7 AEMs were prepared and their wet thicknesses were around 55 μm after being exchanged in 1 M KOH. The catalyst loading of the anode and cathode were measured to be ∼0.8 PtRu and ∼0.55 Pt mg cm−2, respectively. Unfortunately, we did not immediately recognize the value of testing PSF-1.3 at this thickness and when we did recognize that such tests would be valuable, we were unable to perform them due to materials and personnel limitations within the project.
Polarization curves under H2/O2 AEMFC operation at 60 °C for PSF-1.5 and PSF-1.7 MEAs are shown in Fig. 3. Figure 3a shows that both MEAs demonstrate promising performance at the optimized RH condition of ~ 86% RH, where at 0.8 V, they have similar current density ~ 0.50 A cm−2; and at 0.6 V, they are able to achieve operating current density of 2.0 and 2.4 A cm-2 for PSF-1.5 and PSF-1.7, respectively. Under the test conditions presented, both polarization curves achieve a maximum current density at ~0.4 V, slightly decreasing at lower cell voltages. This feature suggests flooding that has not achieved a true limiting current, steady-state equilibrium where transient effects may have enabled increase current density for a brief period of time before water accumulated, likely in the cathode.
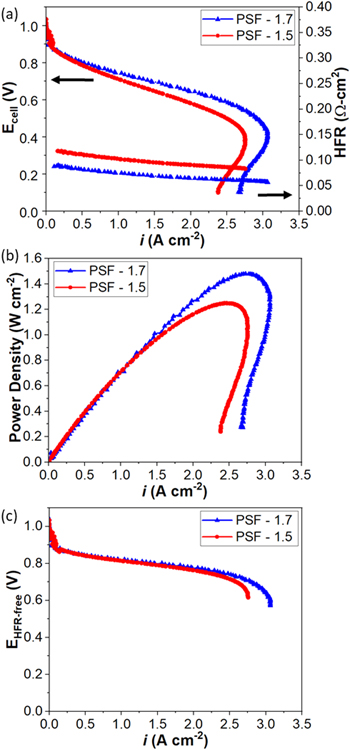
Figure 3. (a) polarization curves and HFR, (b) power density, and (c) HFR-free polarization curves under H2/O2 AEMFC operation under (partially optimized) anode/cell/cathode dew points of 57 °C/60 °C /57 °C (86% RH) and 121 back pressure for MEAs using 1.5 and 1.7 mmol g−1 IEC PSF AEMs with similar membrane thickness of 55 μm. Catalyst loading of anode and cathode is 0.8 PtRu and 0.55 Pt mg cm−2, respectively.
Download figure:
Standard image High-resolution imageThe PSF-1.7 based MEA exhibits higher performance throughout the ohmic and transport regions and it also yields lower HFR. This could be associated with its higher IEC leading to higher water uptake and ionic conductivity, thus lower membrane resistance of the tested MEA under the fuel cell operational conditions. However, the data in Fig. 2b suggests that a slightly lower HFR might be expected for PSF −1.5. The differences in these values are not fully understood and may be due a combination of factors that include modest difference in membrane thickness, impact of water uptake/transport through different polymers, and/or membrane/GDE interfacial considerations. Despite different HFR values observed from the two MEAs, both HFR measurements shows a decreasing trend with increasing current density, suggesting better hydration within the membrane at higher current. This result suggests that the anode is effective at pushing water back into the membrane and that cathode dry out, counterintuitively, is actually more pronounced at lower current density. Figure 3b shows peak power densities ∼1.24, and 1.48 W cm−2 for PSF-1.5 and PSF-1.7, respectively, indicating very competitive performance. 3,47 In fact, the power densities reported for this work are exceptional relative to other spirocyclic AEMs reported to date. 48,49
As previously mentioned, the electrodes have been fabricated using identical fabrication processes for all of the evaluated MEAs. Correcting the polarization curves to HFR-free voltage, Fig. 3c, thus provides a clearer comparison of electrode performance of the MEAs. HFR corrected oxygen polarization curves result in performance data that overlaps in the kinetic and ohmic region, showing differences only become apparent at high current density (mass transport dominated region), above 2.0 A cm−2. The expected increased water transport properties of PSF-1.7 may be a reason that higher current density can be achieved with this AEM. At higher currents, more water is produced, consumed or transported leading to increased probability of flooding especially at the anode and increased mass transport resistance. 47 The dynamics of water transport in the cell are critical for cell performance. Overall, Fig. 3c illustrates the equivalent performance of the electrodes tested and highlights the performance impacts witnessed in Fig. 3a as being related to the ohmic losses of the different MEAs and mass transport limitations at high current density related to water management/electrode concerns.
In situ AEMFC stability
Stability is a key concern for AEMFCs. The abovementioned PSF AEMs were tested for their stability according to a US Department of Energy (DOE) target guideline, demonstrate alkaline membrane fuel cell performance of 0.6 V at 0.6 A cm−2 on H2/air (CO2 free, maximum pressure of 1.5 atma) at T > 60 °C with less than 10% voltage degradation. To achieve DOE's targets and ensure consistency, multiple duplicate MEAs for each membrane were tested under DOE assigned conditions: H2/CO2-free air at 0.6 A cm−2 at a range of 60 °C–65 °C. 34 Total cell pressure was adjusted to keep gas partial pressures constant regardless of cell temperature (i.e., both anode and cathode dry gas pressure was kept at 101.3 kPa). In Fig. 4a, stability performance as a function of time at 0.6 A cm−2 is presented for three duplicate MEAs consisting of PSF-1.7 AEM and PSF-1.5 AEM (total 6 MEAs). Each tested MEA is labeled with the membrane IEC and number of hours tested (e.g., PSF-1.7140 h refers to a MEA using PSF-1.7 membrane tested for 140 h). For all three PSF-1.7 MEAs, they start with an initial voltage in a range of 0.70–0.74 V under air, and all consistently fail catastrophically at 140–150 h. All of the PSF−1.5 MEAs also start with similar initial voltage ~ 0.70–0.74 V under air. They exhibit a slower performance drop and can survive up to 300 h before cell voltage falls below 0.6 V. It is worthwhile to note that the cell potential was cycled every 48 h between OCV and 0.1 V at a scan rate of 10 mVs−1 to recover performance—both by rapidly rebalancing water and purging carbonates. 50 This explains why, for example, there were notable increases in the cell voltage for PSF-1.5300 h at 36 and 84 h.
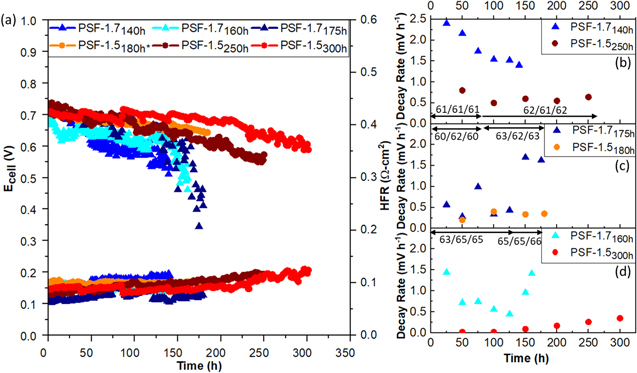
Figure 4. (a) In situ stability plots showing cell voltage as function of testing time for MEAs fabricated with PSF-1.5 and PSF-1.7 under H2/CO-free air at 0.6 A cm−2 at a range of 61 °C–65 °C cell operating temperature. A range of back pressure between 121 to 126 kPa was applied. Multiple duplicated MEAs were prepared and tested to ensure the consistency of fuel cell stability performance. * the sample was stopped for test station reasons while still maintaining measurable performance. The other MEAs shown here were stopped due to catastrophic cell failure. Decay rate as function of testing time for PSF-1.7 and PSF-1.5 MEAs (b) starting at a fully humidified dew point environment (61 °C/61 °C/61 °C) for 75 h of testing, then over-humidified (62 °C/61 °C/62 °C) until the cells stopped; (c) starting at a subsaturation humidified dew point environment (60 °C/62 °C/60 °C) for 75 h of testing, then over-humidified (63 °C/62 °C/63 °C) until the cells stopped; (d) starting at a "customized" dew point environment (63 °C/65 °C/65 °C) for 125 h, then over-humidified at cathode (65 °C/65 °C/66 °C) until the cells stopped.
Download figure:
Standard image High-resolution imageTo probe degradation of the tested MEA, Figs. 4b–4d present voltage decay rates over the testing period, where each figure compares a pair of PSF-1.7 and PSF-1.5 MEAs under similar cell conditions: (4b) fully humidified where anode/cell/cathode dew point is 61 °C/61 °C/61 °C (100% RH) for beginning of 75 h of testing, followed by over-humidified (62 °C/61 °C/62 °C) until the cells stopped, (4c) subsaturation humidified ~ 60 °C/62 °C/60 °C (91% RH) for first 75 h of testing, followed by over-humidified (63 °C/62 °C/63 °C) until the cells stopped, and (4d) partially optimized anode/cell/cathode dew points of 63 °C/65 °C/65 °C (i.e. dryer anode and wet cathode) for first 125 h of testing, followed by over-humified at cathode (65 °C/65 °C/66 °C). The choice to change humidification during lifetime testing was in part in an attempt to impact performance decay over time. While the changes in temperature and humidity probed were not large, they were found to have significant impact on degradation. These studies provide close comparison between PSF-1.7 and PSF-1.5 MEAs and the dependence of relative humidity on performance degradation.
Across Figs. 4b–4d, the first trend that is immediately apparent is that PSF-1.7 MEAs always show higher decay rates than PSF-1.5 MEAs. Another apparent trend is that PSF-1.7 MEA decay rates are more variable than PSF-1.5 MEAs with significant increases in decay rate observed at later times in 2 of the 3 experiments (4c and d). The acceleration of voltage decay is also apparent in Fig. 4a and is a feature that has been witnessed in other AEMFC stability testing.
Digging deeper into the voltage decay observed, at the highly humidified condition of Fig. 4b, both PSF-1.7 and PSF-1.5 MEAs have significantly higher initial voltage decay rates compared to the other two conditions probed (i.e. subsaturation humidified dew point condition (Fig. 4c) and "customized" humidified dew point condition where anode is dry ~ 91% RH and cathode at 100% RH (Fig. 4d). The relatively large voltage loss correlating to the most humidified conditions suggests that issues of flooding expected to be most severe at the anode, but also possibly at the cathode, may be leading to accelerated performance decay and/or that the impact of the degradation processes occurring have amplified performance loss impact at higher humidification. At slightly reduced cell humification (60 °C/62 °C/60 °C, 91% RH in Fig. 4c as compared to 100% RH for Fig. 4b), both PSF-1.7 and PSF-1.5 MEAs have much lower initial decay rates, ~ 0.25 and 0.2 mV h−1, respectively at 50 h. However, at 75 h, PSF-1.7175 h exhibited a dramatic increase of decay rate. Observing an increased degradation rate, the dew points of the anode and cathode were raised to provide an over-saturated cell condition to probe the ability to mitigate degradation rates using slight humidity changes. This had a short-term impact of reducing voltage decay rate but at 150 h a large jump and greatly accelerated voltage loss was observed.
Figure 4d probed what we observed to be better optimized humidification conditions (63 °C/65 °C/65 °C), where the anode had ~91% RH and cathode was fully humidified (~100% RH). Under these conditions, PSF-1.5 shows the lowest initial decay rate of any of the tests in Fig. 4. A slow gradual increase in decay rate is observed, accelerating over time. The PSF-1.7 sample initially shows a decrease in decay rate but exhibited an obvious increase in decay rate after 125 h, suggesting that there may be a very specific stability limit for PSF-1.7 MEAs. Additional studies were performed to try and understand the observed performance decay.
Cyclic voltammetry diagnostics probing MEA degradation
Cyclic voltammetry (CV) with CO-stripping was used to probe MEA degradation including quantification of catalyst electrochemically accessible surface area (ECSA). Figures 5 and 6 show cyclic voltammograms of both anodes and cathodes for the three PSF-1.5 and PSF 1.7 MEAs stability tested, respectively after testing. A few key features are immediately apparent when comparing either anodes to cathodes or PSF-1.5 to PSF-1.7 MEAs. For anodes to cathodes, the presence of Ru and its impact to shift CO stripping to lower potential is clearly evident. Additionally, for the PSF-1.5 MEAs it is clear that the anodes have retained much more of their initial ECSA, decreasing only from 32 to 30, 29 and 26 m2 g−1 for PSF-1.5180 h, PSF-1.5250 h PSF-1.5300 h, respectively, no more than a modest 15% loss, presented in Fig. 5b. Conversely, ECSA loss for the cathode was observed to decrease from 25 to 16, 8, and 6 m2 g−1 for PSF-1.5180 h, PSF-1.5250 h PSF-1.5300 h, respectively, a 36%–76% loss.

Figure 5. (a) CVs of anodes and cathodes for PSF-1.5 MEAs tested for 180 h, 250 h, and 300 h; (b) ECSA of PSF-1.5 MEAs for both anode (PtRu/Vulcan) and cathode (Pt/Vulcan) catalyst layer over the in situ stability test. Initial ECSA for anode and cathode was calculate based on average of several ETFE ionomer based electrodes.
Download figure:
Standard image High-resolution image
Figure 6. CVs of anodes and cathodes for PSF-1.7 MEAs tested for 140 h, 160 h, and 175 h.
Download figure:
Standard image High-resolution imageComparing the cyclic voltammograms obtained for PSF-1.5 MEAs with PSF-1.7 MEAs (stability tested for shorter times), it was observed that PSF-1.7 MEAs experienced greater impact than PSF-1.5 MEAs. At the shortest testing conditions (140 h), both PSF-1.7 anode and cathode CVs were relatively consistent with PSF-1.5 results albeit with slightly higher baselines values suggesting higher hydrogen crossover. The CVs still had clear and apparent Pt/PtRu features from which ECSA could be calculated, and cathode ECSA losses were observed to be much larger than anode losses. For the longer test conditions, CV characteristic Pt/PtRu features became less pronounced and developed sloped voltammograms that were biased to more positive currents, making it difficult to estimate ECSA. These are clear signs of cell shorting and H2 crossover, which indicates that the PSF-1.7 underwent physical changes during testing. Potentially the high water uptake of PSF-1.7 may have contributed to reduced mechanical properties and/or increased stresses perhaps focused on the active area edges that made PSF-1.7 more susceptible to both cell shorting and H2 crossover. 51–53 Such degradation mechanisms would be expected to be accelerated due to transient operating conditions. Although we did not initially measure H2 crossover for the MEAs presented, we ran an additional PSF-1.7 MEA to probe H2 crossover and found the limiting current density to be 2 mA cm−2 and 27 mA cm−2 at 2 h and after 120 h of testing, respectively. We did the same for a PSF-1.5 MEA and found that the measured crossover was less than 1 mA cm−2 initially and after 120 h of testing, showing dramatically decreased susceptibility to H2 crossover than the PSF-1.7 membrane. These results confirm the likelihood of the impact of crossover on the cells tested and support the premise that increased shorting was also likely. While the data for the PSF-1.7 samples are from single experiments with various levels of experimental uncertainty including exact thickness/homogeneity of membranes, and different stress factors that could have resulted from cell builds, this type of data is insightful for probing degradation processes at play and to date has not been presented in the literature in a similar way. The observations presented here will be discussed in further detail in conjunction with presentation of initial and post-mortem microscopic electrode analysis.
Improved PSF AEM with limited swelling and enhanced water transport for AEMFC performance and stability
Based on the results obtained for PSF-1.7 and PSF-1.5 MEAs, we expanded our materials investigation to include a lower IEC PSF copolymer, 1.3 mmol g−1. As lowering IEC is expected to reduce water transport and reduces conductivity, the polymer was cast into a thinner membrane ~ 10 μm to reduce ohmic losses and promote water transport. The choice of 10 μm was the thinnest that we could reliably cast by hand. In retrospect, comparisons at the ~55 μm thickness used int the PSF-1.5 and 1.7 studies would have been valuable to have for comparison purposes. This AEM is labeled as PSF-1.3 (ex situ properties already discussed previously and presented in Fig. 2). This PSF-1.3 AEM (~10 μm) was tested under the same conditions as PSF-1.5 and 1.7 (~55 μm).
Figure 7a combines polarization curves and HFR values under H2/O2 AEMFC operation at 60 °C at a partially optimized RH condition ~86% RH for all three MEAs. The three MEAs show similar performance up to 0.5 A cm−2, with a clear trend of improving performance with higher IEC at high current density, indicating better mass transport region performance. HFR measurements show expected trends of lower HFR using higher IEC for the two thicker membranes (1.5 and 1.7), but by using a thinner, lower IEC, PSF-1.3 AEM, the lower conductivity of the polymer is offset by membrane thickness. Additionally, PSF-1.3 demonstrates a very different HFR trend with current density, where both PSF 1.5 and 1.7 show decreasing HFR with current density, PSF 1.3 HFR shows little change with current density. Even though the PSF 1.3 MEA has a much thinner membrane which enhances rates of back diffusion of water from the anode to the cathode, it also has much lower water uptake and almost certainly much slower inherent water mobility than the higher IEC samples. In fact, trends do exist in this data that suggest that mass transport resistances may be related back to water transport rates through the different membrane materials, and the decreased water transport of the lower IEC samples impact high current density operation more dramatically than high IEC samples. The tradeoffs between water mobility and membrane thickness are complicated and further investigation and likely modeling will be required to fully interpret these results, but they are interesting to note for their potential importance for both initial performance and performance stability.
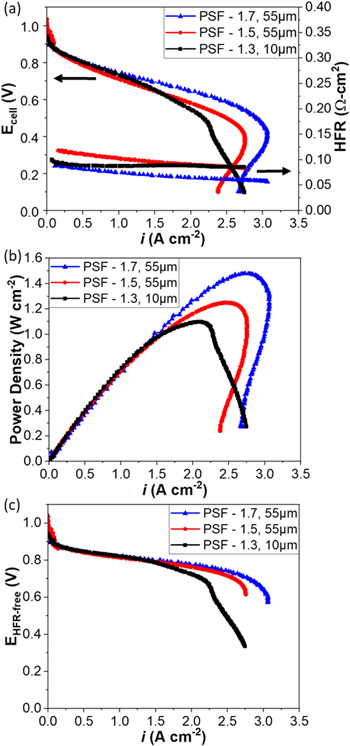
Figure 7. (a) polarization curves and HFR, (b) power density, and (c) HFR-free polarization curves under H2/O2 AEMFC operation under optimized anode/cell/cathode dew points of 57/60/57 (86% RH) and 121 kPa back pressure for MEAs using PSF AEMs exhibiting IEC ~ 1.3, 1.5, and 1.7 mmol g−1.
Download figure:
Standard image High-resolution imageFigure 7b shows power density of three MEAs. Although PSF-1.3 exhibits the lowest peak power density, it was still able to reach 1.16 A cm−2. This figure also helps highlight how from a performance perspective; the 3 different membranes exhibit almost identical performance up to 1.5 A cm−2. To help further illustrate the similarities of the MEAs, HFR-corrected voltage of the three MEAs is shown in Fig. 7c. Again, all three MEAs are essentially identical up to a current density of 1.5 A cm−2 with a clear trend of improved water management concerns with increasing IEC. Overall, Figs. 7b and 7c illustrate the equivalent performance of the electrodes tested and highlights the performance impacts witnessed in Fig. 7a as being related to the minor difference in ohmic losses of the different MEAs and to more substantial differences in mass transport limitations at high current density related to water management issues.
While the performance impact of going to a thinner, lower IEC AEM was probed in Fig. 7, the impacts on performance stability are explored in Fig. 8 under H2/CO-free air at a 0.6 A cm−2. While PSF-1.3540 h started out with slightly lower performance, it experienced a slower degradation rate than the other two higher IEC MEAs. A clear trend in degradation rate is seen where samples with higher membrane IEC exhibit faster degradation rates. HFR plots shown in Fig. 8 demonstrate consistent trends with voltage degradation where higher IEC samples show both faster voltage loss and faster HFR increase. The stability result of PSF-1.3 is inspiring because the approach towards lower swelling but tailoring the thickness of the AEM to enhance its water back diffusion under AEMFC operation certainly improved stability. The results are perhaps surprising in that the PSF-1.3540 h was very thin, ∼10 um, compared to the other samples ∼55 um, and it had lower stability in the ex situ aging tests performed on the membranes. Specifically, PSF-1.3 showed the least stability in KOH solution at 80 °C for 1000 h (Fig. 2), but still demonstrated the most durable performance in fuel cell testing. This indicates that care must be exercised in evaluating the appropriateness of ex situ methods for predicting the stability of AEMs during in situ fuel cell tests. 54
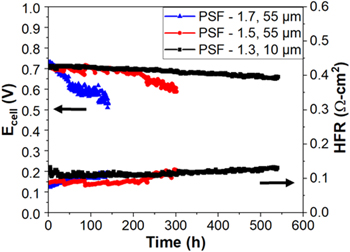
Figure 8. In situ stability test under H2/CO2-free air at 0.6 A cm−2 for PSF-1.3 and exemplified stability plots of PSF-1.5, and PSF-1.7 MEAs. PSF-1.7 started with anode/cell/cathode dew points of 61 °C/61 °C/61 °C for 75 h of testing under 122 kPa back pressure, then over-humidified (62 °C/61 °C/62 °C) until the cell stopped. PSF-1.5 started with dew points of 63 °C/65 °C/65 °C for 125 h with 126 kPa back pressure, then over-humidified at cathode (65 °C/65 °C/66 °C) until the cell stopped. PSF-1.3 was initially tested under dew points of 62 °C/61 °C/63 °C and 122 kPa back pressure for 250 h, then 62.5 °C/61 °C/63.5 °C until the cell stopped.
Download figure:
Standard image High-resolution imageQuantitative analysis of AEMFC by deconvolution of polarization curves
In order to better isolate the performance and stability losses in cells, initial performance H2/CO2−free air polarization curves for PSF-1.7, PSF-1.5 and PSF-1.3 (Fig. 9a) were deconvoluted into their kinetic (b), ohmic (c), and mass transport (d) overpotentials. As expected, air polarization curves of three MEAs show limited performance and higher HFR compared to oxygen polarization curves (Fig. 7) but followed a similar trend (e.g., PSF-1.7 has superior performance among all). Including both Figs. 7 and 9, O2 based and CO2-free air performances, respectively, we enable comparisons of the impact of nitrogen dilution while also presenting maximum power (O2), and conditions more relevant for most applications (CO2-free air). As would be hoped for MEAs with identical electrodes, the kinetic overpotentials in Fig. 9 are essentially identical. The ohmic overpotential scales with current density and is slightly higher for the PSF-1.3 based MEA. While the initial polarization losses due to kinetic and ohmic factors are unremarkable, they allow for mass transport losses to be calculated and compared. As the electrodes in these cells are identical, this data allows for the impact of membrane properties to be probed more specifically. The shape of each one of these curves is significantly different, each increasing with current density, but in qualitatively different ways. At low current density (below 1 A cm−2), PSF-1.7 has slightly larger mass transport losses. Within this region, all 3 samples show an approximately linear increase in mass transport overpotential with current density. However, as current increases, the mass transport overpotential becomes non-linear for all three samples. PSF-1.3 shows the most abrupt transition at ~ 1.3 A cm−2, reaching mass transport overpotential losses that resemble a traditional limiting current. PSF-1.7 shows a much slower transition without a clear limiting current feature. Interestingly, PSF-1.5 shows a hybrid between the PSF-1.3 and PSF-1.7 showing an abrupt increase at ~1.0 A cm−2, but then not reaching a complete limiting current. Based on the HFR values of these cells that only decrease with current density in Fig. 9a, these losses are likely attributable to water accumulation (flooding) in the electrodes. Because AEMFCs have a higher propensity for flooding in the anode, one might assume that these losses are primarily anode driven, although the data presented is not conclusive in this regard, and it is unclear at this point how big of a role each electrode plays. What is clear is that the membrane properties, namely water permeability and membrane thickness, can play a large role in terms of the mass transport overpotentials that occur within the cell for identical electrodes.

Figure 9. (a) Initial H2/CO-free air polarization curves for PSF-1.7 (61 °C/61 °C/61 °C), PSF-1.5 (63 °C/65 °C/65 °C) and PSF-1.3 (62 °C/61 °C/63 °C) were deconvoluted into their (b) kinetic, (c) ohmic, and (d) mass transport overpotentials.
Download figure:
Standard image High-resolution imageWhile initial performance measurements are interesting, they have more value when compared with changes in performance over time. To compare overpotential losses over time, polarization curves were recorded after stability testing and compared to initial polarization curves (Figs. 10a–10c, for PSF-1.7, PSF-1.5 and PSF-1.3, respectively). The overpotential losses were deconvoluted into their kinetic (i), ohmic (ii), and mass transport (iii) overpotentials from polarization curves with different membranes. The kinetic losses are essentially unchanged for PSF-1.3, but they increased significantly for PSF-1.5 and PSF 1.7. When assessing the ohmic losses, column of Fig. 10 (ii), it seems changes over time are relatively minor, with a small increase in PSF-1.7 and PSF-1.5 that might be due to degradation of the membrane, membrane-electrode interface, or resulting from water management changes in the membrane due changes in the electrodes over time. Regardless, these changes are small compared to the observed changes in mass transport overpotentials. In all cases the mass transport losses increased; however, again they were the least impactful for the PSF-1.3 test, where limiting current decreased from ∼1.3 A cm−2 to ∼1.0 A cm−2 but losses below 0.6 A cm−2 remained relatively unchanged. In contrast, PSF-1.5 and PSF-1.7 showed dramatically increased mass transport losses at current densities as low as ∼0.2 A cm−2. Several factors may be responsible for the differences in observed performance. Degradation in the catalyst layer could lead to poisoning of catalyst or other losses of catalyst surface area, changes in the electrode structure/porosity/hydrophobicity, and/or changes in the membrane-electrode interface. The cyclic voltammograms shown previously in Figs. 5 and 6 demonstrate clear evidence that these electrodes underwent losses in ECSA, especially at the cathode electrodes. These factors could impact kinetics, water management, and mass transport overpotentials. For the differences between PSF-1.3 and the other two samples, both membrane thickness and swelling/water uptake may be key issues, as thinner membranes lead to higher water back diffusion and this may result in decreased electrode degradation rates, 19,51,52 and limited water uptake may result in improved membrane-electrode interfaces where improved, low resistance pathways between the membrane and electrode are maintained. 53 With additional tests, the relative importance of each of these areas can be better elucidated.

Figure 10. Polarization curves and HFR as function of current densities under H2/CO-free air condition for (a) PSF-1.7 (b) PSF-1.5 and (c) PSF-1.3. Before and after-test overpotential for the stability polarization curves with different membrane under H2/CO-free air condition are deconvoluted into their (i) kinetic, (ii) ohmic, and (iii) mass transport contribution. BoL refers to beginning of life. Both PSF-1.7 and PSF-1.5 stability tests failed catastrophically, thus labeled as EoL (end of life). PSF-1.3 was stopped due to station reason and therefore labeled as EoT (end of test).
Download figure:
Standard image High-resolution imageEx situ MEA characterization
To further probe the importance of electrode degradation in these studies, cross-sectioned MEAs were analyzed with TEM. A systematic series of TEM images of both PtRu/Vulcan anode (denoted as A) and Pt/Vulcan cathode (denoted as C) demonstrating the nanostructure of the as prepared MEA, and the tested MEAs' electrode layers after aging for 140 h (PSF-1.7140 h), 180 h (PSF-1.5180 h), 300 h (PSF-1.5300 h), and 540 h (PSF-1.3540 h) at 0.6 A cm−2 is shown in Fig. 11. TEM images of both higher and lower magnification (denoted as H and L, respectively) are included for a clearer demonstration of differences in the catalyst particle size and distribution, evolution of the carbon support, and porosity of the electrodes.

Figure 11. TEM cross-sections for the Pt/Vulcan cathode electrode layer (denoted as C) and PtRu/Vulcan anode electrode layer (denoted as A) at higher (denoted as H) and lower (denoted as L) magnifications for 1) pristine electrode, 2) PSF-1.7140 h,EoL, 3) PSF-1.5180 h,EoT, 4) PSF-1.5300 h,EoL, and 5) PSF-1.3540 h,EOT MEAs holding at 0.6 A cm−2.
Download figure:
Standard image High-resolution image
Pt/Vulcan cathode structure as a function of fuel cell operating time is shown in the upper portion of Fig. 11. Initially, the Pt catalyst nanoparticles appear to be homogeneously distributed on the available carbon support in the pristine MEA (Fig. 11, C-H1). The high-magnification images highlight Pt particle growth and agglomeration, as well as the carbon corrosion developed over the testing periods probed. These Figures are similar in initial and post-performance structure to what has been seen in traditional acidic polymer electrolyte fuel cells, 55 although the structural changes are greatly accelerated in the AEMFC samples. The morphological evolution of the stress driven Pt particle growth, agglomeration, and carbon corrosion are obvious for PSF-1.7140 h and PSF-1.5300 h, in which the cells failed catastrophically (Fig. 11, C-H2 and C-H4, respectively). Moderate structural changes are also found in PSF-1.5180 h and PSF-1.3540 h electrodes which still maintain reasonable performance when the test was stopped (Fig. 11, C-H3 and C-H5, respectively). A series of lower magnification TEM images for the Pt/Vulcan cathode electrode layers demonstrates a broader view of catalyst distribution, corroborating results obtained with higher magnification images. Consistently, the low-magnification images suggest that all cathodes undergo structural changes in Pt particle size and distribution as well as porosity. The observations are supported by the CV data presented in Fig. 5b where more than a 50% reduction in ECSA between PSF-1.5180 h and PSF-1.5300 h MEAs was observed.
TEM images of PtRu/Vulcan anodes at high and low magnifications (A–H and A–L, respectively) as a function of fuel cell operating time featuring various MEAs are shown in the lower section of Fig. 11. As seen in both low and high magnification TEM images, the anode electrodes do not show the significant structural changes, catalyst particle growth or carbon corrosion, witnessed in the cathodes. This result is also consistent with the CV and ECSA findings mentioned previously where ECSA of anode electrode for PSF-1.5 MEAs reduced relatively modestly compared to cathode electrodes. This indicates that the electrode structure is influenced more at cathode (more oxidizing and potentially drier) conditions than at anode (more reducing and potentially flooded) conditions. Whether this is due to the fact that water production occurs at the anode, resulting in a more hydrated environment, thus alleviating catalyst nanoparticle growth and carbon corrosion, differences in the potential and gas phase environment, or to the properties of the different catalyst (i.e. Pt/Vulcan compared to PtRu/Vulcan) requires further examination. The larger impact of carbon corrosion in alkaline media compared to what has been reported for acidic polymer electrolytes may at least in part be attributable to decreased thermodynamic stability of carbon at very high pH.
Conclusions
This study extends our understanding on spirocyclic copolymers in AEMFCs further to device level performance. Three spirocyclic copolymers AEMs with different IECs were prepared to investigate the properties and stability of this system; moreover, these AEMs were incorporated into fuel cells to evaluate initial performance and long-term stability. The AEMs were measured to have IEC values of 1.3, 1.5, and 1.7 mmol g−1 and under partially optimized RH, they demonstrated excellent initial performance exhibiting 1.16, 1.2 and 1.5 W cm−2 AEMFC peak power density at 60 °C under H2/O2, respectively and all reached approximately 0.7 W cm−2 under H2/CO-free air condition.
While PSF-1.7 MEAs showed the highest initial performance, multiple duplicate MEAs consistently suffered the fastest degradation and the cells failed catastrophically around 150 h of testing. PSF-1.5 MEAs demonstrated improved stability but performance still fell below 0.6 V within the first 300 h of testing. Combining ex situ measurements such as water uptake and swelling behavior, ECSA measurements from CO-stripping CV, deconvoluting polarization curves and TEM electrodes characterization techniques, it has been learned that PSF-1.7 MEAs experienced several sources of degradation including dramatically increased H2 crossover likely related to high water uptake. Deconvoluting polarization curves and TEM images suggest PSF-1.7 MEAs also experienced large kinetic and mass transport losses and structural changes in the cathode electrodes, with decreasing ECSA likely leading to compounding impacts of mass transport losses as well. PSF-1.5 MEAs did not show signs of H2 crossover, however, CV data reveals that a 50% reduction in ECSA at the cathode electrode was found from a MEA tested for 180 h to a MEA tested for 300 h. TEM confirms cathode electrodes undertake higher degree of structural changes than anode electrodes.
Cathode degradation has been identified as a critical factor to performance degradation, and water management from anode to cathode can be a major contributing factor. It was observed that lower IEC was beneficial to degradation, thus, to balance degradation and performance issues a much thinner PSF-1.3 AEM (10 vs 55 μm) was explored to offset concerns with lower water mobility at lower IEC. The PSF-1.3 MEA successfully demonstrated improved durability with only 0.07 mV h−1 (5% degradation over 540 h) and the smallest increases in overpotentials in all kinetic, ohmic, and mass transport regions. In addition, TEM images of the PSF-1.3 tested MEA also exhibited the least structural changes in the electrode layers.
The combination of cell performance, stability testing, and diagnostics presented in this paper has yet to be presented for AEMFCs. It is hoped that the findings presented will help enable further insight and improvements to AEMFC performance and durability.
Acknowledgments
The work was supported by the U.S. Department of Energy under Contract No. DE-AC36-08GO28308 with Alliance for Sustainable Energy, LLC, the Manager and Operator of the National Renewable Energy Laboratory. Funding provided by the U.S. Department of Energy Office of Energy Efficiency and Renewable Energy Fuel Cell Technologies Office. The views and opinions of the authors expressed herein do not necessarily state or reflect those of the United States Government or any agency thereof. Neither the United States Government nor any agency thereof, or any of their employees, makes any warranty, expressed or implied, or assumes any legal liability or responsibility for the accuracy, completeness, or usefulness of any information, apparatus, product, or process disclosed, or represents that its use would not infringe privately owned rights. The U.S. Government retains and the publisher, by accepting the article for publication, acknowledges that the U.S. Government retains a nonexclusive, paid-up, irrevocable, worldwide license to publish or reproduce the published form of this work, or allow others to do so, for U.S. Government purposes. We also like to thank Prof. John Varcoe for supplying the ETFE powder ionomers used in the electrodes. The authors would like to thank Dr. KC Neyerlin and Dr. Timothy Van Cleve for meaningful and enlightening discussions. Moreover, AYN, SM would like to thank Dr. Bryon Donohoe for microtome assistance before our microtome equipment was set up. Additionally, the authors like to acknowledged Dr. Guido Bender, Doug Wymore, and Chris Antunes for all of the laboratory and equipment supports.