
Abstract
Differential thermal analysis (DTA) and electrical conductivity calculated from AC impedance measurements are discussed for binary and ternary eutectics: (Li0.52Na0.48)2CO3 (LN) and (Li0.435Na0.315K0.25)2 CO3 (LNK), coexisting with nanosized CeO2 and ceria-based oxides such as CeO2:Sm3+(samarium doped ceria: SDC) particles prepared by the Pechini method. The influence of the surface properties of oxides with smooth surfaces, narrow particle size distributions, and large specific surface areas near the eutectic point is presented. The obtained DTA spectra indicate that the melting enthalpy disappeared in systems with a melt containing less than 30 vol% and 45 vol% LN and LNK eutectics, respectively. Sm3+ doping contributes to an increase in the electrical conductivity of the composites below the eutectic points of molten carbonate. The temperature dependence of the electrical conductivity for both binary and ternary eutectic carbonates coexisting with CeO2 and SDC at melt contents less than ca. 15 vol% does not indicate a remarkable change in conductivity in the temperature range near each eutectic point of molten carbonate. The low-temperature characteristics are significantly improved using nanosized ceria-based oxides because of non-frozen eutectics with a low molar enthalpy of fusion and limited solid-phase influence on ionic conduction.
Export citation and abstract BibTeX RIS

This is an open access article distributed under the terms of the Creative Commons Attribution 4.0 License (CC BY, http://creativecommons.org/licenses/by/4.0/), which permits unrestricted reuse of the work in any medium, provided the original work is properly cited.
At present, global warming and depletion of fossil fuels have become major global problems. There is a need for a highly efficient power generation device that does not emit greenhouse gases, such as carbon dioxide. The use of high-temperature fuel cells such as solid oxide fuel cells (SOFC) and molten carbonate fuel cells (MCFC) operating at high temperatures is advantageous, as these are highly efficient and do not require expensive precious metal catalysts, such as platinum, as electrode materials. 1 However, operation at high temperature leads to deterioration of the cell and is not suitable for long-term use. Therefore, to reduce the corrosion and improve the durability of the materials in the cell equipment, numerous studies have been performed on eutectic molten salt composites with fine powder at lower temperatures. Yttria-stabilized zirconia (YSZ) has been used as the electrolyte material for conventional SOFCs, but the operating temperature must be approximately 1273 K or higher to obtain sufficient electrical conductivity when YSZ is used as the electrolyte. For example, trivalent Sm- and Gd-doped ceria-based oxides (SDC or GDC) are of particular interest. 2 Ceria is known to have oxygen ion conductivity by doping with trivalent ions such as YSZ, and has sufficient oxygen ion conductivity even in the intermediate temperature range of 773–973 K. However, Ce4+ is easily reduced to Ce3+ under a H2 atmosphere and shows electronic conductance. 3 In addition, electronic conduction of SDC may be suppressed at intermediate temperatures with high fuel humidification in open circuit voltage (OCV) and ionic transference number measurements 4 ; consequently, its use as a single electrolyte in an intermediate temperature range is difficult.
In recent years, a solid oxide electrolyte/carbonate composite electrolyte obtained by adding a carbonate with an electron-insulating property to oxides has attracted attention. 5–9 In such a composite electrolyte, molten carbonate is used in an oxide-impregnated state, and an interface layer is formed between the solid oxide and the carbonate owing to the interaction in the solid/liquid interphase. The interface layer on the solid phase is considered to play an important role in improving the ionic conductivity; the behavior of the carbonate is considered to be different from that of bulk. 10–12 Ionic species such as H+, O2-, and CO3 2− are considered for ionic conduction in the ceria-based oxide/carbonate composite electrolyte, which shows high ionic conduction in the medium-temperature range (673–1023 K). Among these ionic species, H+ and O2− are considered to have ion conduction paths in the interface layer, and the mechanism of ion conduction, called the swing model or "gear" mechanism, was proposed. 13–15 These ionic conduction mechanisms provide a rational explanation for the improvement of ionic conduction.
The electrical conductivity, spectroscopy, durability, and application of materials of binary and ternary carbonates coexisting with highly insulating oxides have been investigated decades ago by numerous studies for research and development regarding materials utilizing molten carbonate fuel cells, 16 and more recently, by Nikolaeva et al. 17–19 , Cassir et al. 20,21 , Kandhasamy et al. 22,23 , as well as our group. 24–26 Because detailed reported research has been scarce regarding the state of carbonate at the interface in ceria-based oxides, further studies are needed on the behavior of carbonates on solid surfaces and the contributions of these interactions to ionic conduction at intermediate temperatures.
In this study, we evaluated the effect of the large specific surface area of nanosized ceria-based oxides such as CeO2 and SDC prepared by the Pechini method, which is a complex polymerization methods. 20,21,27,28 We then compared the results to the electrical conduction on the surface of the solid phase for systems using other oxides such as α-Al2O3 and γ-LiAlO2. 11 As eutectic carbonates, (Li0.52Na0.48)2CO3 and (Li0.435Na0.315K0.25)2 CO3 were used in the melt phase. We also measured the thermal properties and electrical conductivity of the oxide/carbonate composites to evaluate the ionic conduction and phase transition of ternary carbonate around its eutectic point. Finally, we discussed the influence of the solid phase in the intermediate temperature range.
Experimental
Preparation of eutectic carbonates
To obtain both binary and ternary carbonates, lithium carbonate (Li2CO3, Nacalai Tesque Inc.), sodium carbonate (Na2CO3: Kishida Chemical Co., Ltd.), and potassium carbonate (K2CO3: Nacalai Tesque Inc.) were used. The carbonates were separately dried for 48 h under a CO2 atmosphere at 473 K, and stored in a glove box under an Ar atmosphere. These carbonates were mixed to yield a eutectic carbonate composition of Li2CO3:Na2CO3 = 43:57 and Li2CO3:Na2CO3:K2CO3 = 32:35:33 in weight ratio, corresponding to (Li0.52Na0.48)2CO3 and (Li0.435Na0.315K0.25)2 CO3. 29,30 These carbonates are abbreviated as "LN" and "LNK" hereinafter. The eutectic points of LN and LNK are 771 K and 670 K and their densities are 2.32 g cm−3 and 2.30 g cm−3, respectively, which agree with previous data. 31
Preparation of CeO2 and SDC nanoparticles
Nanoparticles consisting of CeO2 and SDC were prepared by the identical procedure for Pechini method
20,21
as written elsewhere.
28
The procedure involved dissolving 0.5 mol L−1 of cerium nitrate hexahydrate; Ce(NO3)3・6H2O (Nacalai Tesque, Inc.) and, if necessary, 0.5 mol L−1 samarium nitrate hexahydrate; Sm(NO3)3・6H2O (Nacalai Tesque, Inc.) in deionized distilled water, along with a predetermined amount of citric acid (Nacalai Tesque, Inc.), aqueous solution, and ethylene glycol (Nacalai Tesque, Inc.). The molar ratio of citric acid to ceria-based oxides was 5:1. The reaction scheme for the metal-citrate complex is shown in Scheme

Scheme 1. Reaction of precursor of cerium-based oxide using cerium nitrate, citric acid and ethylene glycol by Pechini method.
Download figure:
Standard image High-resolution imageSpecific surface areas of CeO2 and SDC
To measure the specific surface area of the prepared sample, a high-speed specific surface area/pore distribution measuring device (NOVA-2200e Quantachrome, Inc., USA) was used, and nitrogen adsorption/desorption isotherms were measured at 77 K in a relative pressure range of 0.05–0.1. As a pretreatment of the sample, it was dried under vacuum at 473 K for 5 h. The specific surface area was determined by an analytical method based on the Brunauer–Emmett–Teller (BET) theory. 32
XRD measurements of ceria and SDC
X-ray diffraction (XRD) measurements were performed using a fully-automatic, multipurpose, horizontal, X-ray diffractometer (Rigaku Smart Lab). The apparatus was set up with 18 kW (under 45 kV and 400 mA) Cu rotating anticathode and double-reflection channel-cut Ge 220 monochromator for CuKα1. 33 The scanned angle ranged from 10° to 100° with a scan rate of 2.0° min−1 and a scan step of 0.01°.
The crystallite size, D, was calculated using Scherrer's equation as follows:

where K is the Scherrer constant,  is the X-ray wavelength, B is the full width at half maximum, and
  is the Bragg's angle. The crystallite size of these samples was approximately 10 nm; therefore, these samples were in a state close to a single crystal. In addition, a roughness factor, f, was calculated using the following equation:

where S is the specific surface area and r is the mean radius of the particle. Because the roughness factor of these samples is close to 1, the surface of the solid is smooth; therefore, we comprehensively investigated the influence of the interaction with oxides.
Preparation of oxide/carbonate composite samples
The oxide and each carbonate were mixed to obtain a predetermined melt content. The liquid fraction of the carbonate melt phase was determined using the following equation:

where VL and VS are the volumes of the liquid phase (carbonate) and solid phase (oxide), respectively. In this work, the VL and VS values were determined using the following equation:

where WL and ρL are the mass and density of the liquid phase, and WS and ρS are those of the solid phase, respectively. The densities of the molten carbonates greatly depend on the temperature. Therefore, as the density used in this calculation, the density of the salt in the solid state prepared at room temperature was used as a representative value, although it is possible to cite and apply values from the literature at each temperature
The apparent average thickness of the liquid phase, dL, was calculated using the following equation based on previous research. 34

TG-DTA measurements of oxide/carbonate composite samples
Thermogravimetry (TG)-differential thermal analysis (DTA) measurements were performed using a Rigaku ThermoPlus EVO2. A sample of approximately 10 mg in a 5 mm-diameter Au pan was analyzed under a CO2 atmosphere. The temperature range was 703–823 K with a sweep speed of 5 K min−1. In the calorimetric analysis using DTA, the value of endothermic peak obtained in the weight range without the influence of the heat flux was normalized according to the literature value 24,35 and the enthalpy of fusion of carbonate was calculated. 30,36 The enthalpy of fusion, ΔHm, was converted from the relative value of the measured endothermic peak using the literature values: 33.3 kJ mol−1 for pure LN and 27.6 kJ mol−1 for pure LNK 37,38
AC impedance measurements
The electrical conductivity of each sample was measured using the AC impedance method. First, the oxide powder and the individual carbonates weighed to a predetermined mixing ratio were thoroughly mixed using a mortar and pestle at ambient temperature in a glove box and molded into tablet-shaped samples using an alumina holder. The carbonate fraction varied from 5 to 45 vol. %. The mixed sample was pressed into a pellet (diameter = 15 mm) at 60 MPa for 30 min and preheated above each eutectic point of the carbonate under CO2 flow for 60 min. Figure 1 shows a schematic diagram of the conductivity cell in which the Au90-Pd10 alloy electrode was used. The complex impedance of the sample was measured using a Hewlett Packard 4284 A precision LCR meter in CO2 gas flow (0.1, 50 mL min−1), frequency range of 25 Hz–1 MHz, temperature range of 573–773 K, and applied voltage of 0.6 V. In addition, the ionic conductivity was measured during the heating process, and the Nyquist plot data were analyzed using impedance analysis software (ZView Version 3.1c).

Figure 1. A schematic drawing of a high temperature cell for the measurement of an ac impedance for oxide/carbonate composite samples.
Download figure:
Standard image High-resolution imageBecause the measured conductivity showed Arrhenius-type temperature dependence at temperatures above the transition point, the apparent activation energy of the electrical conductivity, ΔEa, was calculated using the Arrhenius equation:

where R is the gas constant and A is the pre-exponential constant. For the temperature dependence of the conductivity of LNK ternary carbonate coexisting with oxides, the activation energy was calculated using the following Vogel-Tammann-Fulcher (VTF) equation:

where T0 is the ideal glass transition temperature obtained by solving the non-linear least squares based on the temperature dependence of the conductivity using the Gauss-Newton algorithm, and A and B are constants.
Results and Discussion
Physical properties of CeO2 and SDC
The prepared CeO2 and SDC samples are spherical, monodispersed particles observed in the SEM and TEM images, as shown in Fig. 2. The physical properties of ceria-based oxides prepared by the Pechini method are shown in Table I. From the results of the diameter and the size distribution obtained from SEM and TEM images, although nanoparticles coagulated easily in the powder sample, each particle size (diameter) was observed carefully in the 1 μm2 area and their mean particle sizes were ca. 15–20 nm for each sample. The shape and particle size were not significantly influenced by the solid solution of Sm3+. The crystallite size of these samples was approximately 10 nm; therefore, these samples were in a state close to a single crystal. The roughness factor of each sample was less than 2, as shown in Table I, which agreed with the results of SEM and TEM observations that indicated CeO2 and SDC were well dispersed.
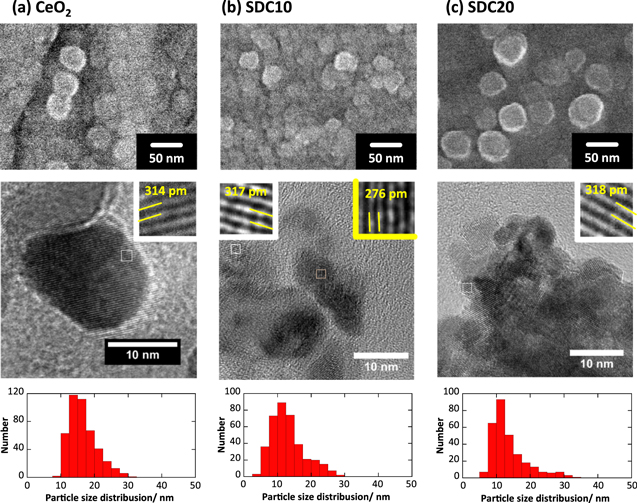
Figure 2. SEM and HRTEM images, and their size distribution of CeO2 and SDC samples. Sample: (a) CeO2, (b) SDC10, and (c) SDC20. Extended images for each sample are put in white inserted frame for 111 plane and in yellow inserted frame for 220 plane.
Download figure:
Standard image High-resolution imageTable I. Physical properties of ceria-based oxides prepared by Pechini method.
| Sample | Specific surface area/m2 g−1 | Crystallite size/nm | Density/g cm−3 | Mean diameter/nm | Roughness factor/- |
|---|---|---|---|---|---|
| CeO2 | 49.7 | 12.8 | 7.16 | 16.5 | 1.78 |
| SDC10 | 59.3 | 10.1 | 7.19 | 13.1 | 1.71 |
| SDC20 | 55.0 | 9.8 | 7.01 | 13.7 | 1.52 |
XRD measurements were performed to examine the crystal structures of the prepared CeO2 and SDC. Figure 3a shows the XRD measurement results for each sample. The diffraction pattern assigned to CeO2 indexed in ICDD PDF-4 database #34–0394 was confirmed for all the samples. 39 All oxides only exhibit the peaks of fluorite structure. In addition, all the Sm is doped in the CeO2 structure because the peak of Sm2O3 does not appear in the SDCs. Figure 3b shows the magnified diffraction patterns assigned to the 111 planes of CeO2, SDC10, and SDC20. In each diffraction pattern, it was confirmed that as the doping amount of Sm3+ increased, it shifted to the lower angle side. This is because the ionic radius of Sm3+ was larger than that of Ce4+, such that the interplanar spacing was widened, confirming that Sm3+ was appropriately doped according to Vegard's rule. 2

Figure 3. (a) XRD patterns and the assignment of each plane for CeO2 and SDC samples. (b) Values of d111 calculated from its peak in XRD patterns imposed in the figure.
Download figure:
Standard image High-resolution imageThermal properties of molten carbonate coexisting with SDC
Previously obtained results in composites using ceria with a surface area of only 1.5 m2 g−1 indicate that little influence of solids such as other oxides including Al2O3 and γ-LiAlO2 was found. 11 Since the sample prepared by the Pechini method has a large surface area ranging from ca. 50 to 55 m2 g−1, a more enhanced effect of solids was expected as compared to previously reported results.
The DTA curves at various melt contents in the ceria-based oxide/LN coexisting system are shown in Figs. 4a–4d. The intensity of the endothermic peak of the eutectic point of molten carbonate decreased considerably as the melt content decreased. The eutectic point of the pure LN binary carbonate was observed at 771 K, and the eutectic point was shifted toward a lower temperature by mixing with oxide. When the melt content was above 60 vol%, no remarkable change in the eutectic point of LN was observed. However, a significant decrease in the eutectic point was observed in the region of 60 vol% or less in all oxides. The endothermic peak associated with melting decreased as the melt content decreased, and finally disappeared at below 30 vol% or less. Upon comparing with previous results shown in Fig. 4d, 10 the molar enthalpy of fusion was observed even when the melt content was 5 vol%. Therefore, as the specific surface area increased, the influence of the specific surface area of the solid phase on the liquid phase changes. However, it is noteworthy that the area of influence is less than 1 nm.
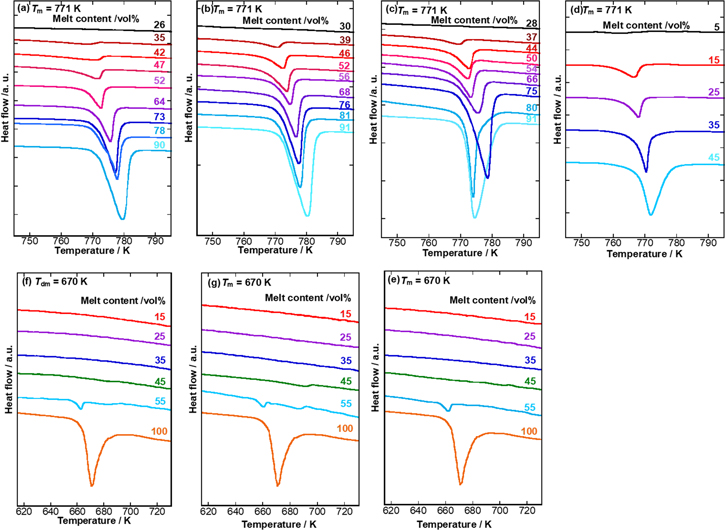
Figure 4. Variation of DTA curves of oxide/carbonate samples with their melt content. Carbonate melt: (a)–(d) LN and (e)–(g) LNK. Oxide: (a), (e) CeO2 (49.7 m2g−1 ), (b), (f) SDC10 (59.3 m2g−1 ), (c), (g) SDC20 (55.0 m2g−1), and (d) CeO2 (1.5 m2g−1).
Download figure:
Standard image High-resolution imageA similar decrease in the eutectic point was observed where the LNK ternary salt was used, and it was more remarkable than that of LN. The DTA curves of the coexisting systems of LNK and CeO2, SDC10, and SDC20 are shown in Figs. 4e–4g. For LNK samples, eutectic salts were prepared by the migration of three single salts; however, the migration of each salt may not be sufficient as a single phase of ternary salts appearing in the low-temperature range. In addition, the baseline of the DTA curves could be more unstable than in the LN sample, as coexistence with solids could result in gradual eutectic formation. From the viewpoint of phase transition in any system, the enthalpy change due to the melting of carbonate was not confirmed at the liquid phase volume fraction of 15–45 vol% but appeared slightly at 55 vol% for the LNK system. Compared with the results in Figs. 4a–4d for LN/oxide systems, it is considered that the change from binary system to ternary system has a high entropic effect, resulting in a change in the volume fraction of more than ca. 55 vol% of the liquid phase, where an endothermic peak appeared.
To estimate the extent of the effect of the solid phase in the liquid phase, the so-called "apparent average thickness" is introduced, as indicated in Eq. 5. It has a length dimension and represents the thickness of the liquid layer at the solid surface. The value of this parameter decreases with an increase in the surface area or a decrease in the volume of the liquid phase; both factors cause a relative increase in the liquid phase, which is influenced by the solid phase.
Figure 5 shows several parameters related to the thermal properties of the LN binary carbonate coexisting with CeO2, that is, a eutectic point (a) and molar enthalpy of fusion (b) with an apparent average thickness of the melt phase. The enthalpy of fusion of LN per unit area on the surface of CeO2 (49.7 m2g−1 ) is calculated from the results of Fig. 5b.
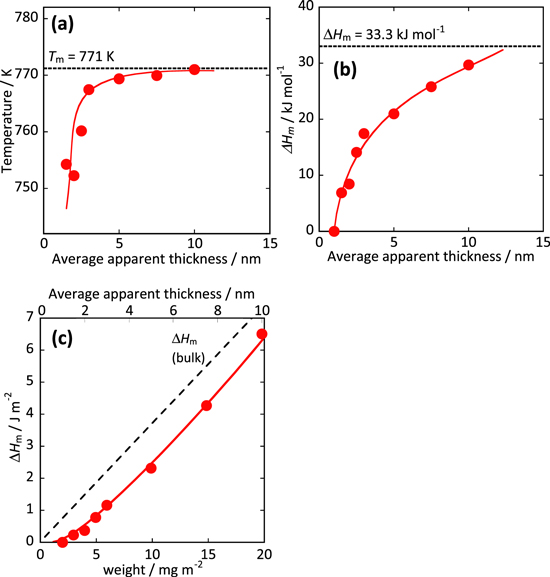
Figure 5. Variations of (a) eutectic point and (b) molar enthalpy of LN coexisting with CeO2 (49.7 m2g−1 ) with an apparent average thickness of the melt phase calculated by Eq. 5. (c) The enthalpy of fusion of LN per unit area on the surface of CeO2 (49.7 m2g−1 ) calculated from (b).
Download figure:
Standard image High-resolution imageThe apparent eutectic point abruptly decreased in the region of approximately 5 nm or less, as shown in Fig. 5a. This indicated that the molten carbonate in the vicinity of the solid oxide interacted strongly with the solid phase. The melting enthalpy (heat of fusion) with the apparent average thickness of the liquid phase was lowered from the original enthalpy value in the region where the thickness was approximately 10 nm or less, as the thickness of the liquid phase decreased. As the amount of carbonate increases, the value of the slope, which is the enthalpy of fusion, gradually approaches the bulk value, as shown in Fig. 5c. When the amount of carbonate was 1 mg m−2 or less, the slope value was almost zero. In other words, the enthalpy of fusion of carbonate near the solid oxide was zero, and the carbonate in the molten state near the solid was stabilized because of the suppression of crystallization associated with solidification and the disordered structure of the carbonate in the solidified state.
Temperature dependence of electrical conductivity of oxide/carbonate coexisting systems
The temperature dependence of electrical conductivity in the ceria-based oxide/LN coexisting system are shown in Figs. 7a–7d. The transition point due to melting of the eutectic carbonate was observed at approximately 720 K, which is 50 K lower than the normal eutectic melting point in the range of the melt content of approximately 25 vol% or more. The conductivity at a melt content of 45 vol% was smaller than at the value of 15–35 vol% in the region below the transition point. As the melt content increased, the bulk molten salt crystallized, and it is considered that the crystallized molten salt inhibited the electrical conduction pathway. In addition, at 15 vol%, the conductivity did not change remarkably in the temperature range around the eutectic point of molten carbonate, and there was no melting enthalpy change at 25 vol% or less. From these results, it is evident that the molten salt existing at the solid interface is in a molten state, even below the transition point.
Based on the discussion of the DTA curves, the temperature dependence of electrical conductivity is compared with the previous results for ceria-based oxide with the particle size of CeO2 (1.5 and 6.0 m2 g−1) of ca. 2.5 μm. 11 These results indicate that carbonates in the vicinity of the oxide interact with the ceria-based oxide, such that a part of them are in the "non-frozen region" below the transition point. However, the transition point was clearly observed in the Arrhenius plot for CeO2 (1.5 m2 g−1)/(Li0.52Na0.48)2CO3 (5 vol%), as shown in Fig. 6d. It is considered that molten carbonate coexists with the oxide; it has a large specific surface area and interacts with ceria-based oxides, such that the solid-liquid interaction contributes to the behavior of the carbonate on the solid surface and ionic conduction at intermediate temperatures.

Figure 6. Temperature dependence of electrical conductivity for oxide/ carbonate coexisting system. Carbonate: (a)-(d) LN and (e)–(g) LNK. Oxide: (a), (e) CeO2 (49.7 m2g−1 ), (b), (f) SDC10 (59.3 m2g−1 ), (c), (g) SDC20 (55.0 m2g−1), and (d) CeO2 (1.5 m2g−1).
Download figure:
Standard image High-resolution imageThe composite containing LNK ternary salts coexisting with oxides showed an obscure dependence on temperature in the measuring range around the eutectic point. As shown in Figs. 6e–6g), only a few inflection points due to melting of the molten salt were observed in the samples with a liquid volume fraction of 35 vol% or less. At temperatures below the inflection point, the conductivity of 55 vol% was lower than the value of 25–45 vol%. This is because no transition point is observed in the 25 and 35 vol% samples even below the normal eutectic point. This is because the carbonate is in a molten state, and ionic conduction is maintained even at low temperatures. In addition, transition points associated with melting were observed in LNK-SDC10 at a liquid volume fraction of 15–55 vol% and in LNK-SDC20 at 45 and 55 vol%.
In all systems, the transition point associated with the melting of carbonate was confirmed at approximately 645 K, which was shifted to a temperature lower than the melting point of the eutectic carbonate, similar to the measurement results of the thermal analysis, as shown in Fig. 4g. This suggests that ternary carbonate was greatly influenced by the solid phase. In addition, in the samples with a low liquid volume fraction, the temperature dependence of the electrical conductivity followed the VTF equation, and continuous bending is observed. 40,41 The bending is attributed to the influence of free volume, such as the increase in the viscosity of molten carbonate due to glass transition. Especially in the system of the LNK-SDC20 composite, it was shown that the temperature dependence of the VTF type with strong bending and the increase in To was accompanied by an increase in the doping amount of Sm3+. 40
Figure 7 shows the variations in the apparent activation energy (ΔEa) of the electrical conductivity with the apparent average thickness of the melt phase above the eutectic point of carbonate coexisting with oxide. The activation energy, ΔEa, increased as the apparent average thickness decreased, and increased sharply in the region where the apparent mean thickness was approximately 0.5 nm or less. As shown in Fig. 7b, the degree of anomalous behavior of the molten carbonate by the solid phase has been observed; CeO2 and SDCs are smaller than the matrix material of the conventional MCFC, such as α-Al2O3 and γ-LiAlO2. Carbonate was significantly affected by solids in a very narrow range, suggesting that the ceria-based oxide did not inhibit ion transfer in the interfacial layer.
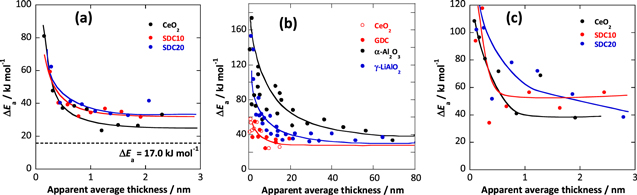
Figure 7. Variations of an apparent activation energy, ΔEa of the electrical conductivity with apparent average thickness of melt phase above the eutectic point of carbonate coexisting with oxide. Carbonate: (a), (b) LN and (c) LNK. Oxide: (a), (c) CeO2 (49.7 m2g−1 ), SDC10 (59.3 m2g−1 ), and SDC20 (55.0 m2g−1). (b) Reference data indicated in previous study. 10
Download figure:
Standard image High-resolution imageComposition dependence of conductivity for nanoparticle oxide/carbonate composites
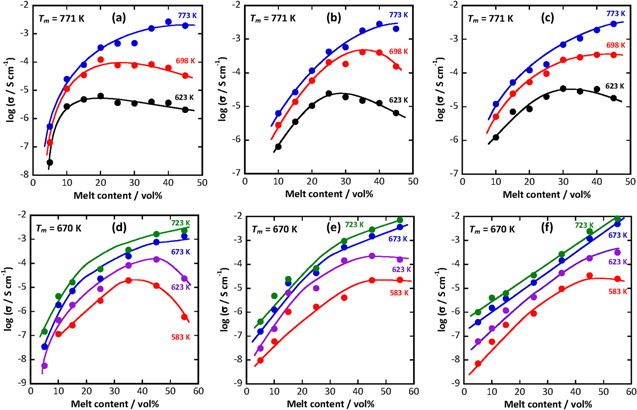
Figure. 8 shows the variation in electrical conductivity for the LN binary salt (a–c) and LNK ternary salt (d–f) coexisting with ceria-based oxides around their eutectic points. In the case of LN at 773 K, because all the carbonates are in the molten state, the conductivity improves as the amount of liquid phase increases in all these oxides. In contrast, below the eutectic point (698 K), SDC10 has a maximum value of ca. 35 vol% in Fig. 8b, such that the electrical conductivity is influenced by the Sm content of the coexisting solid oxide. This is consistent with the previous result for the composite material coexisting with SDC and NK binary salts determined by Raman spectroscopy. 6,8 When the liquid phase volume fraction is high, a large amount of bulk carbonate is present, and in the region below the eutectic point, many parts are crystallized. However, the conductivity increases with a decrease in the liquid phase, and even the ionic carrier decreases. The interphase region, including surface non-frozen carbonate and defects (dopant ion or VO ・・) in the oxide, might contribute to the acceleration of ionic migration. The melt content of 35 vol% is ca. 1.5 nm in terms of apparent average thickness. Therefore, it is considered that SDC10 contributes to the carbonate present in the region where the liquid layer is ca. 1.5 nm. Figures 8d–8f shows changes in the conductivity of oxide/LNK ternary carbonate at various temperatures depending on the liquid volume fraction. At 673 K and 723 K, all carbonates were in a molten state, such that the conductivity increased as the amount of liquid phase increased in all these systems owing to the increase in the number of carrier ions in the electrolyte. However, at temperatures below the eutectic point (623 K and 583 K), the maximum conductivity was confirmed. In LNK-CeO2, the maximum values appeared at 623 K at 45 vol% and 583 K at 35 vol%. Ionic conduction was impeded in such a coagulated region, and the ions melted even at low temperatures at the solid-liquid interface. It is hypothesized that the conductive region moves near the solid phase, the region in the molten state is maintained at a lower temperature range, the conductivity increases, and the conductivity reaches a maximum.
Figure 8. Variations of electrical conductivity with the melt content around the eutectic point of carbonate coexisting with oxide. Carbonate: (a)–(c) LN and (d)–(f) LNK. Oxide: (a), (d) CeO2 (49.7 m2g−1 ), (b), (e) SDC10 (59.3 m2g−1 ), and (c), (f) SDC20 (55.0 m2g−1).
Download figure:
Standard image High-resolution image
It is also hypothesized that the conductivity decreases because the number of carrier ions decreases and the conduction path is interrupted when the solid phase is further increased. However, in LNK-SDC10 and LNK-SDC20, ions do not move easily even if the solid phase is increased owing to the effect of the free volume of the molten carbonate due to the glass transition. The conductivity does not increase significantly, whereas maximum values are observed in the LNK-CeO2 system, as shown in Fig. 8d. In addition, considering the position of the maximum point shifts to a larger liquid phase volume fraction with the increase in Sm3+ content, as shown in Figs. 8e and 8f, it is suggested that the conduction phenomenon is conjugate in the interphase region between carbonate and oxide as discussed previously 13–15 and is enhanced by the Sm3+ content of the coexisting solid oxide.
Conclusions
Carbonate coexisting with ceria-based oxides, with a smooth surface and large specific surface area produced by the Pechini method, was strongly influenced by solid-liquid interactions. To study the surface structure of oxides, it is important to discuss the interface interactions in ceria-based oxide or for a binary carbonate (Li0.52Na0.48)2CO3 and ternary carbonate (Li0.435Na0.315K0.25)2CO3 coexisting system.
As the amount of carbonate coexisting with the ceria-based oxide decreases, the enthalpy of fusion gradually decreases owing to the solid-liquid interaction, and finally disappears. From the relationship between the amount of carbonate present on the unit surface area of the solid oxide and the enthalpy of fusion, the melting enthalpy of the carbonate in the vicinity of the solid is the minimum in the coexisting system of SDC10; hence, it is considered that SDC10 has the maximum interaction with carbonate. For the system containing LNK, the influence of the solid phase was remarkable. The melting enthalpy of carbonate mostly disappeared when the liquid phase volume fraction was less than 45 vol% and the molar enthalpy of fusion also decreased considerably.
In the results for the temperature dependence of electrical conductivity in coexistent systems, when the conductivity of the melt content of 45 vol% was smaller than the value of 15–35 vol%, because bulk carbonate exists in the crystalline state, electrical conduction was suppressed in the region below the inflection point. At 15 vol%, there was no remarkable change in conductivity even before and after the inflection point, and there was no melting enthalpy change at 25 vol% or less. The activation energy greatly increased in the region where the apparent average thickness was approximately 0.5 nm or less, the carbonate was significantly affected by the solid phase in a very narrow region, and the ceria-based oxide causes ion migration in the interphase layer. These results indicate that the low-temperature characteristics are remarkably improved, although the influence of the solid phase on the ionic conduction is limited.
This study was presented in PRiME2020 (the 238th ECS Meeting) and was partially published in its proceedings. 42