
Abstract
Polymer electrolyte membrane fuel cells (PEMFCs) are efficient, zero-emission engines for the automotive sector. However, cost and durability are major barriers for the commercialization of PEMFCs. Degradation of the carbon support in the cathode catalyst layer due to high potential excursions caused by unmitigated events like H2 starvation, or start-up/shutdown are still a major durability issue in PEMFCs. Catalyst support durability was studied by accelerated stress tests (ASTs) that included repeated potential cycling from 1.0 to 1.5 V. The effect of catalyst layer composition on carbon corrosion was studied using membrane electrode assemblies with different catalysts (Pt, PtCo), catalyst composition (catalyst wt.%, supports), ionomer composition (loading, and equivalent weights). The corrosion of the carbon support is similar between Pt and PtCo catalysts. However, the performance degradation rate is higher for the alloy catalysts due to differences in catalyst particle size and the transition metal's leaching accelerating the performance degradation. The carbon loss is lower for catalysts with lower initial carbon loading (or higher catalyst wt.%), which is better for durability. However, the cumulative loss of carbon is identical for electrodes with the same catalyst support irrespective of catalyst and ionomer composition in the catalyst layer.
Export citation and abstract BibTeX RIS

This is an open access article distributed under the terms of the Creative Commons Attribution 4.0 License (CC BY, http://creativecommons.org/licenses/by/4.0/), which permits unrestricted reuse of the work in any medium, provided the original work is properly cited.
Polymer electrolyte membrane fuel cells (PEMFCs) are a major candidate to replace the internal combustion engine for achieving zero-emissions in the automotive sector. However, the cost and the durability of the PEMFC system constitute a significant barrier towards the commercialization of PEMFC vehicles. 1 The U.S. DOEs durability targets are 8000 h for light-duty vehicles and 30,000 h for heavy-duty vehicles. Hence, research in the past decade has focused on understanding the causes of degradation in PEMFCs and mitigating them by either material solutions or system engineering solutions. Conventional PEMFC catalysts consist of platinum (Pt) or Pt-alloys supported on various carbon supports like Vulcan, high surface area carbon (HSAC), and graphitized or low surface area carbon (LSAC). 2 HSAC support is preferred for cathode catalysts due to its superior catalyst particle dispersion and associated high catalyst electrochemical surface area, high porosity, catalyst distribution on both the surface and insides of the support mesopores preventing ionomer poisoning of catalyst particles inside those pores, and high electronic conductivity. 3–5 However, HSAC is more prone to carbon corrosion due to higher defect sites than Vulcan or graphitized carbon.
Electrochemical oxidation of carbon support due to carbon corrosion is a key reason for the cathode catalyst layer's degradation. The presence of Pt and ionomer dispersion on the carbon surface may increase carbon corrosion rates. 6,7 Under fuel starvation conditions at the anode or in start-up/shutdown processes, an air-air operation shifts the anode potential from the reference potential of 0 V, increasing the cathode potential above 1.2 V. 8–13 The high potential excursion on the cathode accelerates the carbon support corrosion to carbon dioxide by reverse current mechanism. 14,15 Follow-on publications expanded on this initial research to measure the actual current distributions, anode and cathode potential profiles, local CO2 emission rates and spatial degradation. 10,16–18 The reverse current mechanism can be suppressed by the use of a hydrogen purge 19 or by other engineering strategies such as voltage limitations. 20 Carbon support corrosion can lead to a loss of electrode porosity and a collapse in secondary pore structure to i) thinning of the catalyst layer, ii) change in ionomer distribution and iii) reduction in percolation of the carbon support leading to a loss in electrical contact. 13,21,22 During high potential events, the carbon support corrodes and can cause catalyst particle detachment, which can generate electrical isolation of the catalyst particles. The catalyst particles can either be separated from the support or buried inside carbon aggregates, resulting in a decrease in electrochemical surface area (ECSA) and loss in fuel cell performance. Carbon oxidation also increases the hydrophilicity of its surface, causing a reduction in the gas permeability leading to fuel cell mass transport voltage losses. 9 To study the effect of carbon support durability independent of the catalyst, protocols have been developed that probe the stressor for the carbon support stability without degradation of the catalyst particles. 23 Researchers have calculated carbon corrosion rates from CO2 and CO concentrations in the cathode exhaust. 8,24 The results of the experiments showed that carbon corrosion rates are higher under dynamic operation.
In state of the art (SOA) electrodes, the cathode catalyst often comprises of Pt particles alloyed with transition metals (Co, Ni, Zn) due to their higher oxygen reduction reaction (ORR) activity compared to Pt. 25–28 With the addition of transition metal, the fuel cell performance degradation is accelerated due to transition metal leaching during PEMFC operation. A transition metal cation can ion-exchange with the ionomer in the catalyst layer leading to reduced ionomer water uptake, lower proton conductivity, and higher local O2 transport resistance. 29–32 During operation, cation migration leads to a higher concentration of the transition metal in the cathode catalyst layer, which severely affects fuel cell performance. 33,34 From catalyst degradation accelerated stress tests (AST) and simulated drive cycle studies, a significant loss in high current density performance of PtCo catalysts has been attributed to the leaching of Co causing a loss in ORR activity and the Co ion-exchanging into the ionomer leading to increased O2 transport resistance in addition to ECSA losses resulting from particle size increases. 29,35,36 Prior experiments have shown that Co leaching from PtCo catalyst occurs at all relevant potentials in an operating PEMFC, and the amount of Co leached has a strong correlation to the upper potential voltage experienced by the cathode. 29,37 To examine carbon corrosion, various ASTs have been employed including 1.2 V holds, square wave cycling from 0.9–1.3 V and triangular wave cycling from 1.0–1.5 V. 35,38 With the carbon support AST involving cycling the cathode between 1 V to 1.5 V, there is expected to be significant leaching of the transition metal from the alloy catalyst.
In this paper, the effect of catalyst layer composition on carbon support durability is reported. Two different ASTs (potential cycling between 1.0 V to 1.5 V at 500 mV s−1 and constant potential holds for 5 s at 1 V and 1.5 V) were performed to simulate the effect of repeated startup-shutdown cycles on carbon support stability. Polarization curves, electrochemical impedance spectroscopy (EIS), ECSA, mass activity, and carbon loss (measured CO2 at cathode outlet) were assessed during AST cycling. To understand the effect of membrane electrode assembly (MEA) constituents on carbon support durability, MEAs with different cathode catalysts (Pt vs Pt alloy), various carbon supports, catalyst wt.%, cathode catalyst loading, ionomer EWs, and ionomer loading were studied. Catalyst layer thickness and catalyst particle size distributions were measured at the beginning of life and end of life and correlated to the performance loss observed. Computational modeling of the electrochemical performance was performed to analyze and estimate the different overpotential losses. The computational model shows a decrease in ORR kinetics for the alloy catalyst during cycling and an increase in O2 transport resistance due to electrode compaction.
Experimental
Membrane electrode assembly
In this study, nine different membrane electrode assemblies (MEAs) were fabricated with different cathode Pt loading, Pt composition, carbon supports, and ionomer compositions. The specification of the MEAs fabricated and the MEA identifiers are listed in Table I. The MEAs with identifiers PtXX/Y or PtCoXX/Y, where XX is the total metal wt.% and Y is the type of carbon support, were fabricated by Umicore (Germany) with a cathode loading of 0.1 mg cm−2. Pt (Pt30/H) and PtCo (PtCo30/H) catalyst with high surface area carbon (HSAC) support and similar total metal wt.% was used to understand the influence of alloy transition metal on support durability. Similar Pt wt.% with lower surface area carbon (LSAC) support was used to elucidate the stability of different carbon supports. Two different metal wt.% (30 and 50) of the PtCo catalyst was used to study the effect of the catalyst/carbon wt.% on carbon support durability. The anode consisted of 20 wt.% Pt on graphitized carbon (ElystPt200380) with a loading of 0.1 mg cm−2. NafionTM HP was used as membranes for MEAs with identifier PtXX/Y or PtCoXX/Y. MEAs with the identifiers H-# or G-#, where # is the MEA number, were fabricated with either Pt or PtCo catalyst with different catalyst loading, I/C ratio, equivalent weight (EW), and carbon type to study their effect on support durability. The anode was fabricated with a loading of 0.05 mg cm−2. The gas diffusion layer on both anode and cathode in all MEAs was 29 BC (SGL Carbon).
Table I. Specification of Pt loading and support used in this study.
| MEA | Cathode Catalyst | Cathode | ||||||
|---|---|---|---|---|---|---|---|---|
| Pt loading (mgPt cm−2) | Carbon loading (mgC cm−2) | Pt wt.% | Co wt.% | Support | Ionomer EW (g/mol) | Ionomer to carbon (IC) ratio | ||
| PtCo30/H | ElystPt300670 | 0.1 | 0.25 | 27.5 | 2.5 | HSAC | 1100 | 0.83 |
| Pt30/H | 30PtA9029X | 0.1 | 0.23 | 30 | — | HSAC | 1100 | 0.77 |
| Pt20/L | ElystPt200380 | 0.1 | 0.23 | 20 | — | LSAC (Graphitized carbon) | 1100 | 0.77 |
| PtCo50/H | ElystPt500670 | 0.1 | 0.11 | 45 | 5 | HSAC | 1100 | 0.95 |
| H-1 | * | 0.25 | 0.25 | 50 | — | HSAC | 790 | 1.1 |
| H-2 | * | 0.15 | 0.35 | 30 | — | HSAC | 790 | 1.1 |
| H-3 | * | 0.15 | 0.15 | 50 | — | HSAC | 830 | 0.8 |
| H-4 | * | 0.15 | 0.35 | 30 | 5 | HSAC | 800 | 1.1 |
| G-5 | * | 0.15 | 0.15 | 50 | — | Graphitized carbon | 1100 | 0.86 |
Testing protocols
The MEAs, with the identifier PtXX/Y and PtCoXX/Y, were tested in fuel cell hardware with a single serpentine flow channel and a 50 cm2 active area. The cell was operated at 80 °C, 150kPa outlet pressure, and 100% RH unless stated otherwise. The anode and cathode stoichiometries were 1.5 and 2.0, respectively. The MEAs were conditioned by cycling from 0.9 V to 0.6 V 10 times at 100% RH followed by 5 cycles of 0.9 V to 0.6 V at 32% RH and another 10 cycles at 100%RH. After cycling, the MEA was held at constant voltage at 0.6 V for 2 h when colling the cell temperature to 30 °C while continuing to hold at 0.6 V for additional 2 h. The polarization curves were recorded by stepping the potential from open circuit voltage to 0.2 V in 20 steps with a 30 s potential hold at each step. Hydrogen and air were supplied to anode and cathode, respectively, during polarization curve measurement. Electrochemical impedance spectra were obtained at the same conditions as the polarization curve in galvanostatic mode at the reported current density at an amplitude of ± 10 mA. The carbon support corrosion AST was performed by scanning from 1 V to 1.5 V at a rate of 500 mV s−1, as shown in Fig. 1a. This AST will be referred to as the triangle wave AST in this paper. During the AST, H2 and N2 were supplied to anode and cathode respectively. The MEAs were characterized (polarization curve, mass activity, ECSA) at the beginning of life (BOL), 10, 100, 200, 500, 1000, 2000, and 5000 cycles. ECSA was estimated using cyclic voltammetry (CV) with H2 and N2 gas at anode and cathode, respectively, at a scan rate of 25 mV s−1 from a voltage of 0.1 V to 1.0 V. End of life (EOL) is determined when the loss in ECSA is greater than 50%; otherwise, the cycling was continued to 5000 cycles. Electrochemical impedance spectroscopy was measured at BOL and EOL with air and HelOx. During the CO2 measurements discussed in the next section, the AST protocol was modified to include a 1.2 V hold for 2 h, followed by 1200 cycles of 1 V to 1.5 V cycling at a scan rate of 500 mV s−1.
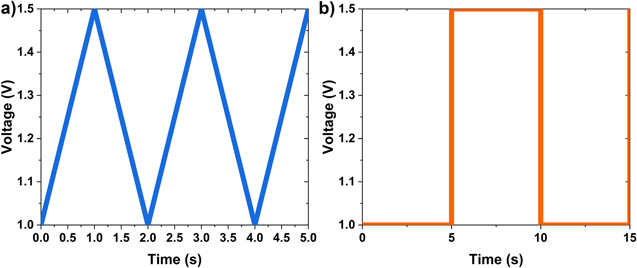
Figure 1. Accelerated test protocols used in this study. (a) Continuous cycling between 1 V to 1.5 V at 500 mV s−1 (triangle wave AST) and (b) constant potential holds for 5 s at 1 V and 1.5 V (square wave AST).
Download figure:
Standard image High-resolution imageThe MEAs, with the identifier H-# and G-#, were tested in rectangular shaped fuel cell hardware, with straight and parallel channel anode and cathode flow fields with an active area of 40 cm2. The cell was operated at 70 °C, 150kPa, and 100% RH unless stated otherwise. The MEA was first conditioned under constant current density of 17 A cm−2 for 12 h with the H2 and air flow rate of 2 and 12 lPM, respectively. The AST was performed by repeated cycling of holding the voltage at 1 V for 5 s, followed by 1.5 V hold for 5 s, as seen in Fig. 1b. This AST will be referred to as square wave AST in this paper. Electrochemical performance, the voltage at 1.7 A cm−2 and ECSA, were recorded every 100 or 500 cycles. ECSA was estimated using CV with H2 and N2 gas at anode and cathode, respectively, at a scan rate of 20 mV s−1 from a voltage of 0.05 V to 0.6 V. The end of life was determined when the voltage difference from the BOL at 1.7 A cm−2 was more than 400 mV or 2000 cycles.
Carbon corrosion characterization
To measure the carbon corrosion rate, carbon loss was estimated by measuring the CO2 concentration using a non-dispersive infrared (NDIR) gas analyzer (603D, California Analytical Instruments). The NDIR was connected to the cathode exhaust after a water trap to remove the exhaust water before measuring the CO2 concentration. The NDIR was calibrated every week using nitrogen and a reference CO2 gas.
Membrane electrode assembly characterization
Cross sections of the MEAs were prepared at BOL and EOL by diamond knife ultramicrotomy. After embedding the MEAs in epoxy, 75 nm thick cross sections were cut and mounted onto Cu grids. Images for assessing electrode thinning were taken by scanning electron microscopy (SEM) on a Hitachi S4800 SEM equipped with a cold field emission gun. Transmission electron microscopy (TEM) for particle size measurements was performed on a Hitachi HF300 TEM/STEM. Particle sizes were measured manually from bright-field TEM images.
Results and Discussion
Effect of Pt alloy on carbon support durability
Fuel cell performance change during the triangle wave AST protocol (Fig. 1a) is shown in Fig. 2. The polarization curve recorded at the beginning of life (BOL) and after the 1000th cycle for catalyst with 30 wt.% total metal content (PtCo30/H, Pt30/H, Pt20/L) is shown in Fig. 2a. Polarization curves at different cycles during the AST for PtCo30/H, Pt30H, and Pt20/L is shown in Fig. S1 (available online at stacks.iop.org/JES/168/044502/mmedia). BOL performance of the alloy catalyst (PtCo30/H) is significantly higher than that of the electrode with the Pt catalyst on the same support (Pt30/H) in the kinetic region (∼0.85 V), as oxygen reduction reaction (ORR) activity of the Pt alloy catalyst is higher, but the gain is lost at high current density (0.3 V) due to transport limitations, as seen in Fig. 2b. PtCo30/H shows the highest performance loss after 1000 cycles, followed by Pt30/H and Pt20/L. The low current density performance benefit for PtCo30/H at BOL decreases during the AST cycling, with similar trends at 0.67 V, probably due to Co leaching over time. The decay in the performance of PtCo30/H is faster compared to Pt30/H; by the 1000th cycle, the performance of Pt30/H is higher than PtCo30/H. Although the starting particle sizes of Pt30/H and PtCo30/H, are different Pt (3.5 nm) and PtCo (4 nm), their growth is similar during the AST, see Fig. S2. Therefore, Co leaching out from the alloy catalyst is the primary reason for the accelerated performance degradation in the kinetic regions of the PtCo catalyst compared to the Pt catalyst during AST cycling. Moreover, the high-frequency resistance doesn't change significantly, suggesting the cation remains in the CL, possibly due to cation migration driven by the ionic potential gradient during operation. 33 The catalyst with the low surface area (LSAC) support (Pt20/L) shows the lowest initial kinetic performance but minimal performance loss even after 5000 cycles. It should also be noted that LSAC support is highly graphitized with lower defect sites compared to HSAC support, which makes it resistant to carbon corrosion and hence the most stable performance.
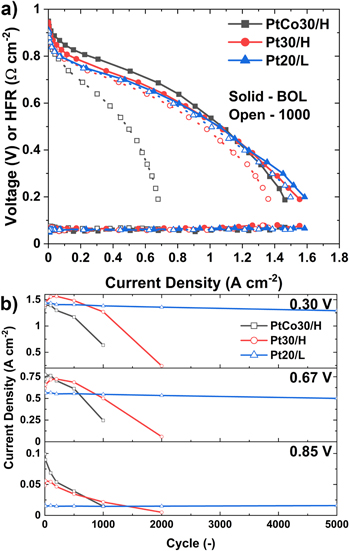
Figure 2. Performance change of PtCo30/H, Pt30/H, and Pt20/L during triangle wave AST cycling. (a) Polarization curve at BOL and 1000 cycles and (b) the current density at 0.85 V, 0.67 V, and 0.30 V. The cell was operated at 80 °C, 150 kPa, and 100%RH.
Download figure:
Standard image High-resolution imageThe loss in ECSA for PtCo30/H, Pt30/H, and Pt20/L during the AST cycling is shown in Fig. 3a. The ECSA loss rate is similar between PtCo30/H and Pt30/H, while the rate is lowest for LSAC support. The catalyst particle size changed from an average of 3.5 nm to 4.2 nm after 2000 cycles for Pt30/H, while for PtCo30/H, the particle size grew from 4 nm to 4.8 nm in 1000 cycles, as shown in Fig. S2a. The ECSA difference at BOL for the Pt30/H and PtCo30/H is probably due to the initial particle size difference. The contribution of ECSA loss due to increased catalyst particle size is minimal compared to the catalyst particle detachment from the support after its corrosion. It is further worsened by the catalyst layer's collapse, burying some catalyst particles and rendering them inactive. Hence, the minimal loss in ECSA for catalyst with LSAC support, Pt20/L, where lowest carbon corrosion and almost no loss of the catalyst layer thickness was observed, see Fig. 4. This is also consistent with the minimal loss in mass activity even after 5000 cycles of triangle wave AST for Pt20/L, see Fig. 3b. Pt20/L shows a lower mass activity compared to Pt30/H, which is consistent with kinetic performance observed in Fig. 2, probably due the uneven distribution of larger particles on the graphitic carbon substrate. In contrast, Pt30/H and PtCo/H have evenly distributed catalyst particles that provide the higher ECSA. The mass activity loss for Pt30/H is due to the loss in ECSA, as explained before. PtCo30/H shows the highest mass activity because of the kinetic activity enhancement provided by alloying. However, the relative loss in mass activity is higher than Pt30/H, even when the ECSA loss rate is similar, due to Co leaching from the catalyst particle as the Pt:Co ratio changes from 76:24 to 84:16 at BOL and EOL, respectively, changing the intrinsic activity of the catalyst explained using computational model in later sections.

Figure 3. Change in (a) ECSA and (b) mass activity during the triangle wave AST cycling for PtCo30/H, Pt30/H, and Pt20/L.
Download figure:
Standard image High-resolution image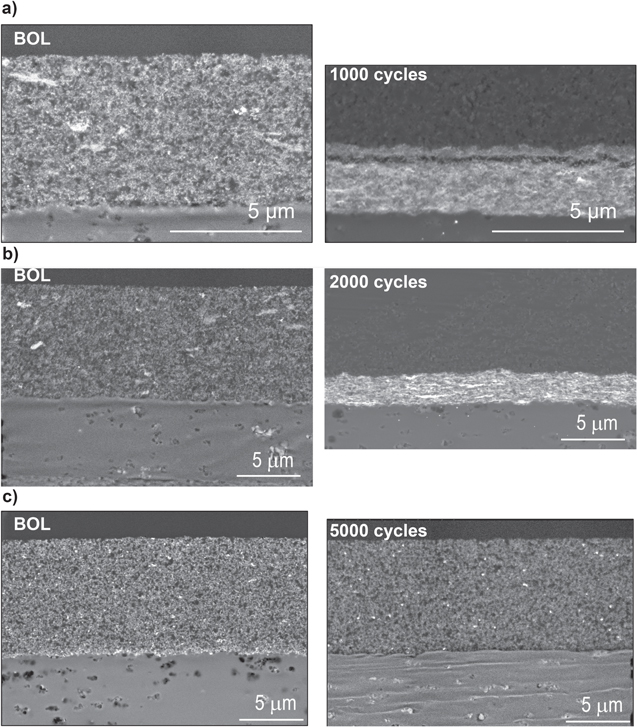
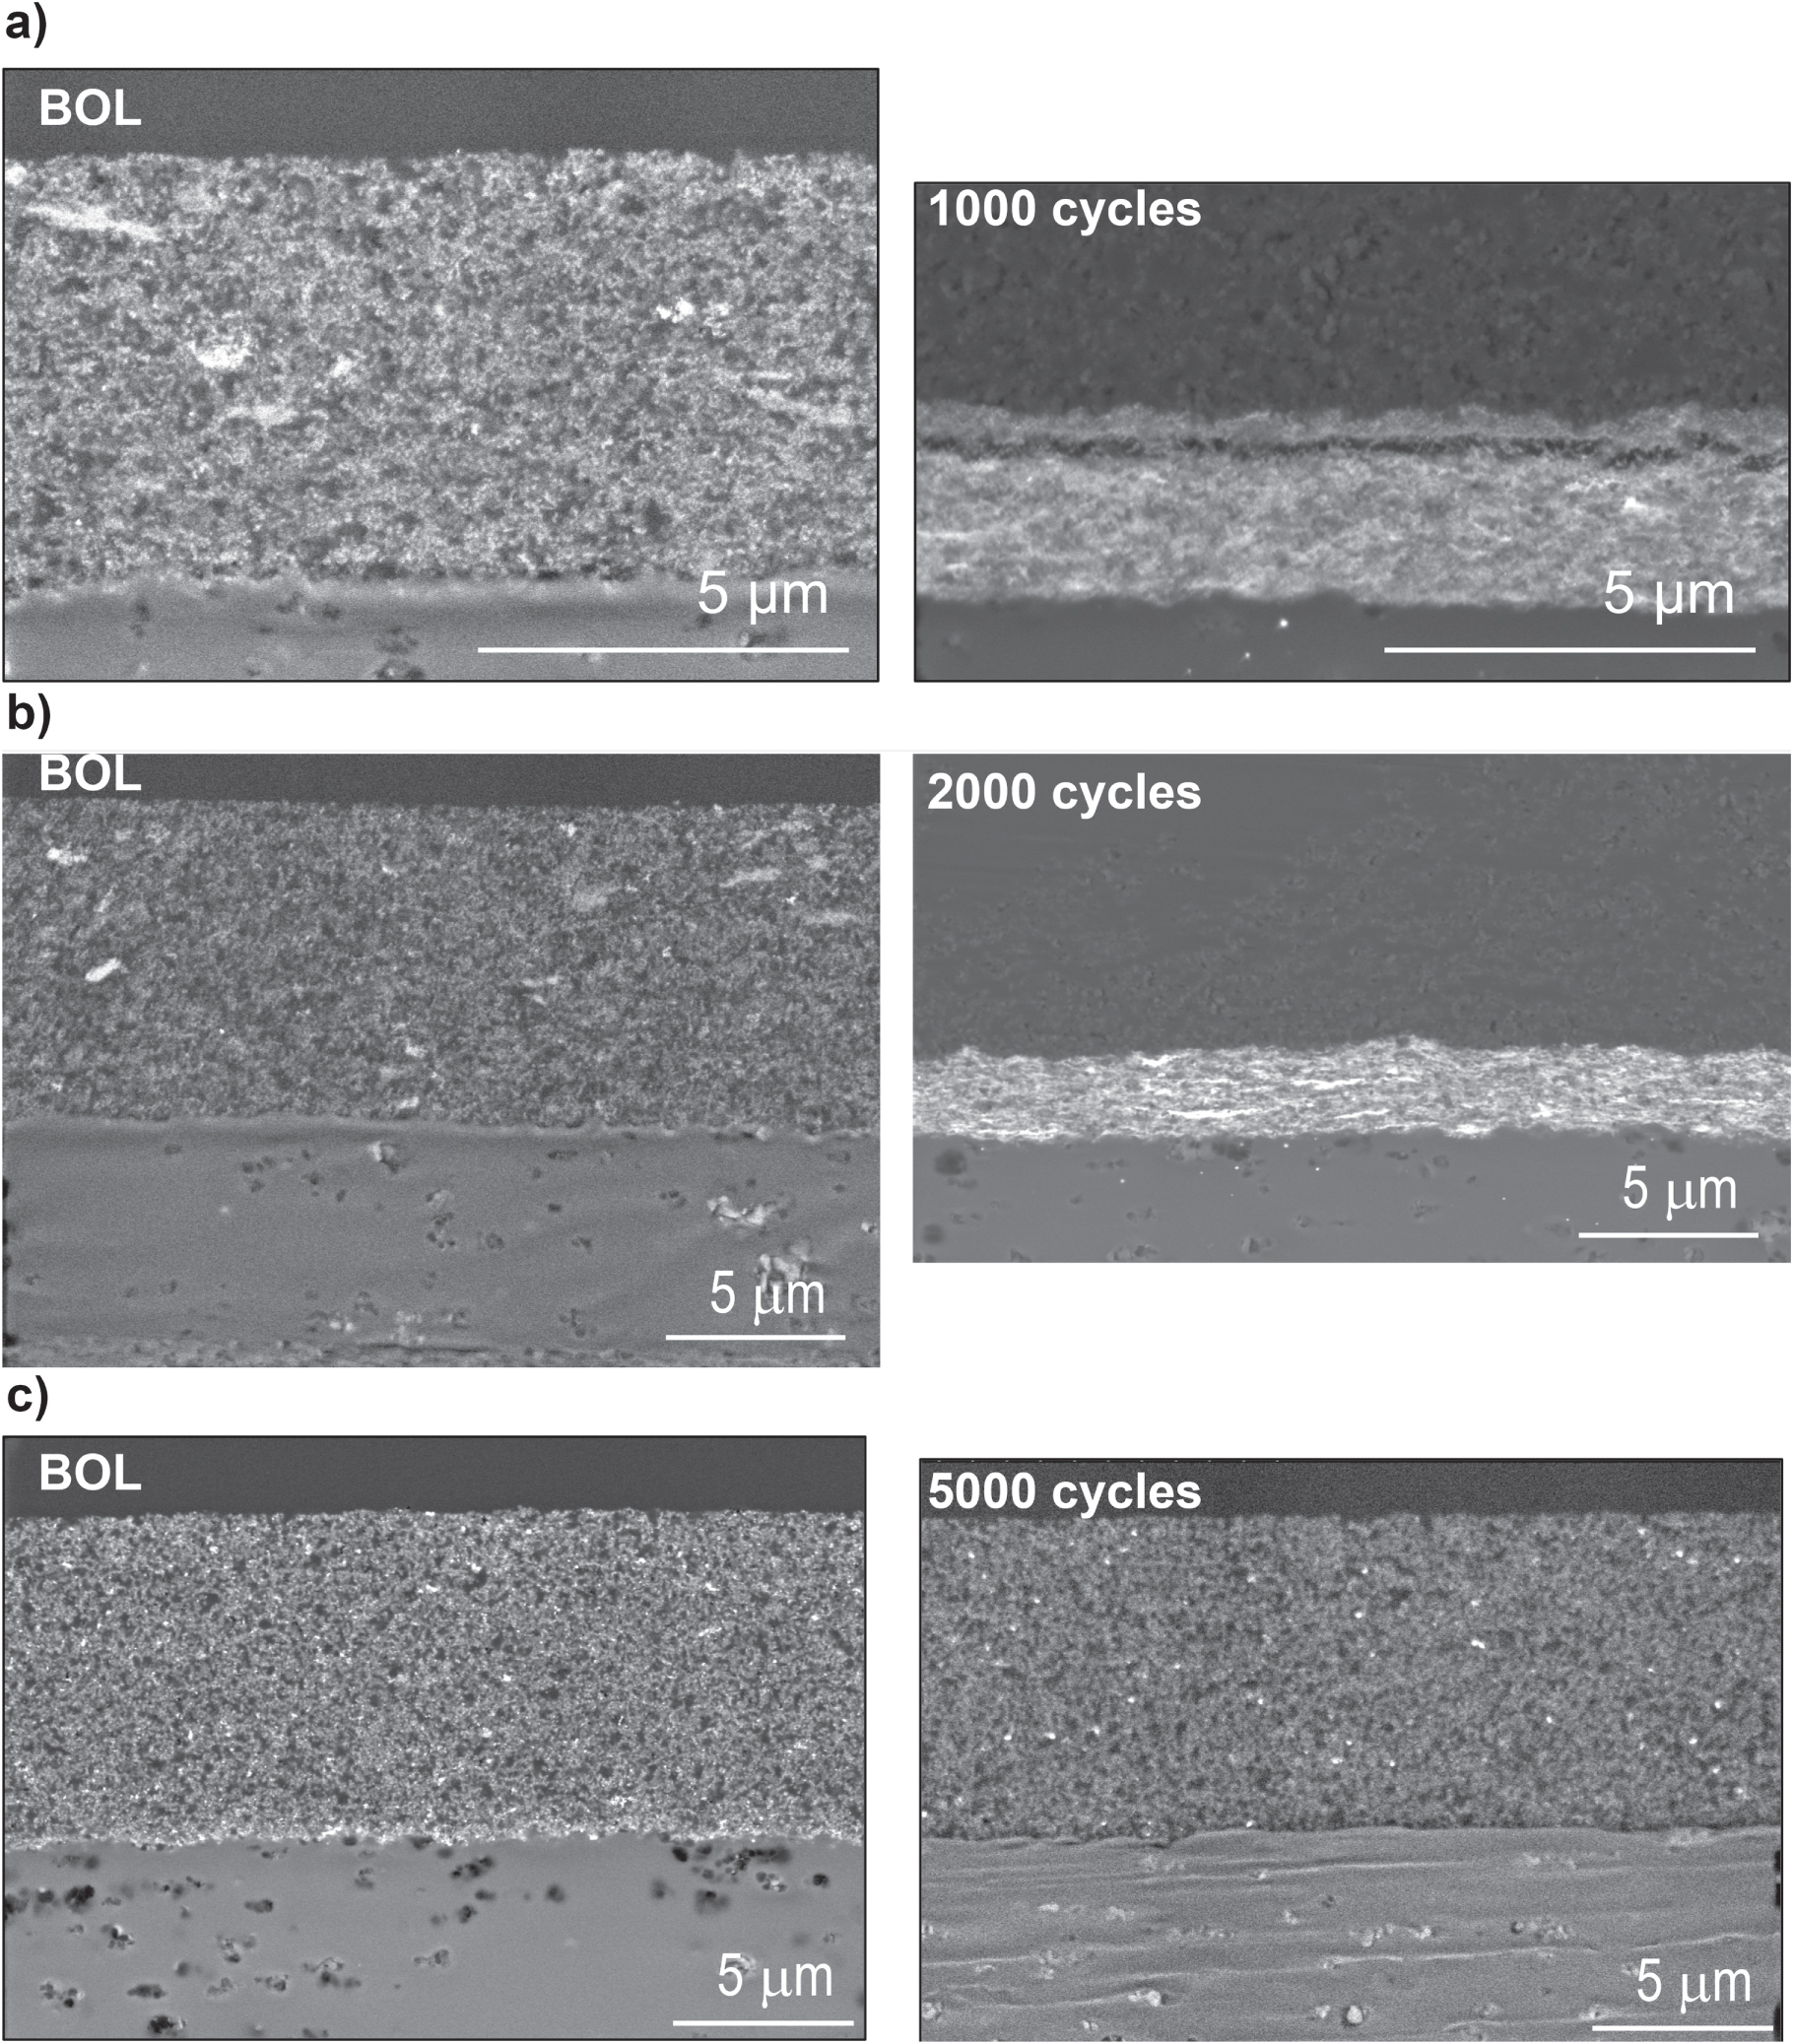
Figure 4. Scanning electron microscopy image of (a) PtCo30/H, (b) Pt30/H, and (c) Pt20/L electrode cross-section at BOL and EOL.
Download figure:
Standard image High-resolution imageThe catalysts with HSAC support (PtCo30/H and Pt30/H) show significant thinning of the CL after EOL, as seen in SEM images (Fig. 4). In contrast, the catalyst with LSAC support shows a very minimal loss in catalyst layer thickness consistent with the observed polarization curve (Fig. 2) and EIS (Fig. S3). The CL cross-section at BOL and EOL suggests a significant pore collapse for the HSAC samples due to carbon corrosion. The collapse of the pores in the catalyst layer due to carbon corrosion is one of the possible mechanisms causing increased gas transport resistance and lower EOL performance, especially at the high current densities. In addition, the resistances measured in air and HelOx (Fig. S3) are similar, suggesting that it is not pressure dependent (Fickian) losses as performance cannot be recovered with faster molecular diffusion of O2 in Helium. The limiting factor causing low performance in the HSAC support catalyst is the increase in the non-Fickian O2 transport resistance (RNF) during cycling, as seen in Fig. 5. RNF is estimated using the roughness factor from the ECSA and theoretical estimation from average particle size measured by TEM. The increase in RNF due to catalyst particle size increase from 4 nm at BOL to 4.8 nm at EOL in PtCo30/H is higher than the RNF increase in Pt30/H. Even at BOL, the RNF is lower for Pt30/H compared to PtCo30/H due to the larger catalyst particle size of the alloy catalyst. The difference in roughness factors and RNF estimated from TEM, and ECSA can explain the lower performance of the catalyst at EOL for PtCo30/H compared to Pt30/H. Co leaching into the ionomer during the AST could affect the proton conductivity and O2 permeability further, increasing the non-Fickian transport resistance. 30 For the CL with Pt20/L, where the CL is intact due to low carbon corrosion, the limiting performance factor is due to Fickian diffusion as the resistance is lowered in HelOx compared to air, as seen in Figs. S3b & S3c.

Figure 5. Non-Fickian O2 transport resistance estimated from Pt particle size and ECSA. The relation used to estimate RNF (dotted line) is reported in Ref. 39.
Download figure:
Standard image High-resolution imageThe AST protocol used while measuring the amount of carbon in the cathode (by NDIR) included a 1.2 V hold for 2 h, followed by 1200 cycles of 1 to 1.5 V cycling (triangle wave AST). The carbon corrosion rate for PtCo30/H and Pt30/H are identical during both the 1.2 V hold (see Fig. 6a) and triangle wave AST (see Fig. 6b). The carbon corrosion rate during entire AST process is shown in Fig. S4 for PtCo30/H and Pt30/H. Pt catalyst on carbon support has a heterogeneous catalytic effect on carbon support oxidation, accelerating its corrosion, 6 and is further accelerated in the presence of the transition metal in alloy catalysts as the thermal oxidation temperature for PtCo catalyst is 50 °C lower compared to Pt catalyst, as seen in the thermogravimetric analysis of PtCo and Pt catalyst with HSAC support (Fig. S5). However, the electrochemical carbon corrosion rate is similar between Pt and PtCo, as seen in Fig. 6. The carbon loss rate during the 1.2 V hold (Fig. 6a) is an order of magnitude lower than corrosion during 1 V to 1.5 V cycling (Fig. 6b), consistent with previous reports of passivation of the carbon during the 1.2 V hold AST. 32 The polarization curve at BOL and EOL for the modified triangle wave AST, shown in Fig. S6, demonstrates a higher loss for PtCo30/H than Pt30/H at EOL consistent with the previously observed performance loss. The resistance from the EIS at 0.02 A cm−2, shown in Fig. S7a, is similar at BOL but shows higher resistance for PtCo30/H at EOL. At 0.2 A cm−2, the EIS at BOL indicates a higher resistance for PtCo30/H due to mass transport, see Fig. S7b. At EOL, the EIS at 0.2 A cm−2 exhibits a 45-degree line near the high frequency region, indicating semi-infinite-diffusion limitation usually associated with ionic transport in the catalyst layer. As seen in previous results, the thinning of the catalyst layer causes increased mass transport resistance and, combined with the leaching of Co, causes the limitations observed in EIS for PtCo30/H.
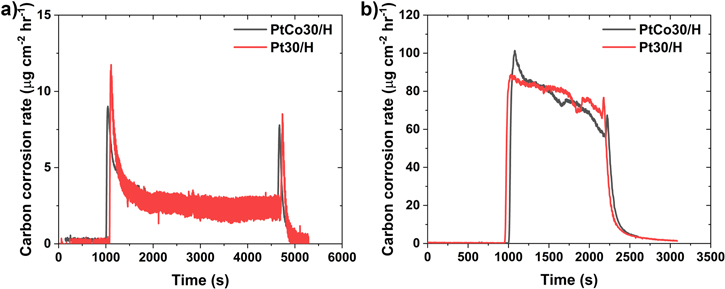
Figure 6. Carbon corrosion rate measured during (a) 1.2 V hold for 1 h and (b) 600 cycles of 1 V to 1.5 V at a scan rate of 500 mV s−1 (triangle wave AST) for PtCo30/H and Pt30/H.
Download figure:
Standard image High-resolution imageIn summary, the results from Figs. 2–6 suggest that the corrosion effect (loss in ECSA, carbon corrosion rate, CL collapse) of HSAC support is similar for Pt and PtCo catalyst. However, the performance loss is much higher for PtCo due to higher catalyst particle size in the alloy catalyst causing increased local O2 transport resistance (non-Fickian transport resistance). The performance loss for alloy catalysts could be exaggerated by Co leaching from the catalyst and decreasing its mass activity while potentially increasing the local O2 transport due to its incorporation into the ionomer. Pt20/L showed the least degradation as the LSAC support is highly resistant to carbon corrosion, but the kinetic performance is lower than HSAC support at BOL.
Computational model characterization
To better quantify the catalyst and catalyst support specific sources of performance losses, we formulated a simple model for the measured cell voltage (E) as a function of the current density (i).


where EN
is the Nernst potential,  is the cell HFR resistance,
  is the ionic resistance in the cathode catalyst layer (CCL),
  is the kinetic overpotential for ORR, and ηm
is the overpotential due to O2 mass transport resistance in the gas channel, diffusion medium and CCL.
40
is the kinetic overpotential for ORR, and ηm
is the overpotential due to O2 mass transport resistance in the gas channel, diffusion medium and CCL.
40
Following our earlier work, we formulated a distributed kinetic model for oxide-dependent ORR on Pt and PtCo catalysts. 40

where SPt
is the catalyst roughness, cm2
Pt/cm2; αn = 0.5, which corresponds to 140 mV decade−1 Tafel slope at 80 °C and low cathode potentials where  γ = 0.5, and ω = 10 kJ mol−1.
ORR kinetics on aged catalysts
Figure 7 presents the combined effect of changes in i0 and ECSA on the modeled degradation in kinetic overpotentials. PtCo30/H exhibits a significant increase in kinetic overpotential,  due to 60% degradation in i0 and 52% loss in ECSA after 1000 cycles. Pt30/H has a similar loss in ECSA, 50% after 1000 cycles, only a small change in i0, but somewhat larger
  throughout because, even after more severe aging due to Co loss, PtCo30/H retains higher i0 than Pt30/H. Pt20/L exhibits almost no degradation in
  after 5,000 catalyst support cycles. Compared to PtCo30/H and Pt30/H, Pt20/L has much smaller ECSA loss, 20% after 5,000 support cycles, compensated by a slight enhancement in i0. We can generalize the results in Fig. 7 in terms of the order in which the increase in kinetic overpotentials after aging,
  is aligned for the three catalyst systems: Pt20/L < Pt30/H < PtCo30/H. This ordering is a reflection of the catalyst stability, higher for Pt than PtCo, and catalyst support corrosion resistance, higher for LSAC than HSAC.
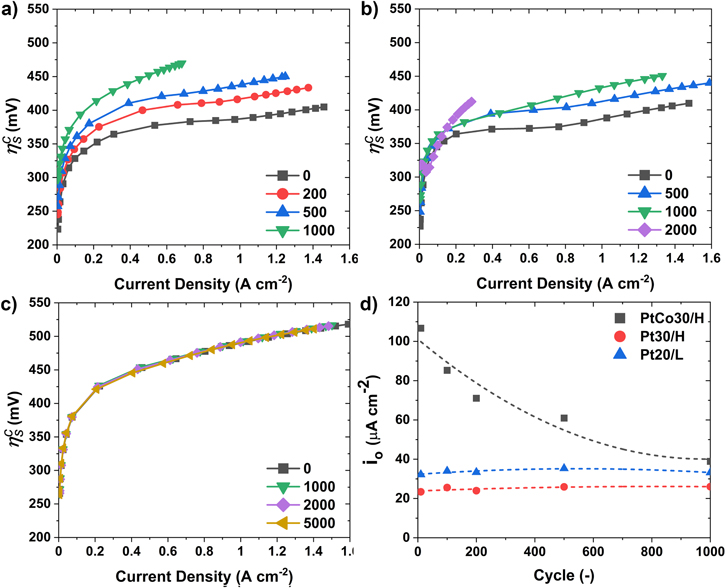
Figure 7. Breakdown of kinetic overpotentials for (a) PtCo30/H, (b) Pt30/H, and (c) Pt20/L. (d) estimated aging of exchange current density.
Download figure:
Standard image High-resolution imageFigure 7d presents the effect of aging on exchange current density (i0) for the three catalyst systems as inferred from the polarization data at low current densities where ηm
∼ 0. We note that i0 is proportional to the specific catalyst activity, defined as the cross-over corrected current density at 0.9 V  -free (HFR-free) cell voltage in H2/O2 at 1.5 atm, 80 °C, and 100% RH. Figure 7d indicates no change, or even a small increase, in i0 (μA cm−2-Pt) for Pt30/H and Pt20/L, which may be associated with enhancement in ORR kinetics as the catalyst particles grow in size after aging. TEM data showed that the average particle size for Pt30/H catalyst has increased from 3.8 nm to 4.2 nm after 2,000 support cycles. TEM data also showed a similar increase in number-averaged particle size for PtCo30/H catalyst, from 4.0 nm to 4.8 nm, but i0 in Fig. 7d has decreased by >63% after 1,000 support cycles likely because of selective leaching of Co from the alloy catalyst.
O2 transport in aged electrodes
Having characterized ORR kinetics on fresh and aged catalyst systems, Eq. 1 and polarization data can be used to estimate the overpotentials due to O2 transport resistance in the cell (ηm ). Figure 8 indicates that at BOT, ηm is nearly the same in the cells with Pt20/L and Pt30/H cathode catalysts but somewhat higher in the electrode with PtCo30/H cathode catalyst. Since the cells are otherwise identical, the differences in ηm may be attributed to the transport resistances in the electrodes. Figure 8 also indicates that the increase in ηm with aging is slowest in Pt20/Land fastest in PtCo30/H. This is illustrated more clearly in Fig. 8d which presents iL , the limiting current density, defined as i at which the mass transfer overpotential is large enough that the actual choice of ηm does not affect iL ; we chose it as 450 mV so as to avoid unnecessary extrapolation of ηm vs i data. Figure 8d indicates that a) for the same roughness, Pt20/L electrode has slightly higher iL than Pt30/H electrode and much higher than PtCo30/H electrode; b) at BOT, Pt30/H has higher roughness than PtCo30/H and much higher than Pt20/L, and c) Pt20/L shows slower degradation in iL with aging than Pt30/H and much slower than PtCo30/H. We recognize that ηm is proportional to i/iL and the overall resistance for O2 transport (Rm ) from the gas channel to the catalyst surface is related to iL as follows.

where, as shown in Fig. 9a, Rg , Rd and Rcf are, respectively, the O2 transport resistances in the gas channel, diffusion media, and the electrode.
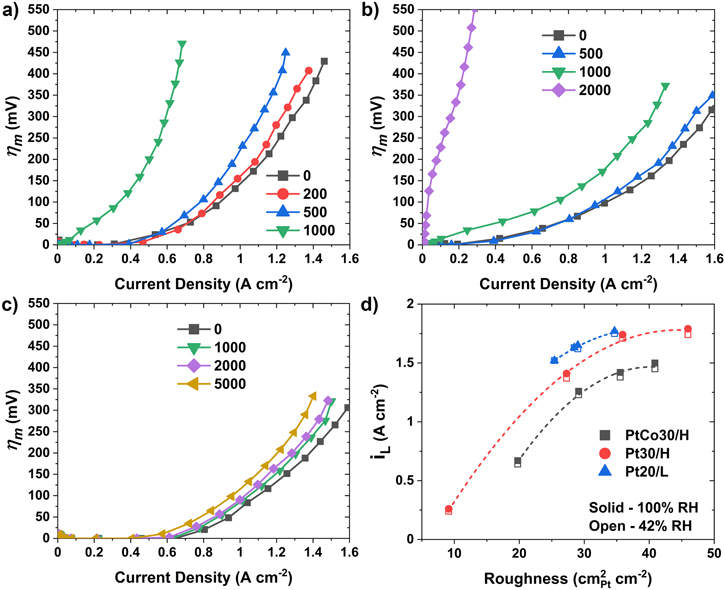
Figure 8. Breakdown of mass transfer overpotentials for a) PtCo30/H, b) Pt30/H, and c) Pt20/L. d) estimated limiting current density.
Download figure:
Standard image High-resolution image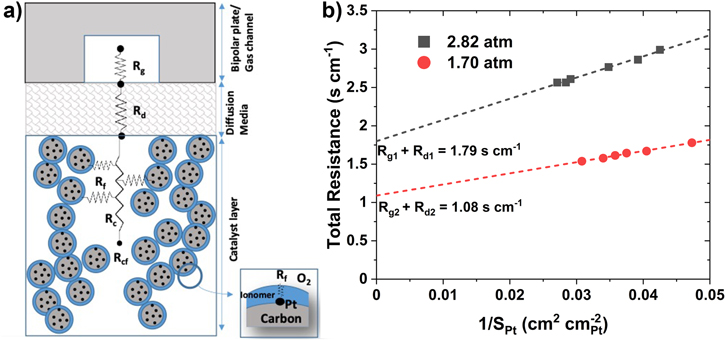
Figure 9. (a) O2 transport resistance in fuel cell. (b) roughness dependence of catalyst on total O2 resistance for Pt20/L (subscript 1,) and PtCo30/H (subscript 2).
Download figure:
Standard image High-resolution imageFigure 9b presents Rm calculated from Eq. 4 and iL determined from the polarization curves measured during the support AST on Pt20/L (subscript 1) and the catalyst AST on PtCo30/H (subscript 2). In both cases, TEM indicates that the electrode structure has remained stable with negligible alterations in the pore size distributions. Assuming that GDL has also remained stable, the intercept in Fig. 9b represents the magnitude of Rg + Rd and the slope is a measure of the roughness dependence of Rcf . Because the molecular diffusivity in gas channel and GDL is inversely proportional to pressure, we conclude from the intercepts that

Equation 5 may include some of the pressure-dependent (i.e., molecular) O2 transport resistance in pores (Rc
) as well. As a first approximation, absent pore collapse, we may assume that resistance for O2 transport across the ionomer film (Rf
) dominates over pore resistance, i.e.,  and arrive at the following estimates from the slopes.
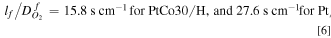
where lf
is the ionomer film thickness and  is the O2 diffusivity in the ionomer film. Equation 6 suggests that, on average, the Pt20/L system has a thicker ionomer film or smaller O2 diffusivity than the Pt30/H system.
O2 transport in compacted electrode
We can generalize the above results by invoking a 1-D macro-homogeneous model for O2 transport in the electrode. It can be shown that at limiting current, zero O2 concentration at catalyst surface, the combined resistance for O2 transport through the macropores (subscript/superscript c, electrode thickness lc ) and ionomer film is given by the following set of equations. 41


We adopted a stepwise procedure to extract the effect of PtCo30/H electrode compaction on O2 transport resistance in macropores (Rc ). We assume that changes in Rcf during catalyst AST are primarily due to increase in Rf caused by loss in roughness, as described by Eqs. 6 and 7c We also assume that, whereas the changes in Rcf during support AST are due to the combined loss in catalyst roughness and electrode compaction, Rf is still given by Eqs. 6 and 7c but with SPt as measured during the support AST. Then, Eq. 7a can be used to determine the changes in Rc during the support AST.
Using the above procedure, we determined the changes in Rm , Rcf , Rf and Rc as a function of the support AST cycles and these are shown in Fig. 10. We see that the electrode microstructure is stable over the initial 400 cycles, during which time Rc « Rf , begins to exhibit drastic changes after 500 cycles with Rc = Rf after 700 cycles, and collapses completely subsequently, as evidenced by Rc » Rf after 1000 cycles.
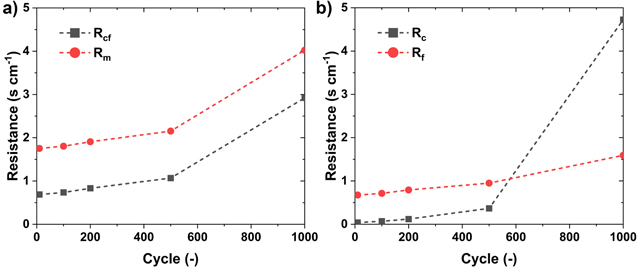
Figure 10. Breakdown of O2 transport resistance for PtCo30/H. (a) total (Rm) and catalyst layer (Rcf) O2 transport resistance. (b) pore (Rc) and film (Rf) resistance.
Download figure:
Standard image High-resolution imageWe constructed several scenarios to determine electrode porosity from the O2 transport resistance, Rc
, in Fig. 10. In one simulation, we estimated electrode macroporosity by assuming a constant carbon corrosion rate and linear variation of the electrode thickness between the initial and final values inferred from TEM. Figure 11 presents the correlation (solid circles) between the calculated porosity (ε) and the tortuosity (τ) as estimated from Rc
, electrode thickness, and the molecular diffusivity of O2 ( ).
).

We ran another set of simulations on an electrode structure constructed from X-ray computed tomography (nano-CT) of an alloy catalyst on a similar high surface-area carbon support (d-PtNi/HSAC).
42
We conducted a numerical study on this nanostructure to determine Rc
and  as a function of the macroporosity, and the results are included in Fig. 11a as solid circles.

Figure 11. Catalyst compaction expressed in terms of (a) formation factor and (b) electrode porosity.
Download figure:
Standard image High-resolution imageConsistent with the above simulation results, Fig. 11a also includes similar data from Yu et al. on Pt30/H for different I/C.
43
The dashed line is a least-square fit of the combined data sets showing that the formation factor,  varies as
  Finally, Fig. 11b presents the modeled decrease in electrode porosity with support AST cycles. We observe that the electrode porosity has decreased by 20%, 50%, and 90% after 100, 500, and 1000 support AST cycles, respectively, resulting in 50%, 75%, and ∼100% corresponding reduction in the formation factor. We also note >50% reduction in the electrode thickness that affects Rc
in addition to the rate of decrease in
Finally, Fig. 11b presents the modeled decrease in electrode porosity with support AST cycles. We observe that the electrode porosity has decreased by 20%, 50%, and 90% after 100, 500, and 1000 support AST cycles, respectively, resulting in 50%, 75%, and ∼100% corresponding reduction in the formation factor. We also note >50% reduction in the electrode thickness that affects Rc
in addition to the rate of decrease in  The results in Fig. 11 aptly quantify the degree of compaction in HSAC support due to catalyst support AST and the resulting decrease in the formation factor that can be used in Eq. 8 to calculate the increase in O2 transport resistance in electrode macropores.
Effect of Pt wt.% on carbon support durability
In this section, we discuss the effect of the catalyst wt.% on HSAC support durability during the AST. The BOL fuel cell performance of PtCo50/H MEA is lower than PtCo30/H MEA in the mass transport region, as seen in Fig. 12a. The fuel cell performance during the AST for PtCo50/H is shown in Fig. S1d. At EOL, the overall performance of PtCo50/H is better than PtCo30/H, possibly due to a lower amount of carbon loading in PtCo50/H. The loss of performance in the kinetic region (0.85 V) is similar between PtCo30/H and PtCo50/H, as seen in Fig. 12b. In the EIS shown in Fig. S8, the EOL resistance is lower for PtCo50/H compared to PtCo30/H at 0.02 A cm−2. At the Ohmic. (0.67 V) and mass transport (0.3 V) region for PtCo50/H, the loss in performance is lower and takes 2000 cycles to achieve similar EOL (1000 cycles) performance compared to PtCo30/H. This could be due to lower corrosion as catalysts with higher metal wt.% have lower carbon support content or less carbon surface area exposed. The lower performance of PtCo50/H at BOL suggests further optimization of the MEA is required.
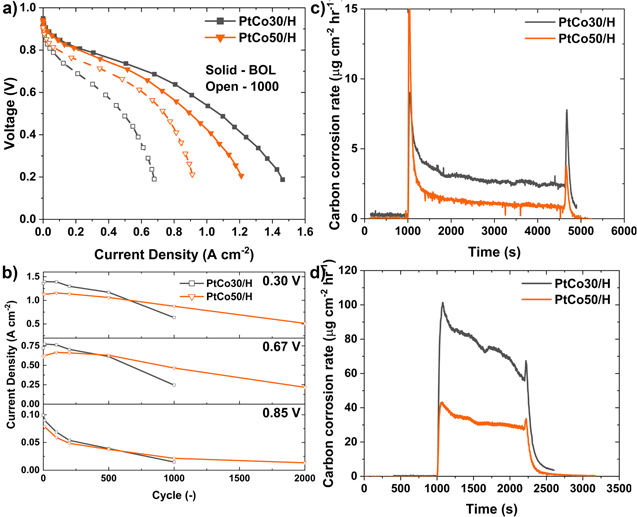
Figure 12. Performance change of PtCo30/H and PtCo50/H during triangle wave AST cycling. (a) Polarization curve at BOL and 1000 cycles and (b) the current density at 0.85 V, 0.67 V, and 0.30 V. The cell was operated at 80 °C, 150 kPa, and 100%RH. Carbon corrosion rate estimated during (c) 1.2 V hold for 1 h and (d) 600 cycles of 1 V to 1.5 V at a scan rate of 500 mV s−1 (triangle wave AST) for PtCo30/H and PtCo50/H.
Download figure:
Standard image High-resolution imageThe carbon corrosion rate for the PtCo50/H, as seen in Figs. 12c and 12d, has a similar trend between the 1.2 V hold (Fig. 12c) and 1V to 1.5 V (Fig. 12d) cycling as seen with lower Pt wt.% catalyst (PtCo30/H). The carbon corrosion rate during entire AST process is shown in Fig. S9 for PtCo30/H and PtCo50/H. The carbon corrosion rate is proportional to the amount of carbon support (or inversely proportional to Pt wt.%) in the catalyst layer as seen from the carbon corrosion rate normalized by initial carbon loading in Fig. S10. The remaining amount of the carbon depends on the initial amount, and even with high carbon corrosion rates for PtCo30/H, there is significantly more carbon left in the catalyst layer at EOL when compared to PtCo50/H. This validated the hypothesis of lower performance loss for catalyst with higher catalyst wt.%. From the perspective of the durability of the MEA, it is better to use catalysts with higher Pt wt.% (PtCo50/H) due to lower carbon corrosion and higher performance at EOL. However, higher Pt wt.% will result in worse catalyst durability due to faster growth of the catalyst particle size due to the increased proximity to other catalyst particles at BOL. 44 Hence, for increased durability of the fuel cell, the catalyst composition (Pt/C ratio) should be such that there is a balance of the two competing degradation mechanisms.
Effect of catalyst layer composition on carbon support durability
This section focuses on the effect of catalyst layer composition like ionomer equivalent weight, catalyst loading, catalyst support, and Pt wt.%, on the durability during square wave AST (repeated cycles of 1 V and 1.5 V hold for 5 s each, Fig. 1b). Figure 13a shows the iR corrected voltage at 1.7 A cm−2 for the MEAs with the identifiers H-# and G-# during the square wave AST cycling. H-3 MEA showed increased durability compared to H1 MEA which has a similar catalyst composition but with different Pt loading. The increase durability for H3 MEA is due to lower carbon loading in the CL. Performance of MEAs with the same loading but with different Pt wt.% catalyst (H−2 and H-3) showed that the MEA with higher Pt wt.% catalyst (or lower carbon loading) is better for the electrode's durability, consistent with the previously observed results in Fig. 12. The alloy catalyst MEA (H-4) showed the lowest performance at 1.7 A cm−2 and a higher performance loss rate, consistent with the previously observed results in Fig. 2. The MEA with graphitized carbon support, G-5, did not show a significant reduction in performance at 1.7 A cm−2, consistent with performance observed with similar LSAC support in section 4.1. The ECSA losses during the AST cycling are shown in Fig. 13b. ECSA of MEAs with HSAC support reduced by 50% in less than 500 cycles while the G-5 MEAs, even after 2000 cycles, lost only 21%. The results are consistent with the previously observed results in the section 4.1 and 4.3, that carbon loading and carbon type is the vital factor with very minimal or no effect of the ionomer EW, and I/C on carbon corrosion durability.

Figure 13. (a) iR-Free voltage at 1.7 A cm−2 and (b) ECSA for H-# and G-# MEA during the square wave AST cycles. (c) The carbon loss and (d) the cumulative carbon loss estimated using cathode exhaust CO2 measurement during the square wave AST cycles for H-# and G-# MEA. Reproduced from Ref. 45.
Download figure:
Standard image High-resolution image
Figure 13c shows the carbon loss estimated from the cathode CO2 during the square wave AST. H-1 MEA showed higher carbon loss compared to H-3 MEA, which had the same catalyst layer composition but lower loading. H-2 and H-4 showed the highest incremental carbon loss as they had the higher carbon loading (due to lower Pt wt.%) in the catalyst layer at BOL, which is consistent with the previously observed effect of Pt wt.% in Fig. 12. The amount of carbon lost in the catalyst layer during the AST is directly proportional to the catalyst layer's initial carbon loading. G-5 MEA showed the lowest incremental loss than MEA with similar carbon loading (H-3) as graphitized carbon support is more corrosion resistant than HSAC. 46–48 The cumulative carbon losses (%) for the five MEAs during cycling are shown in Fig. 13d. The cumulative carbon loss as a percent of total carbon was identical for MEAs with HSAC support, irrespective of the catalyst and ionomer compositions, even though the incremental carbon losses (Fig. 13c) differed on the MEAs with HSAC support. The cumulative carbon loss is lower for the MEA with graphitized carbon support losing only 10% of the initial carbon loading after 500 cycles, while the MEAs with HSAC support lost ∼35% of the initial carbon loading.
Conclusions
The catalyst support durability was studied with two accelerated stress test cycling: i) triangle wave cycling 1 V to 1.5 V at 500 mV s−1; (ii) square wave potential cycling at 1 V and 1.5 V with a 5 s hold at each potential. Carbon corrosion is similar between Pt and PtCo catalyst, while the degradation is worse for the alloy catalyst due to Co leaching from the catalyst resulting in both a mass activity loss and increased transport resistance. The larger catalyst particle size for the alloy catalyst throughout the testing exacerbates the effect of pressure independent mass transport (non-Fickian) resistance. The carbon corrosion rate is lower for catalysts with higher catalyst metal wt.% due to the lower initial carbon loading reducing the degradation and leading to higher performance at EOL. Computational modeling analysis was used to extract exchange current density and O2 transport resistance as a function of the AST cycle. The exchange current density, io, remained stable for the Pt catalyst while io decreased significantly for the alloy catalyst. The O2 transport resistance in the pore increased with electrode compaction.
The membrane electrode assembly (MEA) degrades differently with different catalyst compositions, carbon support types, and catalyst dispersions. However, the cumulative percentage of carbon lost during AST cycles is only dependent on carbon support type regardless of the catalyst/MEA composition difference. The equivalent cumulative percentage of carbon lost for the same carbon support at 80 °C is a new and unique characteristic finding in the area. The amount of carbon lost is directly proportional to the initial carbon loading. Having catalyst composition with lower carbon loading or higher catalyst wt.% should increase the electrode's durability.
Acknowledgments
Members of the group from LANL acknowledge Dr. Dimitrios Papageorgopoulos, Greg Kleen, and the funding from the US Department of Energy, the Office of Energy Efficiency and Renewable Energy, Hydrogen and Fuel Cell Technologies Office (HFTO) through the Fuel Cell Performance and Durability (FC-PAD) Consortium. Members of the group from Ford acknowledge Ford fuel cell testing team members for maintaining the test stand and performing the tests. Electron microscopy was conducted at the Center for Nanophase Materials Sciences, which is a DOE Office of Science User Facility.