
Abstract
A cold plasma system was used for Silver nanofilm coating of silk material. The Silver coated material was further modified by soaking in a 10−3 mol l−1 solution of α-cyclodextrin. The modified silk material was served as working electrode for simultaneous molecular recognition of specific biomarkers. CA19-9, CEA and p53 served as model analytes to prove that the disposable stochastic sensor can be used for simultaneous molecular recognition of specific biomarkers. The signatures (toff value) obtained for p53, CEA and CA19-9 were different, proving that the proposed disposable stochastic sensor is selective, and can be used for molecular recognition of these biomarkers in whole blood and tumoral tissue samples.
Export citation and abstract BibTeX RIS

This is an open access article distributed under the terms of the Creative Commons Attribution 4.0 License (CC BY, http://creativecommons.org/licenses/by/4.0/), which permits unrestricted reuse of the work in any medium, provided the original work is properly cited.
Nanotechnology plays a very important role in sensors' technology of the past ten years. The nanofabrication of active surfaces using different techniques able to create nanostructures on the active surface of the electrochemical sensors highly improved the response characteristics of electrochemical sensors, especially in terms of sensitivity and limit of determination. The utilization of the nanostructures on the active surfaces of the electrochemical sensors facilitated also the stochastic response of the sensors—a very powerful class of sensors due to its capacity of performing multianalyte detection because they are able to perform qualitative and quantitative analysis. 1–4
p53, CEA and CA19-9, are biomarkers used for the early detection as well as for follow up of the efficiency of treatment in different types of cancer, such as gastrointestinal cancer, pancreas cancer, colorectal cancer, and glioblastoma. Glioblastoma (GBM) represents one of the most frequent types of primary tumors of glioma in human brain. 5 Forming in glial cells, glioblastomas act as an intrusive tumor portrayed by broad angiogenesis and hereditary heterogeneity that adds to treatment deficiency and illness reappearance. Unfortunately, patients diagnosed with GBM have a median survival of 15 months, an average of 5-year survival rate being recorded for less than 10% of the patients. 6 GBM diagnosis depends on imaging procedures 7 and postoperative medical investigations. A minimum invasive procedure is essential for early detection of this illness. Circulating tumor cells, proteins (e.g., p53, CEA, Ca19-9) may be the biomarkers of choice. 8–10
p53 assumes an essential job in keeping up cell homeostasis and it is regularly deregulated in disease. The protein is situated at the focal point of an administrative system that controls cell multiplication, genome integrity and other functions. 11,12 Alteration of tumor suppressor p53 is seen in approximately 50% of grade II and III glioma, 25%–30% of primary GBM, and 60%–70% of secondary GBM, making it the most common molecular abnormality in glioma. Clinical studies identifying p53 mutation in low-grade glioma, along with the well-established role of p53 in cancer, have suggested that p53 is a potent driver mutation of GBM. 13–15 Carcinoembryonic antigen (CEA) indicates the presence of a tumor in the body. CEA was found in patients with GBM. 16–19 Carbohydrate antigen 19-9 (CA19-9) is the most validated and used serum tumor marker for the diagnosis, determination of prognosis, post-operative surveillance and monitoring of therapy in patients with different types of cancer.
This paper is proposing the design, characterization and validation of a new disposable stochastic sensor based on silk covered with nanolayer of Silver for molecular recognition of specific biomarkers. The biomarkers: CA19-9, CEA and p53 were chosen as model analytes; they were determined in whole blood and tissue samples.
Experimental
Materials and reagents
All chemicals were of analytical grade. Carcinoembryonic antigen (CEA), carbohydrate antigen 19-9 (CA19-9), tumor suppressor p53, α-cyclodextrin (α-CD) were purchased from Sigma Aldrich, and paraffin oil (d4, 20 0.86 g × cm−1) was purchased from Fluka. The CEA, CA19-9 and p53 solutions were prepared using the serial dilution method and buffered using the phosphate buffer solution (PBS, pH = 7.5).
Apparatus and methods
The electrochemical cell comprised three electrodes: the reference electrode - Ag/AgCl nanolayers deposited on silk, the auxiliary electrode which is a platinum nanolayer deposited on silk and the working electrode, represented by the disposable stochastic sensor designed in this paper (Scheme
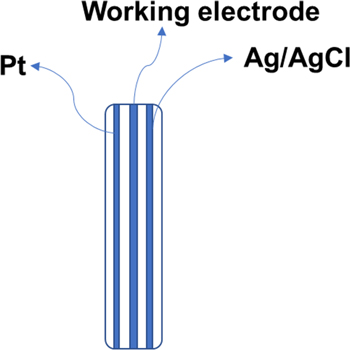
Scheme 1. The design of the electrochemical cell.
Download figure:
Standard image High-resolution imageDesign of the disposable stochastic sensor
Thermionic vacuum arc method, a cold plasma system, was used for the application onto commercially available silk textile of Silver nanofilm nanocoatings. The experimental setup of the plasma source was displayed in Fig. 1.
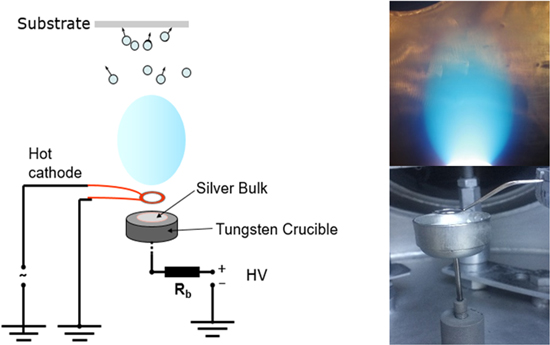
Figure 1. Schematic draw and real image of the cold plasma system and silver plasma plume.
Download figure:
Standard image High-resolution imageThe ignition principle of this plasma source was based on obtaining silver vapors and ionizing them using accelerated electrons emitted from a hot cathode. The electrons were progressively accelerated by increasing the voltage at the anode (tungsten crucible) containing the silver bulk material (99.9% purity), up to a point where a stable silver plasma was obtained. The method seems to be suitable for deposition these coatings onto temperatures sensitive organic substrates materials. This method made possible to produce nanoarchitectured films coatings at very low temperature (room temperature), under high vacuum of about 10−6 Torr, high degree of uniformity and no buffer gas was needed.
A piece of synthetic silk with the size of 210 × 297 mm was used as substrate. Before the deposition, the textile substrate was washed with deionized water and dried under nitrogen flow followed by thermal treatment in vacuum chamber for 2 h to increase the surface functionalities.
For Ag deposition, the silk textile substrate was introduced in the deposition chamber which was later pumped down to ∼3.0 × 10⁻⁶ mBar by a turbo-molecular pump. The electrical parameters used for the silver plasma were: 54 A filament current, 1.6 A plasma current and 250 V plasma voltage. The silk substrate was placed face down at 27 cm distance from the plasma plume to obtain the optimum plasma coatings. The film thickness was controlled by the deposition time and it lasted for 7 min. Digital photos of coated and uncoated silver nanofilm onto synthetic silk were shown in Fig. 2.

Figure 2. Photographs of (a) uncoated synthetic and (b) silver nanofilm coated onto synthetic silk.
Download figure:
Standard image High-resolution imageSynthetic silk used as a substrate for Ag nanofilm coatings in this study is illustrated by optical microscope images with different magnifications, showing differences in surface texture (Fig. 3).

Figure 3. Optical microscope view of uncoated (a) & (c) and silver nanofilm coated (b) & (d) of synthetic silk; scale bar 500 μm, and 200 μm, respectively.
Download figure:
Standard image High-resolution imageScanning electron microscopy was performed in order to characterize the surface morphologies of uncoated and coated synthetic silk. SEM images of 250x and 63x magnification of uncoated synthetic silk are shown in Figusre 4a and 4b while in Figs. 4c and 4d, 500x and 56x magnification SEM images of silver coated synthetic silk were presented. The images shown that the synthetic silk uncoated was smooth, clean, and silver nanofilm coated surface displaied a uniform and smooth coverage.
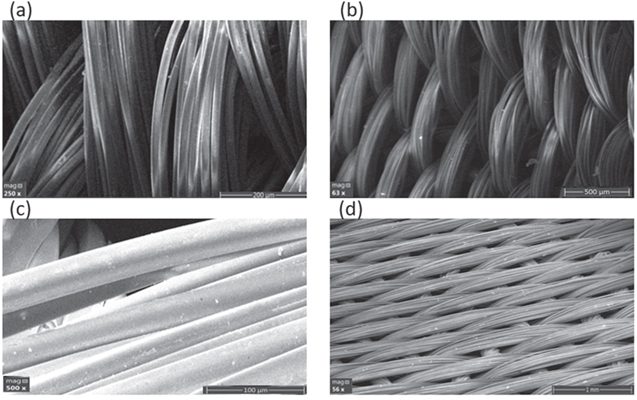
Figure 4. Scanning electron microscope images of synthetic silk at 4 magnifications: (a): 250 × & (b): × 63k of uncoated and (c): 500 × & (d): 16x of silver nanofilm coated. The cross-sectional SEM.
Download figure:
Standard image High-resolution imageOn the same piece of silk, left and right were deposited nanolayers of Ag/AgCl (to serve as reference electrode in the cell), and of Platinum (to serve as auxilliary electrode) (Scheme
The silk coated with Silver nanofilm part was soaked in a solution of 10−3 mol l−1 α-cyclodextrin for 1 h. After 1 h, the silk was dried at room temperature. The width of the working electrode was 1 mm. By its shape, the α-cyclodextrin can ensure the necessary channels for stochastic sensing.
Stochastic mode
The stochastic mode is based on the channel conductivity. The signatures of the three analites (toff values) were used for their molecular recognition (by identification of their signatures in the diagrams, Scheme

Scheme 2. Sensing mechanism of disposable stochastic sensor.
Download figure:
Standard image High-resolution image
Figure 5. Diagrams recorded for the molecular recognition of carbohydrate antigen 19-9, carcinoembryonic antigen and serum protein p53 using the proposed disposable sensor in (a) whole blood samples and (b) tissue samples.
Download figure:
Standard image High-resolution image
biological samples (Fig. 5) were used for the quantitative determination of the analites accordingly with the equation: 1–4

All measurements were done using the chronoamperometric technique, at 125 mV vs Ag/AgCl, at 25 °C. The equations of calibrations were obtained, after screening for each biomarker solutions containing different concentrations of biomarker; linear regression method was used for determination of the equation of calibration.
Samples
Whole blood and tissue samples (Ethics committee approval number 65573/14.12.2018 awarded by the University Emergency Hospital from Bucharest) were collected from patients with confirmed glioblastoma. The samples were analyzed as collected from patients, without any pretreatment. Informed consent was obtained from all patients. A drop of whole blood samples was placed on the disposable sensor and measured; the tissue sample was placed on top of the disposable sensor, and measured.
Results and Discussion
Response characteristics of the disposabe stochastic sensors
The response of the disposable stochastic sensors was based on channel conductivity.
1–4
The sensing mechanism takes place in two steps: (1) molecular recognition step (qualitative analysis takes place)—since entering the channel, the analyte blocks the channel and the current drops to zero for a certain time (until the entire molecule enter the channel) called the signature of the analyte (found in the diagrams as toff); (2) analysis step (quantitative analysis takes place)—the analyte binds the internal channel wall and undergo redox process for a certain time–found in the diagrams as ton, which is correlated with the concentration of the analyte (Scheme
Different signatures (toff values) recorded for the biomarkers (Table I) allow their simultaneous molecular recognition. The disposable stochastic sensor based on silk material gave high values of sensitivity and low limits of determination for the assay of CA19-9, CEA and p53. The linear concentration ranges covered both healthy and GBM confirmed patients. Different strips were used for measurements—the sensitivity recorded varying with less than 1.00%; this result proved the reproducibility of the design of the disposable stochastic sensor.
Table I. Response characteristics of the disposable stochastic sensors used for the assay of CA19-9, CEA and p53.
| Biomarker | Calibration equation and correlation coefficient (r) | Linear concentration range | toff (s) | Sensitivity (s−1/Conc. units) | Limit of determination |
|---|---|---|---|---|---|
| CA19-9 a) | 1/ton = 0.035 + 6.28 × 10⁹ × C | 2.1 × 10⁻¹³–200 | 0.5 | 6.28 × 10⁹ | 2.10 × 10⁻¹³ |
| r = 0.9991 | |||||
| CEA b) | 1/ton = 0.028 + 1.52 × 10⁵ × C | 4.09 × 10⁻⁹–3.20 × 10⁻⁴ | 2.0 | 1.52 × 10⁵ | 4.09 × 10⁻⁹ |
| r = 0.9992 | |||||
| p53 b) | 1/ton = 0.013 + 1.84 × 10² × C | 2.56 × 10⁻⁶–3.20 × 10⁻⁴ | 1.4 | 1.84 × 10² | 2.56 × 10⁻⁶ |
| r = 0.9897 |
Comparing the proposed disposable sensor with 3D sensors based on graphene materials 20 reported previously, one should conclude that: the sensitivity of the proposed disposable sensor is higher than of those based on graphene materials; the sensor is also cost-effective—its production cost is ten times lower than the cost of any of the graphene-based 3D sensors; no contamination from previous samples can be claimed, because it is used just for measurement of one sample.
The selectivity of the sensor is given by the signatures (toff values) of different biomarkers—recorded on the molecular recognition step. The signature of the analyte and possible interferent depends on many factors such as: unfolding capacity (if there are 2D/3D structures), size of the molecule, conformation of the molecule, velocity of going inside the channel; therefore, the signature can act as molecular recognition element, contributing to qualitative analysis of mixtures. Different signatures obtained for biomarkers like CEA19-9, p53, CA19-9, KRAS, maspin, D-aspartic acid, D-glutamine proved the selectivity of the proposed disposable stochastic sensor (Table II). The toff values recorded in Table II were determined in the synthetic mixture containing all biomarkers; despite the concentration of the biomarkers, the toff values did not change.
Table II. Selectivity of the disposable stochastic sensor (N = 10).
| Biomarker | Signature, toff (s) |
|---|---|
| CA19-9 | 0.5 ± 0.1 |
| CEA | 2.0 ± 0.1 |
| p53 | 1.4 ± 0.2 |
| KRAS | 3.7 ± 0.2 |
| Maspin | 1.0 ± 0.1 |
| D-aspartic acid | 2.4 ± 0.2 |
| D-glutamine | 3.1 ± 0.2 |
Determination of p53, CEA and CA19-9 in whole blood and tumor tissue samples
Whole blood samples, and tissue samples were obtained from GBM confirmed patients. Examples of diagrams obtained for the screening of whole blood and tissue samples were shown in Fig. 5. The molecular recognition of p53, CEA, and CA19-9 was performed first using the signature of these biomarkers using the disposable stochastic sensor (Table I). The ton values determined from diagrams were used for the quantitative determination of these biomarkers in the biological samples, accordingly with the procedure described above in the stochastic mode. The results obtained for the assay of the three biomarkers using the disposable stochastic sensor and the results obtained using the ELISA—the standard method (Table III) shown a high correlation between the results obtained the proposed method and the standard method.
Table III. Determination of CEA, CA 19-9, and p53 in whole blood and tumor tissue samples.
| Sample no. | Method | CEA (ng ml−1) | CA 19-9 (U ml−1) | p53 (ng ml−1) |
|---|---|---|---|---|
| Whole blood samples | ||||
| 1 | Screening method | 10.29 ± 0.21 | 39.43 ± 0.21 | 8.32 ± 0.27 |
| Standard method | 9.98 ± 1.08 | 39.65 ± 2.76 | 8.21 ± 1.45 | |
| 2 | Screening method | 18.99 ± 0.11 | 131.21 ± 0.21 | 6.73 ± 0.18 |
| Standard method | 18.12 ± 1.16 | 130.09 ± 2.12 | 6.50 ± 1.32 | |
| 3 | Screening method | 90.12 ± 0.08 | 183.78 ± 0.18 | 8.06 ± 0.21 |
| Standard method | 90.98 ± 2.12 | 181.97 ± 2.21 | 8.95 ± 1.07 | |
| 4 | Screening method | 90.13 ± 0.12 | 119.21 ± 0.22 | 13.12 ± 0.10 |
| Standard method | 90.12 ± 1.95 | 118.76 ± 2.40 | 13.46 ± 1.09 | |
| 5 | Screening method | 16.09 ± 0.18 | 26.65 ± 0.11 | 16.70 ± 0.14 |
| Standard method | 15.87 ± 1.12 | 26.00 ± 1.98 | 16.23 ± 1.97 | |
| Tumor tissue samples | ||||
| 6 | Screening method | 28.14 ± 0.21 | 121.55 ± 0.11 | 25.82 ± 0.23 |
| Standard method | 27.93 ± 1.15 | 120.98 ± 1.97 | 25.18 ± 1.80 | |
| 7 | Screening method | 35.99 ± 0.10 | 45.22 ± 0.18 | 20.31 ± 0.12 |
| Standard method | 34.87 ± 2.07 | 45.15 ± 1.13 | 20.12 ± 1.20 | |
| 8 | Screening method | 15.96 ± 0.11 | 112.45 ± 0.21 | 45.70 ± 0.33 |
| Standard method | 15.15 ± 1.23 | 110.95 ± 2.21 | 45.32 ± 1.23 | |
| 9 | Screening method | 11.83 ± 0.43 | 131.74 ± 0.12 | 13.13 ± 0.07 |
| Standard method | 10.97 ± 1.86 | 130.19 ± 2.12 | 13.00 ± 1.06 | |
| 10 | Screening method | 37.50 ± 0.18 | 129.29 ± 0.40 | 9.31 ± 0.10 |
| Standard method | 37.53 ± 1.98 | 128.49 ± 1.97 | 9.54 ± 1.80 | |
| 11 | Screening method | 13.62 ± 0.47 | 109.58 ± 0.37 | 1.02 ± 0.02 |
| Standard method | 13.10 ± 1.28 | 110.08 ± 1.43 | 1.18 ± 1.08 | |
| 12 | Screening method | 67.33 ± 0.13 | 173.20 ± 0.21 | 47.83 ± 0.14 |
| Standard method | 67.62 ± 1.97 | 170.94 ± 1.15 | 47.20 ± 1.21 | |
*All values are the average of 10 determinations. Screening method was using the disposable stochastic sensor. Standard method used was ELISA.
Accordingly, the new material synthesised for the design of the disposable stochastic sensor can be reliable used for molecular recognition and also for the reliable determination of biomarkers such as CEA, p53, and CA19-9 in biological samples such as whole blood and tissue samples.
Conclusions
A disposable stochastic sensor was designed for the fast screening of biological samples (whole blood, tissue samples) for three biomarkers: CEA, p53, and CA19-9. The high sensitivity, and selectivity, as well as the wide concentration ranges obtained for the assay of the three biomarkers recommend it for the screening tests of whole blood and tissues samples in order to be able to have a fast and early diagnosis of brain and gastric cancers.
Acknowledgments
The authors want to thank for the support provided by UEFISCDI, PNCDI III framework, PN-III-P4-ID-PCCF-2016–0006. All biological samples used in this study were supplied by the University Emergency Hospital from Bucharest—a partner of our institute, involved in the project PNIII-P4-ID-PCCF-2016–0006 for providing real samples for sensors' and screening tests' validation. The collection of the samples was done accordingly with the Ethics committee approval number 65573/14.12.2018 awarded by the University Emergency Hospital from Bucharest, which obeys the European guidelines for collection and handling the biological samples. Informed consent was obtained from all patients.