

Abstract
We investigate the effect of amine-based leveler additives on the catalytic function of the accelerator at the Cu-electrolyte interface. In the presence of the bis-(sodium sulfopropyl)-disulfide (SPS) accelerator, chronopotentiometric measurements show the potential changes from inhibition of the levelers increased with molecular weight and were greater to those of glycol-based suppressors. In situ surface-enhanced Raman spectroscopy (SERS) revealed significant conformational changes of the surface-adsorbed SPS in the presence of the amine-based levelers. This leveler-induced conformational perturbation of SPS diminishes the activity of SPS. SERS also revealed decreased coverages of surface-adsorbed SPS in the presence of the high molecular weight amine-based levelers at negative potentials, indicating that the leveler limits direct contact of SPS with the surface. Decreased coverages were also found for adsorbed chloride in the presence of all levelers considered, likely contributing to the deactivation of the accelerative effect of SPS. Secondary-ion mass spectrometry (SIMS) analysis of Cu electrodeposited from solutions comprised of a linear polyethyleneimine (PEI), SPS, and Cl– show increased S, Cl, and C content in the deposit relative to solutions absent PEI, indicating the presence of PEI results in co-incorporation of these additives. This leveler-assisted incorporation of SPS and Cl– also serves to mitigate SPS acceleration.
Export citation and abstract BibTeX RIS
Cu electrodeposition is used in the metallization of the electrical connections within microelectronic devices, such as integrated circuits (IC) and printed circuit boards (PCB). 1 These connections include damascene interconnects on chip scale, 2 through silicon vias (TSV) for 3D stacking, 3,4 redistribution layers (RDL) 5 and pillars for advanced packaging applications, 6 as well as blind micro vias (BMV) 7 and through holes on PCB level. 8 The high aspect ratios of damascene interconnects complicate device fabrication. 9 Cu electrodeposition electrolytes used in the dual-damascene process consist of additives to enforce defect-free filling of trenches and vias. 2,10
Additives are categorized with respect to their role in enhancing or inhibiting Cu reduction kinetics and by their interactions with other components in the plating bath. 11 These additives are often categorized as accelerators, suppressors, and levelers. The combined effect of additives on Cu deposition rates and intermolecular interactions leads to differential plating during electrodeposition, facilitating defect-free filling of the feature. Various phenomenological models are used to describe the differential plating process. 12–15 These models are predicated on the solution composition, the physical properties of the additives, overpotentials and exchange currents, as well as feature dimensions among other properties. However, the chemical mechanisms of interaction, which play a crucial role on the filling mechanics, are not completely understood. A thorough understanding of the interplay of the additives both with each other and the Cu electrode will motivate the rational design and deployment of Cu electrodeposition bath additives with improved capabilities.
The accelerator, typically bis-(sodium sulfopropyl)-disulfide (SPS), serves to catalyze the reduction of Cu. 16 Previous work shows that SPS undergoes decomposition at the Cu surface, starting from either the original dimer state of SPS or as 3-mercapto-1-propanesulfonate (MPS) (the monomer equivalent of SPS), to form a surface-adsorbed Cu-thiolate species. 17,18 Acceleration in the presence of SPS has been ascribed to both enhanced formation of soluble Cu+ intermediates by complexation of Cu+ with thiolate species 10,19,20 and stabilization of desolvated Cu2+ species by the surface proximal sulfonate moiety of SPS. 20
In contrast, the suppressor, most commonly polyethylene glycol (PEG), 16,21 polypropylene glycol (PPG), 21 or PEG-PPG copolymers, decreases the rate of Cu reduction. 10,11,22–26 The PEG or PPG polymer forms a polyether-Cu-Cl complex which physically occludes the electrode from migrating Cu2+ and binds reactive Cu+ species. 27–29 The SPS exhibits stronger adsorption to Cu than PEG, leading to displacement of the latter. 12,30,31
Levelers comprise a second class of additives that inhibit Cu deposition. In contrast to suppressors, these additives cannot be displaced by the accelerator. 11 Levelers encompass amino and pyridine containing molecules, such as linear and branched polyethyleneimine (PEI), 11,32 Janus Green B (JGB), 14 and quaternary ammonium surfactants. 33–35 In the context of the dual-damascene process, levelers serve to mitigate undesirable overfill, which stems from an accumulation of SPS at the top of the feature after filling is complete. 36 Like suppressors, inhibition of the Cu electrodeposition by the leveler has been suggested to result from physical occlusion of the electrode from Cu ions. 34,35 In contrast to suppressors, leveler inhibition is unaffected by SPS anti-suppression. 11,32
The strong inhibition of levelers such as PEI in the presence of SPS has been ascribed to two main contributions. First, PEI and SPS interaction has been proposed to result in quenching of the catalytic activity of the sulfonate moiety of SPS, leading to deactivation of SPS as an accelerator. 32 Second, the presence of SPS has been suggested to enhance the adsorption of some levelers on the SPS-decorated electrode surface, leading to increased inhibition of PEI in the presence of SPS. 11 The molecular origin of leveler activity in both cases is thought to relate to the ion pairing interaction of the cationic amine functionality with the anionic sulfonate moiety of SPS. 11,35 The exact mechanisms of interaction on the molecular level between the SPS and the inhibitor are not fully understood.
Recently, we found that the conformational state of Cu surface-bound sulfoalkyl disulfides such as SPS affects the molecule's efficacy as an accelerator. 20 In solutions containing SPS, the increased availability of the gauche conformer of adsorbed SPS led to optimal acceleration. In the gauche conformational state, the sulfonate moiety of SPS is more capable of accelerating Cu deposition due to its closer proximity to the surface. Possible changes in SPS gauche and trans character in the presence of inhibitors, such as levelers and suppressors, can therefore inform the interaction of SPS with these other solution components. Additionally, changes in surface coverage of either SPS or Cl– in the presence of inhibitors may disrupt the accelerated electrodeposition associated with the SPS-Cl– phase. In particular, we wondered whether the gauche/trans character of SPS and the surface coverage of SPS would respond differently to the presence of amine-based levelers or glycol-based suppressors.
In this paper, we employ chronopotentiometry, in situ surface-enhanced Raman spectroscopy (SERS), and secondary-ion mass spectrometry (SIMS) to evaluate the inhibitory effect of glycol-based suppressors and amine-based levelers and their interaction with SPS. Chronopotentiometric measurements are widely used to determine additive influence on Cu reduction. 11,12,14,37 SERS is used to evaluate the molecular structure of surface-confined additives and has yielded insight on the mechanisms of inhibition and acceleration attendant the three classes of additives. 20,27,33 SIMS analysis is utilized to study additive incorporation into Cu electrodeposits. 38,39 By using chronopotentiometry, SERS, and SIMS we elucidate the origin of the inhibitory effect of amine-based levelers in the presence of SPS. We also evaluate the effect of molecular weight on the inhibitory effect of the leveler.
Experimental
Chronopotentiometry
Chronopotentiometry measurements employed an Autolab potentiostat/galvanostat (Metrohm, PGSTAT 302 N) in a three-electrode cell configuration. A Pt disc (d = 0.3 cm), mounted to a rotator, served as the working electrode. The counter electrode consisted of a Pt wire and was housed in a glass bridge filled with 0.5 M H2SO4 and separated from the main electrochemical cell by a ceramic frit. Potentials were measured by using a Hg/Hg2SO4/sat. K2SO4 reference electrode. Potentials are reported vs NHE (+650 mV vs Hg/Hg2SO4/sat. K2SO4). Additive-free base electrolytes for chronopotentiometry measurements contained 0.787 M Cu2+ ions (50 g l−1, prepared from CuSO4 · 5H2O, ≥ 99%, [Cl−] ≤ 5 ppm, VWR) as well as 0.510 M H2SO4 (50 g l−1, ≥ 98%, [Cl−] ≤ 10 ppm, Merck), and 1.41 mM chloride (50 ppm, prepared from HCl, 37%, Merck). All measurements were performed at room temperature.
Prior to each experiment, the Pt working electrode was pre-plated with copper by applying a current density of −10 mA cm−2 for 100 s while rotated at 1000 rpm in the additive-free base electrolyte. Chronopotentiometry measurements were subsequently performed for 1000 s at a current density of −10 mA cm−2 and 1000 rpm rotation. Two injection schemes were studied here, both of which involved the injection of an additive at 250 s and 500 s, respectively. In the first injection scheme (IS 1), 30 ppm of sodium 3,3'-disulfanediylbis(propane-1-sulfonate) (SPS, 8.5 × 10⁻⁵ M, ≥ 94%, Atotech) and 100 ppm of an inhibitor additive were injected sequentially at 250 s and 500 s. In the second injection scheme (IS 2), 100 ppm of an inhibitor additive and 30 ppm of SPS were injected sequentially at 250 s and 500 s. The inhibitor additives under investigation are shown in Fig. 1.
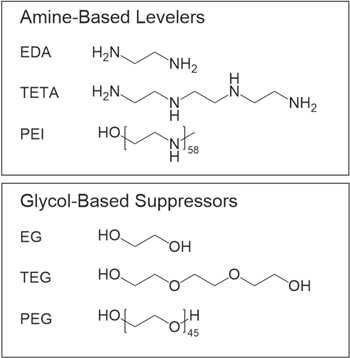
Figure 1. Molecular structures of amine-based levelers and glycol-based suppressors used in this study.
Download figure:
Standard image High-resolution imageIn situ SCV SERS
The base electrolyte solution for SERS measurements, also known as the virgin makeup solution (VMS), was made using 100 mM H2SO4 (ULTREX II Ultrapure Reagent, J.T. Baker), 10 mM CuSO4 · 5H2O (99.999% trace metals basis, Sigma-Aldrich), and 50 ppm Cl– (as HCl, ULTREX II Ultrapure Reagent, J.T. Baker) in 18.2 MΩ cm−1 Milli-Q water (Millipore). Higher H2SO4 and CuSO4 concentrations, as utilized for other measurements in this investigation, than these led to increased Cu deposition, diminished enhancement, and decreased sensitivity of the SERS measurement. The solutions contained either 34 ppm SPS (Atotech) and 100 ppm of one inhibitor compound, exclusively 34 ppm SPS, or exclusively of 100 ppm of 2500 molecular weight linear polyethyleneimine (PEI Mw 2500, 95%–100%, Polysciences) or 2000 molecular weight polyethylene glycol (PEG Mw 2000, Sigma-Aldrich). The inhibitor compounds were ethylenediamine (EDA, ≥ 99.5%, Sigma-Aldrich), triethylenetetramine (TETA, ≥ 97%, Sigma-Aldrich), 2500 molecular weight linear polyethyleneimine, ethylene glycol (EG, 99.8%, Sigma-Aldrich), triethylene glycol (TEG, 99%, Sigma-Aldrich), and 2000 molecular weight polyethylene glycol. Each solution was sparged with Ar prior to use and blanketed with Ar for the duration of the measurements.
Staircase voltammetry (SCV) was performed utilizing a CHI760E potentiostat (CH Instruments) in a glass/Kel-F spectroelectrochemical cell described elsewhere. 40 The working electrode consisted of a polycrystalline Cu disk which was sanded with silicon carbide grinding paper (MicroCut Plain 800, Buehler) to expose metallic Cu. It was subsequently electrochemically roughened by 30 oxidation-reduction cycles (ORC) in 0.1 M KCl (99.999% trace metals basis, Aldrich). Each cycle comprised of a −1.0 to 0.4 V vs Cu cycle at 100 mV s−1 followed by a 10 s −1.0 V vs Cu potential hold. The Cu disk was removed from solution during the last −1.0 V vs Cu potential hold. The disk was thoroughly rinsed with Milli-Q water after roughening. The reference electrode and counter electrodes were Ag/AgCl/3 M NaCl electrode (BASi) and a Cu wire, respectively. The Ag/AgCl reference was calibrated vs NHE prior to each SERS measurement. Potentials are reported with respect to NHE.
SERS was obtained as described previously 40 using excitation from He/Ne laser (Meredith Instruments) at 632.8 nm. Spectra were accumulated from 30 individual acquisitions of 1 s each which were collected over each 30 s potential step. A 50 μm slit width was used, providing an estimated spectral resolution of approximately 6–7 cm−1. Three SCV cycles were performed for each wavenumber window, each consisting of 30 s potential holds and 50 mV potential steps spanning 0.35 to −0.35 V vs NHE. Spectroelectrochemical analysis results reported here for SPS-containing solutions were obtained from the first through third cycles of each measurement. Here, we present the third cycle data since these better reflect steady state conditions on the electrode. Results reported here for VMS + 100 ppm PEI 2500 or VMS + 100 ppm PEG 2000 solutions were obtained from the first cycle of each measurement. For these solutions, extended cycling led to diminished signal intensities and decreased sensitivity of the SERS measurements. This signal loss is likely attributed to changes in the Cu surface roughness. SERS spectra presented here were baseline subtracted using a straight line subtraction. Band intensity or intensity ratios were obtained by using baseline interpolation to construct a baseline.
SIMS
Samples for SIMS analysis were prepared using an Autolab potentiostat/galvanostat (Metrohm, PGSTAT 02 N) in combination with a Rotating Disk Electrode (RDE) setup in combination with a coupon holder as working electrode and a Ag/AgCl (3 M KCl) reference electrode. 20 mm × 20 mm coupons with a Cu seed layer, which were cut from a 300 mm unstructured wafer (Fraunhofer IZM—ASSID), were used as substrates and mounted to the coupon holder. A soluble copper electrode served as counter electrode. Prior to the electrolytic process, the coupons were treated with sulfuric acid (10% in water) for 30 s. All copper electrodeposition experiments were performed at 100 rpm and room temperature. Additive-free base electrolytes contained 0.787 M Cu2+ ions (50 g l−1, prepared from CuSO4 · 5H2O, ≥ 99%, [Cl−] ≤ 5 ppm, VWR) as well as 1.020 M H2SO4 (100 g l−1, ≥ 98%, [Cl−] ≤ 10 ppm, Merck), and 1.41 mM chloride (50 ppm, prepared from HCl, 37%, Merck) as well as 100 ppm of the respective inhibitor additive (PEG (Mw 2000, Sigma-Aldrich) or PEI (Mw 2500, 95%–100%, Polysciences) in absence and presence of 30 ppm of sodium 3,3'-disulfanediylbis(propane-1-sulfonate) (SPS, 8.5 × 10⁻⁵ M, ≥ 94%, Atotech). The deposition current was set to −10 ASD for 164 s.
Dynamic secondary ion mass spectrometry (DSIMS) was performed using a Cameca double-focusing magnetic sector SIMS tool. Data are reported as counts obtained from an average of values from sputter depths between 0.5–1.5 μm to avoid effects of the surface and recalculated to parts per million atomic (ppma).
Results
Chronopotentiometry
We first examine the effect of introducing additives into the Cu electrodeposition electrolyte. Figure 2. shows chronopotentiometric measurements reporting on the change in the Cu cathode potential following additive addition using the IS1 (Figs. 2A and 2C) or IS2 (Figs. 2B and 2D) protocols. In these plots, an increase in the potential indicates acceleration of electrodeposition, whereas a decrease in potential indicates inhibition.
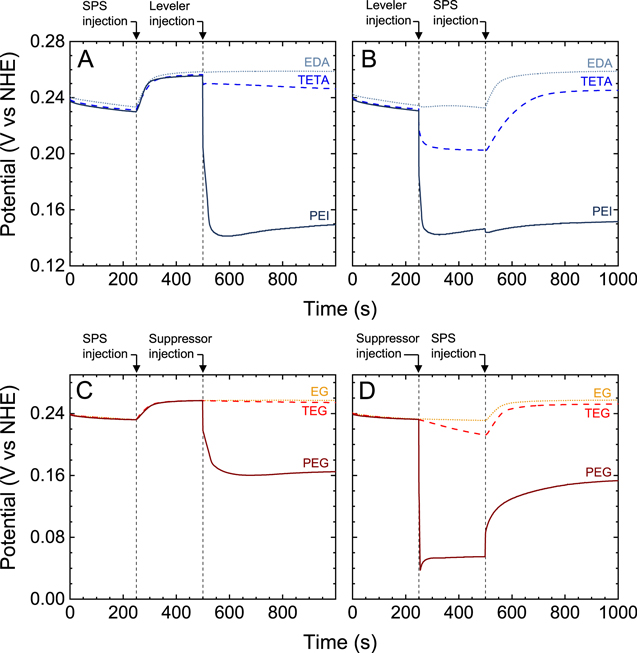
Figure 2. Chronopotentiogram of a Cu electrode in the additive-free base electrolyte with additive injections following either IS1 (A) and (C) or IS2 (B) and (D). A and B depict injection protocols involving levelers EDA ( ), TETA (
 ), or PEI 2500 (
 ). C and D depict injection protocols involving suppressors EG (
 ), TEG (
 ), or PEG 2000 (
 ).
).
Download figure:
Standard image High-resolution imageFigure 2A shows the corresponding changes in potential from sequential injection of SPS and leveler employing injection protocol IS1. The figure shows that the potential increases following injection of SPS into the additive-free base electrolyte at 250 s. The 24 ± 2 mV increase, which is consistent with prior reports, shows that SPS acts as an accelerator in solutions containing chloride. 11 The leveler is then injected into the solution at 500 s. Figure 2A shows that the potential of Cu electrodeposition is unaffected by the injection of EDA, indicating that EDA has no inhibitory effect. In contrast, the injection of TETA or PEI results in a marked decrease in the cell potential of −10 and −106 mV, respectively, indicating that both levelers have an inhibitory effect in the presence of SPS. Indeed, prior reports suggest that addition of PEI inhibits Cu electrodeposition in the presence of SPS and leads to a comparable decrease of potential. 11,25,32
Figure 2B shows changes in cathode potential as the leveler and SPS are injected consecutively according to injection protocol IS2. The figure shows that the injection of EDA causes minimal change in the potential, again indicating that EDA does not inhibit as observed with IS1. Alternatively, the injection of TETA or PEI into the additive-free base electrolyte causes a substantial decrease in potential of −29 and −84 mV, respectively, indicating these compounds function as an inhibitor regardless of the presence of SPS in the electrolyte. A decrease of −84 mV from injection of PEI into the additive-free base electrolyte coincides with that reported previously. 25 The subsequent injection of SPS leads to an increase in potential in the EDA or TETA systems. Interestingly, the figure shows a further decrease of −5 mV in cathode potential following the injection of SPS into the system containing PEI, which is consistent with previous literature. 25 The final potential for the amine-based leveler + SPS systems is similar regardless of the injection protocol employed, as reported previously. 11
The effect of sequential injection of SPS and a glycol suppressor on the Cu reduction potential, following injection protocol IS1, is shown in Fig. 2C. The injection of SPS into the additive-free base electrolyte results in a 24 ± 2 mV potential increase similar to that seen in Fig. 2A. The potential remains unperturbed by the injection of EG and decreases by −3 mV following injection of TEG, which indicates these molecules possess little inhibitory effect. In contrast, the subsequent injection of PEG results in a substantial −92 mV potential decrease, showing the presence of a strong inhibitory effect, consistent with prior literature. 11,25
The potential changes resulting from successive injection of suppressor and SPS, using injection protocol IS2, are shown in Fig. 2D. The injection of EG does not change the cathode potential, which was also observed by using IS1. The potential decreases by −20 mV as a result of TEG injection into the additive-free base electrolyte. In contrast, a −178 mV potential decrease occurs as a result of PEG injection, consistent with prior reports. 12,25 Figure 2D shows that the injection of SPS into the glycol-containing electrolyte results in an increase in cathode potential, which is a manifestation of the accelerating or anti-suppressing characteristics of SPS. 12,16 The addition of SPS into the PEG-containing electrolyte results in a 98 mV potential increase. This potential increase, resulting from SPS displacement in the presence of PEG, is remarkably greater than that obtained from the addition of SPS into the additive free base electrolyte (24 mV), consistent with previous reports. 11,25 The final potential for Cu reduction is independent of injection protocol, similar to that shown in Figs. 2A, 2B and prior literature. 11
Figure 3 reports the potential change (ΔE) resulting from injection of an inhibitor additive into the SPS-containing electrolyte, using protocol IS1. The figure shows that ΔE depends on the identity of the additive. In particular, Fig. 3 shows that increasing the molecular weight of the inhibitors considered here results in an increase in the magnitude of ΔE. The figure also shows that greater magnitudes of ΔE are generally found for amine-containing levelers relative to glycol-based suppressors, indicating the levelers exhibit a stronger inhibitory effect than suppressors in the presence of SPS, as reported previously. 11,25
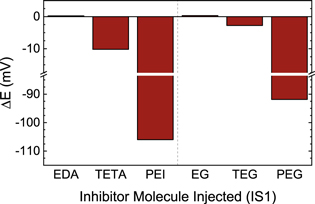
Figure 3. Potential change (ΔE) resulting from the injection of an inhibitor additive into the SPS-containing electrolyte following IS1. A dashed line separates the molecules studied into amine-based levelers (left half) and glycol-based suppressors (right half).
Download figure:
Standard image High-resolution imageIn situ SCV SERS
We next interrogate the vibrational spectra of the SPS-containing additive ensembles on the Cu electrode surface. Figure 4 shows the in situ SCV SERS spectra obtained from a Cu electrode immersed in a solution containing VMS + 34 ppm SPS. Multiple adsorption mechanisms for either SPS or MPS, the reduction product of SPS, have been proposed. 10,41 The adsorbed thiolate species may be produced by cleavage of the disulfide bond of SPS on Cu and subsequent comproportionation to give Cu(I)-MPS, electrochemical reduction of SPS to produce MPS and subsequent adsorption of MPS, or adsorption of the intact SPS dimer. Regardless, adsorption occurs via the thiol and the sulfonate moiety remains pendant. 18,41,42 There is no evidence for the presence of a S–S bond, consistent with prior work. 42
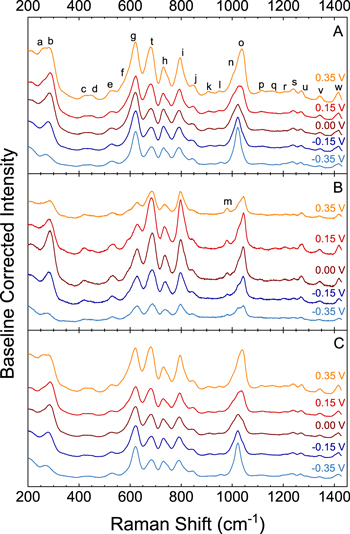
Figure 4. In-situ SERS spectra obtained during cathodic polarization in an electrolyte consisting of VMS + 34 ppm SPS (A), VMS + 34 ppm SPS and 100 ppm linear PEI 2500 (B), and VMS + 34 ppm SPS and 100 ppm PEG 2000 (C).
Download figure:
Standard image High-resolution imageThe spectra in Fig. 4A evince the presence of several different bands, labeled a—w, which are mainly associated with the surface-adsorbed thiolate. Table SI (available online at stacks.iop.org/JES/168/042501/mmedia) provides detailed vibrational mode assignments. The spectrum is identical to that reported previously. 20,42 In Fig. 4, bands g and t are associated with the C–Sthiol stretch of the gauche and trans conformational states of the thiol-adjacent C–C bond with respect to the Cu–Sthiol bond. 40,43–47 Figure 4 also shows the presence of peak b associated with the Cu–Cl stretch and peak i associated with the C–Ssulfonate stretch, both assigned previously. 40,46–50 The ratio of intensities of bands g and t exhibit potential dependence, with the gauche/trans ratio highest at more negative potentials. This behavior is somewhat different from that previously reported, likely due to the lower concentration of SPS used here. 20
Figure 4B depicts the in situ SCV SERS spectra obtained from a Cu electrode in a solution consisting of VMS + 34 ppm SPS and 100 ppm PEI. The spectra obtained with and without PEI are qualitatively similar indicating that SPS is still bound to the Cu electrode surface. The potential-dependent behavior of bands g and t, however, are clearly different relative to the spectrum obtained absent PEI. In particular, the gauche/trans ratio is clearly lower in the presence of PEI. This indicates that the leveler changes the behavior of the SPS.
The in situ SCV SERS spectra obtained from the Cu surface in an electrolyte composed of VMS + 34 ppm SPS and 100 ppm PEG are depicted in Fig. 4C. The spectra obtained for the PEG-containing electrolyte and for SPS alone display the same bands. In addition, the bands g, t, and b display similar potential-dependent behavior for both systems, indicating the behavior of SPS is unaffected by the presence of PEG.
Since the addition of the leveler changes the SPS behavior, we calculated the ratio of baseline-corrected peak intensity of bands g and t (gauche/trans). Ratios calculated using integrated peak intensities gave identical results. Figure 5 shows the ratio as a function of potential for the various additive ensembles. For SPS in VMS the gauche/trans peak intensity ratio is relatively high, increasing from 1.1 to 1.8 through the cathodic sweep and decreasing gradually to 1.1 through the anodic sweep. We note that the gauche/trans ratio reported here is somewhat higher than that reported previously; this change may relate to the higher SPS concentration (1 mM vs 96 μM) used before. 20 The greater surface packing density of SPS in prior work may enforce a greater tendency of SPS to adopt the trans conformation, resulting in lower ratios.

Figure 5. Baseline-corrected peak intensity ratio of the gauche and trans C–Sthiol stretch (gauche to trans) of SPS as a function of potential for systems comprised of 34 ppm SPS + 100 ppm of an amine-based leveler + VMS (A), and 34 ppm SPS + 100 ppm of an glycol-based suppressor + VMS (B). For comparison, gauche/trans ratio intensity traces for SPS alone in VMS are also plotted in A and B.
Download figure:
Standard image High-resolution imageFigure 5A compares the potential-dependent gauche/trans ratios obtained from SPS in VMS to that from solutions containing VMS + SPS plus the amine-based leveler additives. The figure shows that the gauche/trans ratio decreases significantly in the presence of levelers. Without levelers, the ratio is always above 1 and approaches 1.8 at the most negative potentials. In contrast, addition of the amine-based leveler reduces the gauche/trans ratio to between 0.5 and 1.1, depending on the specific amine and the potential. Interestingly, the solution containing PEI exhibits the lowest gauche/trans ratios, which range between 0.5 at the lowest and 0.9 at the highest. The gauche/trans ratios obtained in the presence of monomeric EDA and trimeric TETA were marginally higher, ranging from 0.6 and 1.1. We note that PEI resulted in the highest degree of inhibition in the presence of SPS. The gauche/trans ratios obtained in the presence of the levelers exhibits substantially more hysteresis than that observed for SPS alone. Finally, we note that the trends in gauche/trans ratio observed in the third cycle (SPS alone > EDA > TETA > PEI) were also present in the first cycle.
Figure 5B reports on the gauche/trans ratios measured from solutions containing VMS + SPS and 100 ppm of glycol-based suppressors. The figure shows that the presence of glycols does not significantly affect the gauche/trans ratios relative to SPS alone. This result suggests that SPS orientation on the surface is unaffected by the presence of the glycol-based suppressor. These trends in gauche/trans ratio (SPS alone ≈ EG ≈ TEG ≈ PEG) were consistent with those obtained for the first cycle.
Figure 6 shows the normalized sum of intensities (SOI) of the gauche and trans components of the C–Sthiol stretch as a function of potential for the additive systems considered. This SOI relates to potential-dependent changes in the relative concentration of surface-adsorbed SPS. Plots made using integrated peak areas were nearly identical. Figure 6A shows the SOI obtained for SPS in VMS decreases from 1 to 0.6 throughout the cathodic sweep and further decreases to 0.5 at the start of the anodic sweep. The value returns to 0.9 towards the end of the cycle. The plot clearly shows that the SOI decreases most abruptly between 0.2 V and 0.15 V. In contrast, the SOI decreases slightly from 0.7 to 0.6 as the electrode potential is decreased below 0.1 V.

Figure 6. Normalized sum of baseline-corrected peak intensity of the gauche and trans C–Sthiol stretch (gauche to trans) of SPS as a function of potential for systems comprised of 34 ppm SPS + 100 ppm of an amine-based leveler + VMS (A), and 34 ppm SPS + 100 ppm of an glycol-based suppressor + VMS (B). For comparison, normalized sum of intensity traces for SPS alone in VMS are also plotted in A and B.
Download figure:
Standard image High-resolution imageFigure 6A also shows the potential-dependence of the SOI for systems comprised of VMS + SPS + amine-based levelers. The figure shows the SOI obtained for these systems exhibit marked differences relative to each other and VMS+SPS. The SOI obtained for the EDA-containing system fluctuates between 1.0 and 0.8 through the cathodic sweep and remains at 0.8 through most of the anodic sweep. In contrast, the SOI obtained for PEI- and TETA-containing systems increases from between 0.4 and 0.6 to a maximum value as the potential is decreased from 0.35 to 0 V. The SOI then decreases to 0.3 through the remainder of the cathodic sweep and remains relatively low throughout the reverse anodic sweep. In comparison to the SOI obtained for SPS alone, values obtained for the EDA-containing system are consistently higher, while values obtained for PEI- and TETA-containing systems are lower throughout most of the voltammetry. These trends in SOI (SPS alone > EDA > TETA > PEI) were also present in the first cycle data.
Figure 6B shows the SOI obtained for solutions containing VMS + SPS and glycol-based suppressors. The figure shows there is virtually no difference in SOI obtained for the VMS+SPS system and any of the glycol-containing systems. This result again suggests that the presence of glycol-based inhibitors do not affect the potential-dependent adsorption of SPS. These trends in SOI (SPS alone ≈ EG ≈ TEG ≈ PEG) were also observed for the first cycle data.
We next examine the effect of additive inclusion on the potential-dependent intensity of band b in Fig. 7, the Cu–Cl stretch. Figure 7 shows the normalized, baseline-corrected intensity of the Cu–Cl stretch of the additive ensembles. In SPS alone, the Cu–Cl band intensity is high at positive potentials and then decreases as the potential is made more negative. Figure 7 shows that this normalized intensity exhibits relatively little hysteresis with respect to potential.
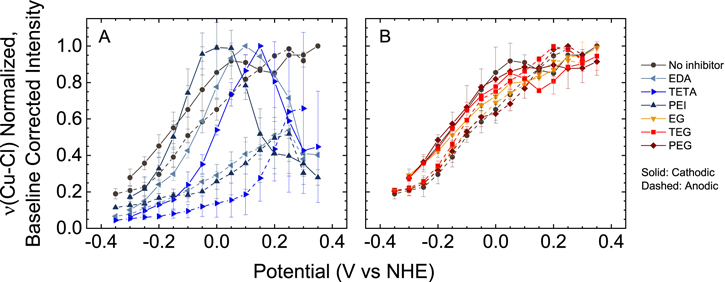
Figure 7. Normalized, baseline-corrected peak intensity of the Cu–Cl stretch as a function of potential for systems comprised of 34 ppm SPS + 100 ppm of an amine-based leveler + VMS (A), and 34 ppm SPS + 100 ppm of an glycol-based suppressor + VMS (B). For comparison, Cu–Cl stretch intensity traces for SPS alone in VMS are also plotted in A and B.
Download figure:
Standard image High-resolution imageFigure 7A shows the potential dependence of the normalized Cu–Cl band intensity in systems containing VMS + SPS and amine-containing levelers. The plot shows that this normalized intensity starts low, achieves a maximum at between 0 V and 0.15 V (depending on the leveler) during the cathodic scan, and then decreases at more negative potentials. Interestingly, the plots of normalized intensity exhibit substantial hysteresis in the presence of the leveler, with increased Cu–Cl intensity occurring only at very positive potentials on the anodic scan.
Figure 7B shows the potential dependence of the normalized intensity of the Cu–Cl stretch for VMS + SPS and VMS + SPS and the glycol suppressors. The addition of the glycol-based inhibitor has little effect on the normalized Cu–Cl intensity relative to SPS alone.
Figures 8A and 8B show the in situ SCV SERS spectra obtained from Cu immersed in solutions consisting of VMS + 100 ppm PEI 2500 and VMS + 100 ppm PEG 2000, respectively, in the region of the methylene stretch (ν(CH2)). The spectra in Fig. 8A shows the presence of symmetric (νs ) and asymmetric (νas ) stretching modes of the methylene groups of PEI, labeled α and β, respectively. The observed energies for these bands are in agreement with those previously reported for PEI adsorbed on an Ag sol. 51 The spectra in Fig. 8B show the presence of three distinct modes from the methylene groups of PEG, labeled γ, δ, and ε, which are assigned to νs (CH2), PEG CH2 stretch affected by solvent interactions, and νas (CH2), respectively. 21
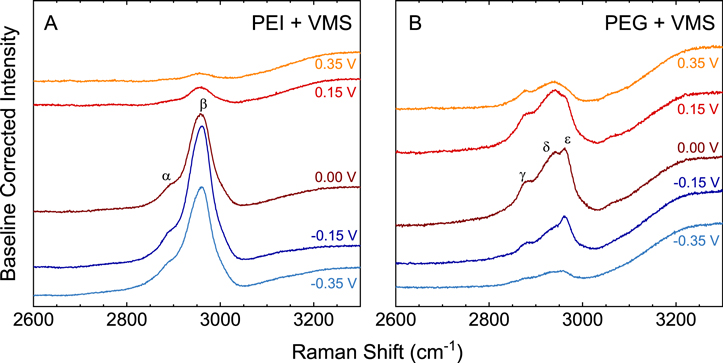
Figure 8. In-situ SERS spectra obtained during cathodic polarization in an electrolyte consisting of VMS+100 ppm PEI 2500 (A) and VMS+100 ppm PEG 2000 (B).
Download figure:
Standard image High-resolution imageFigure 9A shows plots of normalized, baseline-corrected intensity of the νas (CH2) as a function of potential obtained for PEI 2500 + VMS. The figure shows the intensity of the CH2 stretch increases as the potential is swept negative from 0.35 V to −0.15 V. Below −0.15 V and throughout the positive-going sweep, the normalized intensity gradually decreases.

Figure 9. Normalized, baseline-corrected peak intensity of the asymmetric CH2 stretch as a function of potential for systems comprised of 100 ppm PEI 2500 + VMS (A) and 100 ppm PEG 2000 + VMS (B). Normalized, baseline-corrected peak intensity of the Cu–Cl stretch as a function of potential for systems comprised 100 ppm PEI 2500 + VMS (C) and 100 ppm PEG 2000 + VMS (D).
Download figure:
Standard image High-resolution imageFigure 9B shows the normalized, baseline-corrected intensity-potential trace of the νas (CH2) obtained for PEG 2000 alone. During the cathodic sweep, the normalized intensity of the CH2 stretch increases from 0.3 to 1 as the potential approaches 0.05 V. The normalized intensity decreases to 0.2 through the remainder of the cathodic sweep. During the anodic sweep, the intensity of the νas (CH2) remains relatively low, exhibiting a local maximum of approximately 0.5 at −0.15 V.
Figure 9C shows the normalized, baseline-corrected intensity of the Cu–Cl stretch obtained from the VMS + PEI 2500 solutions. The figure shows the Cu–Cl stretch intensity increases from 0.2 to 1 as the potential decreases from the start of the cathodic sweep to 0 V. As the potential is swept negative of 0 V, the normalized intensity decreases to 0.3 by the end of the cathodic sweep. The intensity then gradually increases to 0.9 as the potential is swept back to 0.3 V during the anodic sweep.
Figure 9D shows the plots of normalized intensity of the Cu–Cl stretch vs potential obtained for the VMS + PEG 2000 solutions. During the cathodic sweep, the normalized intensity reaches a maximum of 1 at 0 V, obtaining a value of 0.2 and 0.1 at the positive and negative extrema of the sweep, respectively. The intensity of the Cu–Cl stretch remains low throughout the anodic sweep, reaching a local maximum value of 0.5 at −0.15 V.
Potential dependent SER spectra of all electrolyte solutions considered here are shown in Fig. S1. As observed in spectra obtained from VMS+SPS and PEI, spectral assignments are primarily attributed to Cu–Cl and internal SPS vibrational modes, indicating SPS is adsorbed to the surface.
SIMS analysis
Table I shows the effect of different solution compositions on the concentration of elements C, S, Cl, and O incorporated into the Cu electrodeposit. SIMS signal intensities are reported as an average taken from depths between 0.5 and 1.5 μm to avoid surface effects, consistent with prior literature. 38
Table I. SIMS data obtained from electrodeposits.
| Content (ppma) | ||||
|---|---|---|---|---|
| Solution composition | C | S | Cl | O |
| PEG + VMS | 1885 | 24 | 3416 | 1629 |
| PEI + VMS | 1986 | 53 | 3234 | 823 |
| PEG + SPS + VMS | 13 | 3 | 4 | 10 |
| PEI + SPS + VMS | 3269 | 478 | 4152 | 809 |
For Cu deposited from solutions consisting of PEG+VMS, greater O signals are observed relative to those found for other deposits, while large C and Cl signals and some S signal are also observed. This indicates PEG, chloride, and sulfate from solution are all incorporated into the electrodeposit, as reported previously for solutions consisting of the same components. 38 Similarly, when PEI + VMS was used as the electrodeposition solution, large C, and Cl signals and some S signal were observed, while substantially less O signal was found relative to PEG + VMS. This indicates that PEI, chloride, and sulfate are incorporating from these solutions into the electrodeposit. The incorporation of an N-containing leveler, along with Cl–, from a solution of similar composition was reported previously. 39
In solutions consisting of PEG + VMS + SPS, relatively little C, S, O, or Cl signals were observed, consistent with previous work. 38 This indicates that, in the presence of SPS, neither PEG or SPS are incorporated, which is consistent with the idea that PEG is displaced by SPS on the electrode surface and SPS "floats" on the surface of the growing Cu deposit. 26 In contrast, addition of SPS to the PEI + VMS solution results in a S signal nearly an order of magnitude higher than that found with any of the other solutions. This increased signal suggests that SPS is being incorporated into the Cu electrodeposit. The increased C signal in the PEI + SPS + VMS solution relative to PEI+VMS suggests that both SPS and PEI are incorporated into the deposit, likely as a result of PEI-SPS/MPS complex formation.
Discussion
The data presented above reveal that the constituent functionality and molecular weight of the inhibitor affects its inhibitory performance in the electrolytic deposition of Cu in electrolytes containing SPS. Additionally, the change in inhibition affects the gauche/trans ratio and SOI of adsorbed SPS, with the more strongly inhibiting amine-based leveler showing decreased gauche/trans ratios and SOI. Finally, significant co-deposition of PEI and SPS, likely in the form of a PEI-SPS/MPS complex, was observed only in Cu deposited from solutions consisting of these components.
The chronopotentiometry data presented above show that the potential for Cu reduction is influenced by the additives present in the Cu electrodeposition solution. The addition of both amine-based and glycol-based inhibitors resulted in a potential decrease, indicating the presence of an inhibitory response. The magnitude of inhibition correlates with the molecular weight and functionality of the inhibitor additive. For a given molecular weight with SPS present in the plating bath, the inhibitory performance of the amine levelers was superior to that of the glycol suppressors, even for low molecular weight molecules.
Substantial inhibition was observed for amine-based levelers TETA and PEI in the absence of SPS, indicating that the leveler functions as an inhibitor in the absence of SPS. Inhibition by the leveler in the SPS-absent electrolyte has been previously attributed to adsorption of the leveler possibly as a result of ion pairing interaction of the cationic amino functional groups of the lever and other amine-based molecules with specifically-adsorbed anions. 11,35,52,53 In agreement with this literature, the normalized intensity-potential traces of the Cu–Cl stretch and ν(CH2) obtained for the PEI+VMS (absent SPS) solution are well correlated at potentials above −0.2 V, suggesting that potential-dependent adsorption/desorption processes of both PEI and Cl– are coupled in the absence of SPS. The normalized intensity of the Cu–Cl stretch decreases further than that of ν(CH2) at negative potentials, indicating that PEI remains adsorbed at the potentials where Cl– desorbs. This contrast in normalized intensities between PEI and Cl– at more negative potentials is attributed to electrostatic attraction of PEI to the increasingly negative electrode or ion-pairing interaction with specifically adsorbed sulfate, which may persist adsorbed to the surface at more negative potentials then does Cl–. 49 Previous reports suggest that the leveler adlayer physically occludes cuprous and cupric ion species from access to the electrode. 35
The chronopotentiometry data presented above shows PEG inhibition performance in the absence of SPS to be superior even to that of PEI, consistent with prior reports. 11,25 In contrast, the inhibitory responses of lower molecular weight EG and TEG in the absence of SPS were significantly lower relative to PEG. The intensity-potential traces of the Cu–Cl stretch mirrors that of the νas (CH2) obtained for the PEG+VMS, indicating PEG adsorbs to the surface only in the presence of the Cu–Cl adlayer, as shown previously. 23,28 Some literature suggests glycols strongly inhibit via formation of a polyether-Cu–Cl complex, which blocks surface sites for Cu reduction. 22,27 Inhibition by PEG in the presence of Cl– has been otherwise associated with increased affinity of PEG for the surface relative to the chloride-free Cu surface, resulting in an adsorption configuration wherein the alkyl moieties of PEG face the hydrophobic Cu–Cl adlayer. 29,54
In the presence of SPS, the magnitude of inhibition is associated with inhibitor functionality. The addition of PEI with SPS already present in solution resulted in a potential decrease of greater magnitude than that observed for PEG, which is consistent with previous literature. 11,25 Similarly, TETA exhibited greater inhibition than TEG. This difference in inhibitory response indicates the inhibitory performances of the amine-based levelers were superior to that of the glycol-based suppressors in the presence of SPS.
To further contrast the inhibitory effect of amine-based levelers and glycol-based suppressors in the presence of SPS, we next discuss potential changes induced by the addition of SPS to the inhibitor-containing electrolyte. The observed potential increase from the addition of SPS to the PEG-containing electrolyte was markedly greater than that observed for the addition of SPS to the additive free base electrolyte. This increased depolarization upon addition of SPS has been attributed to competitive adsorption which leads to eventual displacement of the glycol suppressor complex by SPS, as reported elsewhere. 11,12,30
In contrast to PEG, the addition of SPS to the PEI-dosed electrolyte does not result in cathodic depolarization, in accordance with previous reports. 25 This contrast in the potential response upon addition of SPS highlights a fundamental difference in the inhibitory effect of amine-based PEI and glycol-based PEG. 11 The absence of depolarization from SPS addition indicates that the leveler deactivates the acceleration effect of SPS. Previous literature suggests the inhibitory effect of PEI in the presence of SPS is attributed to a deactivation of SPS acceleration via the formation of bulk MPS-Cu(I)-PEI adduct 25 and increased affinity of PEI for the SPS-decorated surface. 11 However, the deactivation of interfacial SPS by PEI, which has been suggested previously, 32 cannot be ignored.
The gauche/trans ratio of the C–Sthiol bond, which reports on the conformational state of SPS, provides an explanation for the origin of inhibition of amine-based levelers in the presence of interfacial SPS. In particular, inclusion of the leveler leads to significantly greater preference for the trans conformation of SPS relative to SPS alone. Notably, the greatest preference for the trans conformer was observed when PEI, which is the strongest inhibitor, was present in the electrolyte. In contrast, addition of the glycols resulted in no change in the gauche/trans ratio of the C–Sthiol bond.
The sulfonate head group of SPS is furthest from the surface in the trans conformational state, as established by early SERS investigations on alkanethiols. 44 Interestingly, the C-SO3 vibrational stretch band position may change slightly with potential for glycol-based systems, but no change is seen in the presence of the amines, consistent with the greater R-SO3 distance from the electrode in the presence of the amines (Fig. S2). The sulfonate head group facilitates the removal of the Cu2+ solvation shell and consequently helps catalyze the overall reduction of Cu. 20 Consequently, an increased distance between the surface and the sulfonate, as indicated by greater trans character, leads to suppressed Cu2+ reduction rates. Previous reports suggest that the interaction between the leveler and accelerator is mediated by ion pairing of oppositely charged sulfonate and amine moieties. 11,32,35 We note that in systems containing a leveler, not all the surface-adsorbed SPS exists in the trans state, showing that SPS may still be providing some acceleration. We also note that while EDA exhibits gauche/trans ratios similar to that of PEI, it also provides little if any inhibition.
Identical gauche/trans ratios and SOIs obtained for glycol systems and SPS alone indicate glycols and SPS do not interact at the Cu surface. Further, these data imply that SPS is not involved in the mechanism of suppression caused by the presence of a glycol. Chronopotentiometry data presented here shows that the inhibitory effect of PEG shows a marked decrease upon injection of SPS due to the displacement of PEG by SPS. 11,12 SIMS results of Cu electrodeposited from PEG + SPS + VMS solutions show little if any incorporation of PEG or SPS while the use of PEG + VMS as the electrodeposition solution led to substantial co-deposition of PEG, further indicating SPS displaces PEG at the surface.
The plots of SOI of gauche and trans C–Sthiol stretches provide further insight into the effects of the inhibitor on SPS. In the presence of glycol-based additives or SPS alone, the SOI decreases between 0.3 and 0.1 V and then is relatively constant. 16,26 SIMS analysis shows there is no SPS incorporated into the deposit. Thus, the origin of the SOI decrease observed for SPS+VMS or SPS+VMS+PEG solution is not associated with SPS incorporation into the deposit. The SOI decrease at the relatively positive potentials could instead be a result of SPS desorption. The relatively constant SOI observed at potentials below 0.1 V in either SPS+VMS or in SPS+VMS + glycol-based additives indicates the relative concentration of surface-adsorbed SPS changes minimally below 0.1 V.
In the presence of EDA, the SOI changes minimally, indicating that the interaction of EDA with SPS does not result in a potential-dependent change in the surface concentration of SPS. This suggests that, although a fraction of SPS may be less catalytically active, as suggested by the gauche/trans ratio in the presence of EDA, sufficient surface coverage of SPS sustains the overall catalytic effect observed for solutions containing both SPS and EDA. Indeed, the absence of an inhibitory response from the addition of EDA to the SPS-containing solution shows that SPS maintains its catalytic activity (Fig. 2A).
In contrast, the SOI obtained for TETA- and PEI-containing solutions decreases at potentials negative of −0.2 V. Moreover, signal intensities remain low during the reverse anodic sweep, indicating that SPS does not reversibly segregate to the surface once the concentration of SPS at the surface decreases at negative potentials. SIMS analysis of Cu electrodeposited from the PEI + SPS + VMS solution indicate that, in the presence of PEI, SPS incorporates into the deposit. This incorporation of SPS is likely the origin of the decreased SOIs seen with PEI (and, by extension, TETA). Further, the molar ratio of C to S in the deposit obtained from the PEI + SPS + VMS solution was 18:1, which is greater than the molar ratio of C to S in SPS (3:2). This indicates that a significant amount of the PEI was incorporated in addition to the SPS suggesting complexation between the two additives. 25 In sum, the SERS and SIMS results suggest the inhibitory function of polymeric ethyleneimines is comprised of both deactivation of SPS acceleration via conformational distortion and removal of SPS from the surface via incorporation into the electrodeposit.
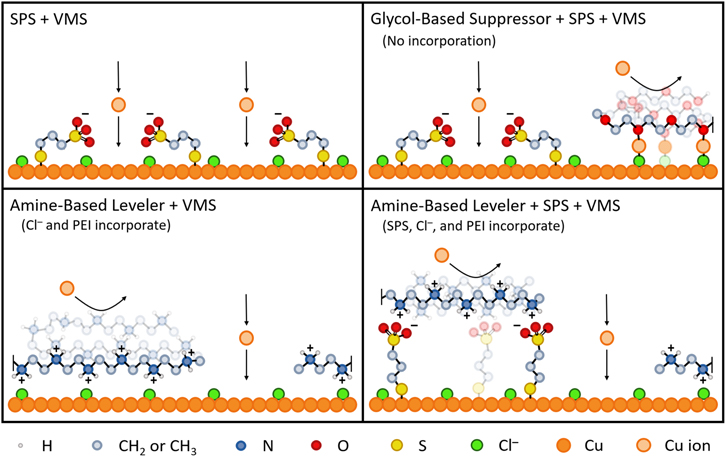
A schematic showing the state of SPS with and without the two classes of inhibitor considered here is shown in Fig. 10.
Figure 10. Schematic representation of additive interactions at a Cu surface in Cu electrodeposition electrolytes of different compositions.
Download figure:
Standard image High-resolution image
We next discuss how the conformational behavior of SPS is further influenced by the presence of surface-adsorbed Cl–. Gauche/trans ratio vs potential plots show that a decrease in potential leads to an increase in the gauche/trans ratio for all systems considered. Potential-dependent Cu–Cl stretch intensities displayed the opposite trend, indicating Cl– desorption as the potential is made negative, as shown here and reported previously. 14,18,49 These data clearly indicate that an increase in proximity of the sulfonate moiety of SPS to the surface (increased gauche character) is correlated with the potential-dependent Cl– desorption from the surface. We suggest the origin of this behavior is reduced repulsion between the negatively charged sulfonate and the surface, even at the negative potentials attendant this effect.
We also note that the potential-dependent gauche/trans ratio plots and the potential-dependent Cu–Cl stretch intensities exhibit substantially greater hysteresis in the presence of the amine-based levelers relative to SPS alone and SPS-glycol systems. Indeed, the gauche/trans ratios start low on the cathodic sweep and then remain relatively high on the return anodic sweep. At the same time, the Cu–Cl stretch intensity starts high but remains relatively low on the return. This observed hysteresis in the intensity of the Cu–Cl stretch also indicates that, once depleted of Cl– at negative potentials, the surface remains relatively free of Cl– in the presence of a leveler. The decreased intensities of the Cu–Cl stretch in the return sweep may arise from incorporation of Cl– into the electrode. SIMS results presented here indicate a much greater concentration of Cl– is incorporated into Cu deposited from PEI+SPS+VMS solution relative to the PEG+SPS+VMS solution. This incorporation of Cl– can also reasonably contribute to inhibitory effect of the amine-based leveler since surface-adsorbed Cl– is critical for SPS acceleration, as shown previously. 10
Conclusions
In the presence of SPS, moderate to high molecular weight amine-based inhibitors (levelers) exhibit greater inhibition compared to glycol-based inhibitors (suppressors) of similar molecular weight. While no inhibitory effect was observed for the EDA, a substantial inhibitory effect and a total deactivation of the accelerative effect of SPS was observed for PEI.
SPS evinces substantially more trans character in the presence of all amine-based levelers studied here relative to inhibitors consisting of glycol functionality. In the trans conformational state, the catalytic activity of SPS towards Cu reduction diminishes. The increased trans character in the presence of the ethylenimine inhibitor likely originates from electrostatic pairing between cationic amine functionality and the negatively charged sulfonate of SPS. Alternatively, the glycol inhibitor does not contain charged species and therefore does not interact with SPS, as indicated by its inability to effect conformational change to SPS.
A second origin of inhibition is the potential dependent removal of SPS from the surface in the presence of PEI. This removal is attributed to incorporation of SPS into the deposit in the presence of PEI. Alternatively, the glycol inhibitor does not affect the potential-dependent surface coverage of SPS nor was SPS incorporation into the deposit observed in the presence of PEG. This behavior again indicates the glycols do not interact with SPS. Finally, we note SPS is removed from the surface in the presence of high molecular weight amine-based levelers while it remains segregated to the surface in the presence of EDA, explaining the observed changes in the inhibitory effects of levelers as a function of molecular weight.
Finally, Cl– was found to incorporate into the electrodeposit from solutions containing PEI and SPS in greater amounts than those observed for solutions consisting of PEG and SPS, which is likely an additional contributor to the loss of catalytic activity of SPS in the presence of the polymeric ethylenimines.