
Abstract
D-serine has been implicated as a brain messenger with central roles in neural signaling and plasticity. Disrupted levels of D-serine in the brain have been associated with neurological disorders, including schizophrenia, depression and Alzheimer's disease. Electrochemical biosensors are attractive tools for measuring real-time in vivo D-serine concentration changes. Current biosensors suffer from relatively large sizes (≥25 μm) making localized cellular measurements challenging, especially for single cell studies. In this work, a robust methodology for the fabrication of a reproducible miniaturized 10 μm D-serine detecting amperometric biosensor was developed. The miniature biosensor incorporated yeast D-amino acid oxidase immobilized on a poly-meta-phenylenediamine modified 10 μm Pt disk microelectrode. The biosensor offered a limit of detection of 0.361 μM (RSD < 10%) with high sensitivity (283 μA cm−2 mM−1, R2 = 0.983). The biosensor was stable for over four hours of continuous use, demonstrated a storage stability of four days and high analyte selectivity. Biosensor selectivity was validated with LC-MS and interferences with yeast D-amino acid oxidase were evaluated using drugs believed to stimulate D-serine release. Ex vivo D-serine measurements were made from Xenopus laevis tadpole brains, demonstrating the utility of the biosensors for measurements on living tissue. We observed that D-serine levels in the brain fluctuate with sensory experience. The biosensors were also used in vivo successfully. Taken together, this study addresses factors for successful and reproducible miniature biosensor fabrication for measuring D-serine in biological samples, for pharmacological evaluation, and for designing point of care devices.
Export citation and abstract BibTeX RIS

This is an open access article distributed under the terms of the Creative Commons Attribution Non-Commercial No Derivatives 4.0 License (CC BY-NC-ND, http://creativecommons.org/licenses/by-nc-nd/4.0/), which permits non-commercial reuse, distribution, and reproduction in any medium, provided the original work is not changed in any way and is properly cited. For permission for commercial reuse, please email: permissions@ioppublishing.org.
Free D-serine is a commonly occurring D-amino acid, detected in many organisms from bacteria to mammals. 1,2 In the brain, D-serine is oxidized by D-amino acid oxidase (DAAO) 3,4 and has been identified for its role as a co-agonist of N-methyl-α-aspartate type glutamate receptors. 5–8 D-serine levels are disrupted in many neurological diseases including schizophrenia, depression and Alzheimer's disease, making it an important biomarker of diseased states. 9,10
Classical D-serine detection methods include immunostaining,
8
electrophysiology,
11
and analytical detection.
12
Many of these tools are indirect, time-consuming, costly, and lack quantitative information.
13,14
For example, D-serine concentration measurements in biological samples often rely on high-pressure liquid chromatography
15
and liquid chromatography-mass spectrometry (LC-MS)
16–18
based techniques.
19,20
While these methods offer high sensitivities, they are costly, require well trained users and do not allow for real time measurements.
21
Biosensors are a relatively low cost and simple alternative for quantitative D-serine measurements.
22–29
D-serine detection using electrochemical biosensors requires the specific reaction of DAAO immobilized onto a 10 μm poly-m-phenylenediamine (PPD) modified Pt microelectrode (ME) (Schematic
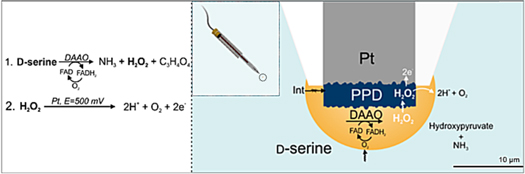
Schematic 1. D-serine detection strategy using a disk-shaped amperometric enzymatic. Left: Mechanism of D-serine detection. Step 1—D-serine reacts with immobilized Rhodotorula gracilis DAAO (RgDAAO) with tightly bound flavin adenosine dinucleotide (FAD), and is oxidized into hydroxypyruvate and ammonia in the presence of oxygen. Molecular oxygen oxidizes FADH2 back to FAD, producing equimolar H2O2. Step 2—The H2O2 diffuses through the permselective PPD layer, blocking out interferences (Int.), and is oxidized at the polarized Pt surface. Right: Schematic representation of the final biosensor tip geometry. Inset: Schematic of full biosensor geometry.
Download figure:
Standard image High-resolution imageWhile D-serine sensors of various shapes and sizes have been designed, 30–33 there is still significant demand to further miniaturize these sensors for minimally invasive recordings. We previously demonstrated larger biosensor application to probe D-serine release from Xenopus laevis brains where the ventricular and pial surfaces of the optic tectum were exposed to the biosensor. 34 Due to the larger biosensor size, it was not possible to implant the biosensor directly in the brain of a live intact animal. Improving the ability to more precisely localize physiological changes in D-serine levels is tied to the spatial resolution of these sensors and remains vital for studies investigating the mechanisms regulating D-serine release and uptake.
The goal of this work is to demonstrate that miniaturized electrochemical biosensors may be applied for in vivo D-serine detection in Xenopus as well as for single cell imaging. We present the development and comparison of a biosensor that is two orders of magnitude smaller than previously reported. The stability, sensitivity, reproducibility, optimal storage conditions and applicability of this biosensor are reported. We also identified pharmacological drugs thought to simulate D-serine release that interfere with DAAO. Results were validated using electrospray ionization-liquid chromatography-mass spectrometry (ESI-LS-MS).
To deduce biologically relevant information from biosensor application in complex biological environments, Xenopus laevis tadpoles were used as a vertebrate model, where D-serine has been shown to play an important role in promoting synapse maturation. 35 The biosensor was used ex vivo to determine if D-serine levels in the tadpole brain fluctuate across the day, a finding recently reported in mice. 36 Biosensor application in Xenopus brain confirmed circadian fluctuation of D-serine levels, especially during light-to-dark transitions when tadpole locomotor activity was found to be increased. Following biosensor response validation with complementary LC-MS experiments, the first-ever reported biosensor measurement inside the brain of live Xenopus was performed, suggesting these biosensors as a promising method for studying the mechanisms underlying D-serine release in Xenopus in vivo as well at the single cell level.
Materials and Methods
Materials and chemicals
Calcium chloride, calcium nitrate, glucose, HEPES, magnesium chloride, magnesium sulfate, potassium chloride, sodium chloride, and sodium bicarbonate were purchased from VWR (Mississauga, Canada). All other reagents were purchased from either Fisher Scientific (Ottawa, Canada) or Sigma-Aldrich (Oakville, Canada).
Enzyme preparation
Recombinant Rhodotorula gracilis DAAO wild type (RgDAAO WT, EC 1.4.3.3) was overexpressed in Escherichia coli cells and purified to homogeneity as previously reported. 37 The final enzyme solution was concentrated to 56.8 mg.ml−1 protein in phosphate-buffered saline (PBS, 0.01 M, pH 7.4) containing 1% glycerol and 25 mg.ml−1 bovine serum albumin (BSA). Pure RgDAAO had a specific activity of ≈75 U·mg−1 on D-serine based on an oxygen consumption assay.
Microelectrode preparation and characterization
MEs were fabricated according to a published protocol 38 using carbon fibre (d = 7 or 10 μm) or platinum wire (d = 10 or 25 μm) (Goodfellow, Huntington, U.K.). The glass portion of the final ME tip was removed with a No.10 surgical scalpel blade (Sigma). The resulting tip was mechanically polished (240 rpm, 4000 grit Silicon carbide grinding paper, 10 min) using a TegraPol-25 grinder/polisher (Struers Ltd., Mississauga, Canada) to expose the Pt disk-shaped surface. The ME was then washed and sonicated in 18.2 MΩ water, 70% ethanol, and acetone. The Rg of the MEs, defined as the ratio of the radius of the entire ME (glass + fiber) to that of the ME fiber was characterized optically using a customized Axio Vert.A1 inverted microscope. The fabricated electrodes had an Rg between 2–3. The roughness factor (Rf) of the MEs associated with the polishing protocol was determined by cyclic voltammetry in degassed (N2 bubbling) 1 M H2SO4 according to a published protocol (0.02 Vs−1, −0.30 V–0.75 V vs commercial saturated mercury-mercurous sulfate reference electrode, CH instruments USA). 39
Pt microelectrode surface modification and stability
The Pt surface was coated with 100 mM PPD in PBS (0.01 M, pH 7.4) through cyclic voltammetry-based electropolymerization (5 cycles, −0.10 V to +1.0 V, 0.10 V s−1). To remove residual surface bound monomer, the PPD-ME was cycled in PBS (20 cycles, −100 to 0.5 V, 0.10 V s−1). For PPD stability testing, the PPD-ME was subjected to an electrochemical stress test in 100 μM H2O2 for over 300 cycles using cyclic voltammetry. The long-term stability of the PPD layer under dry storage at 4 °C was examined using chronoamperometry where the response to the oxidation of 10 μM H2O2 (0.5 V) was monitored over a period of four weeks.
Final biosensor fabrication
To fabricate the full biosensor, 2 μl of RgDAAO (56.8 mg ml−1 in 25 mg ml−1 BSA) was dropcasted onto a polydimethylsiloxane (PDMS) coated glass slide (2-part kit, SYLGARD 184 Silicone Elastomer, Dow Chemicals). This was done to improve the hydrophobicity of the surface to facilitate enzyme deposition onto the PPD-ME tip. The PPD-ME was immersed in the enzyme droplet for five seconds and then removed to dry for 4 min. This was repeated four times until approximately 0.5 μl of enzyme had adsorbed onto the PPD-ME surface. The biosensor was then placed in a desiccator containing 10 ml of glutaraldehyde (50% v/v in H2O) to vapor crosslink the RgDAAO for 10 min. Null biosensors were produced using the exact same protocol described above with the exception of the RgDAAO enzyme. The biosensors were left in PBS for 20 min to stabilize the electrochemical signal and rehydrate the enzyme/PPD layers before use.
LC-MS validation experiments
For biosensor validation with LC-MS, conditioned medium (CM) from ATP-stimulated ex vivo brain preparations were derivatized with Marfey's reagent according to modified version of a literature protocol. 40 Briefly 50 μl of each sample was derivatized with 25 μl 0.5% Marfey's reagent (wt/vol in acetone) and 50 μl 0.125 mol l−1 anhydrous disodiumtetraborate (in milli-Q-water) for 30 min at 40 °C under drying with a nitrogen steam. The reaction was stopped by addition of 12.5 μl 4 M HCl. The resulting solution was diluted (1:10) with eluent buffer (250 mg ammonium formate in 1 L milli-Q-water; pH adjusted to 4.6 with formic acid). The resulting sample was centrifuged (BioRad, 4000 rpm, 10 min) and 10 μl of the supernatant were subjected to LC-MS using electrospray ionization (ESI) in negative ion mode. MassLynx software, which included QuanLynx (Waters), was used for instrument control, data acquisition, and data processing to obtain the area under the curve of the peaks and their retention times. Full instrumentation details are provided in the SI.
Chromatographic conditions
Samples were chromatographically resolved on Waters BEH C18 UPLC column (130 Å, 1.7 μm, 1 × 100 mm) using a 4 mM ammonium formate (mobile phase solvent A, pH = 4.6)/acetonitrile (solvent B) system with a linear gradient of 3%-100% solvent B applied over 10 min. The flow rate was 50 μl min−1.
Mass spectrometric conditions
A triple quadrupole mass spectrometer (Waters) was used in the negative electron spray ionization (ESI) mode. For analysis, extracted ion chromatograms were generated using the ![${\left[M-H\right]}^{1-}$](https://content.cld.iop.org/journals/1945-7111/168/2/025502/revision3/jesabe348ieqn1.gif) ion of the dinitrophenyl-L-alanine-amide (Marfey) adduct of serine (m/z 356.1). Raw m/z values were corrected with a Leu-enkephalin external standard.
ion of the dinitrophenyl-L-alanine-amide (Marfey) adduct of serine (m/z 356.1). Raw m/z values were corrected with a Leu-enkephalin external standard.
Husbandry
All procedures were approved by the Animal Care Committee of the Montreal Neurological Institute at McGill University in accordance with Canadian Council on Animal Care guidelines. Albino Xenopus laevis frogs (RRID:NXR_0.0082) were injected with human chorionic gonadotropin (Sigma) and pregnant mare serum gonadotropin (Sigma) to induce mating. Eggs were collected and raised in 0.1x Modified Barth's Solution with HEPES (MBS-H; 88 mM NaCl, 1 mM KCl, 2.4 mM NaHCO3, 0.82 mM MgSO4 7H2O, 0.33 mM Ca(NO3)2, 4H2O, 0.41 mM CaCl2, 10 mM HEPES, pH 7.4). Animals were raised under a 12-h/12-h light-dark cycle at 20 °C until stage 48. All animals were reared under these conditions unless otherwise stated.
Electrochemical experiments
Electrochemical measurements were performed using either an Electrochemical Probe Scanner 3 (ELP3, Heka Elektronik, Lambrecht, Germany, bipotentiostat model PG340) or an Axopatch 200B amplifier (Molecular Devices, Sunnyvale, U.S.A.) enclosed in a Faraday cage and on a vibration dampening table (Micro 60, Halcyonics, Ames, IA, USA). All potentials were recorded relative to an in-house fabricated chloridized silver wire quasi-reference electrode at room temperature. 38 To select the potential of H2O2 oxidation in the amperometry experiments, the onset of H2O2 oxidation was determined using cyclic voltammetry (0.10 V.s−1, 0−1.0 V, 20 cycles). To confirm the selectivity of the PPD-ME backbone towards H2O2 over other interferences, chronoamperometric measurements were performed (+0.5 V vs Ag/AgCl). To confirm the effect of drugs used for evoked D-serine release, PPD-MEs were used.
The full biosensor was calibrated in vitro against 0–50 μM D-serine in PBS (0.01 M, pH 7.4) using chronoamperometry (5 min, 0.5 V). Fully fabricated biosensors were also tested for their storage stability post application in six hour-long experiments. The sensors were stored either dry or in PBS at 4 °C or in PBS and calibrated against standard solutions of D-serine (0–50 μM, in PBS, pH = 7.4).
ELP 3 data was collected at a sampling frequency of 100 Hz and analog filtered (Current: Bessel 0.067 kHz, Voltage: 10 Hz, Stimulus: 1 kHz, Notch Filters: On). A smoothing digital filter was applied pre-data processing. All presented potentials are against a silver/silver chloride (Ag/AgCl) reference electrode.
Brain preparations and ex vivo measurements
Following anesthesia by immersion in 0.02% MS222 0.1 × MBS-H were dissected out from stage 48 tadpoles at different times of the day. Five brains were dissected at each time point and placed in a single Eppendorf with 200 μl artificial cerebrospinal fluid (aCSF), containing 115 mM NaCl, 2 mM KCl, 3 mM CaCl2, 3 mM MgCl2, 5 mM HEPES, 10 mM glucose, at pH 7.4. The brains were incubated for 90 min prior to electrochemical D-serine detection. To explore the effect of ATP stimulation on D-serine release, 1 mM adenosine triphosphate (ATP) was added to the aCSF prior to incubation.
A separate set of tadpoles were raised in complete darkness for 7–8 d. To study the effect of light on these animals, a group was subjected to two hours of light. Brains were dissected from the two groups at the same time and each sample was incubated for 90 min prior to electrochemical D-serine detection. Prior to electrochemical detection, biosensors were calibrated in standard solutions of 0–25 μM D-serine.
Recording Xenopus laevis Tadpole behaviour
Stage 48 tadpoles were tested individually in 6-well microtiter plates. The movement of each tadpole was monitored with a DanioVision Observation Chamber for 1 h (Noldus Information Technology). The experimental set-up provided visible (430–700 nm) and infrared (800–950 nm) light and was manually changed every 10 min to record the behavior in either light or dark, respectively. Video was recorded from a Basler GenICam (Basler acA1300-60) that fed into a standard PC (Dell Precision Tower 3620) for real-time tracking. Ethovision XT 13 (Noldus Information Technology) was used to extract locomotion data including distance travelled and velocity. The sampling rate was 25 frames per second. Statistics were averaged between the 6-wells over multiple days of experiments (n = 5 experiments) monitored at the same time of day.
Whole animal preparations and in vivo measurements
Tadpoles were immobilized by immersion in 0.2 mM pancuronium bromide in 0.1 MBS-H rearing solution and placed in HEPES-buffered extracellular saline. The animal was pinned to a Sylgard block and a small incision was made in ventricle space at the caudal optic tectum to allow for biosensor placement in the brain tissue. While pinned to the Sylgard, the animal was placed in recording chamber with room temperature aCSF.
A Narishige micromanipulator was used to immerse the biosensor, held at a constant potential of 0.5 V, in aCSF and away from the animal in the recording chamber. The biosensor stabilized in aCSF for 10–15 min in this configuration prior to implanting the biosensor into the brain tissue. After 10 min of biosensor electrochemical signal recording in the brain tissue, the animal was simulated with light pulses for 5 min. The electrochemical signal was recorded inside the animal brain for a period of 10 min. Similar experiments were also repeated with null sensors. Close attention was paid to ensure that the angle and orientation of the biosensor were consistent between experiments.
Data analysis and statistics
Data sets were analyzed using Matlab R2016a (Mathworks, Natick, U.S.A. Results). Matlab was also used to generate figures. Error propagation calculations were performed with in-house Matlab code. The steady state current (iss) is defined as the maximum current response at which the current is static. Data are presented as mean ± standard error of the mean (S.E.M). n values refer to the number of individual experiments. ne refer to the number of individual electrodes. Normalized current values (inorm) are presented as blank corrected currents. Digital filtering of the electrochemical data to remove noise was performed using a smoothing digital filter on Matlab (Savitzky-Golay).
The limit of detection (LOD) is defined as 3 times the standard deviation of the blank divided by the slope of the regression line. The limit of quantitation (LOQ) is defined as 10 times the standard deviation of the blank divided by the slope of the regression line. The relative standard deviation (RSD) is defined as the standard deviation of the mean divided by the mean value times 100. Comparisons between two groups were performed using the Student's t-test (significance level of p < 0.05).
Results and Discussion
Backbone sensor miniaturization and characterization
Single mammalian brain cells are between 4–100 μm in diameter. 41 Previous electrode designs for D-serine detection are no smaller than 80–100 μm in diameter post-enzyme immobilization, making it difficult to achieve localized single-cell measurements. 12 Moreover, in vivo measurements with larger sensors, especially cylindrical-shaped sensors, result in reduced sensor implantation accuracy 42 and increased stress associated H2O2 levels from tissue damage. 43–45 To explore whether biosensor miniaturization was feasible using the current design, disk-shaped MEs of different sizes (7–25 μm) and materials (platinum, carbon) were fabricated according to published protocol. 38 While platinum/iridium (Pt/Ir) alloy electrodes are also common materials for neural applications as shown in Table SI (available online at stacks.iop.org/JES/168/025502/mmedia), their high costs and difficulty to pull into smaller wires complicates the development of miniaturized disk-shaped biosensors.
Reducing the Pt diameter favors biosensor miniaturization (Fig. 1a) and improves current densities. Compared to 25 μm bare MEs, 10 μm MEs offered higher characterization current densities with a ratio of j25/j10 = 0.360 ± 0.057 (Fig. 1b). Increased current density of smaller electrode sizes is attributed to enhanced mass transfer 46 and reduced capacitive current. 47 Lower capacitive currents are tied to double layer charging and iR drops which result in reduced time constants and response time. 48
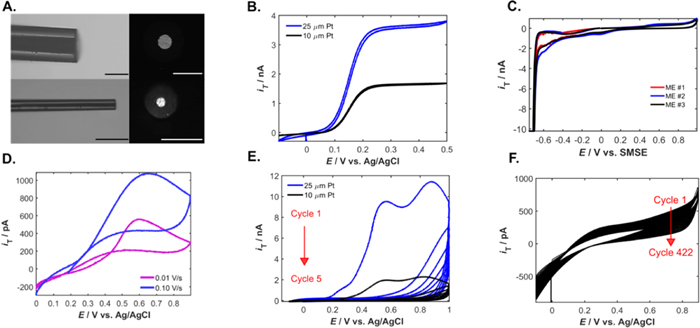
Figure 1. Fabrication and characterization of PPD-Pt MEs for H2O2 oxidation. (a) Optical micrographs show side and top views of the larger bare sensor (25 μm Pt) and the miniaturized bare sensor (10 μm Pt). All scale bars represent 50 μm. (b) Characterization of the Pt MEs in 1 mM FcMeOH (c) Cyclic voltammograms representing ME surface roughness characterizations in 1 M H2SO4. Each cyclic votammogram corresponds to a different ME. (d) Oxidation of 100 μM H2O2 with the 10 μm Pt MEs at 0.10 Vs−1 (blue) and 0.01 Vs−1 (purple). (e) Cyclic voltammograms representing the two electron electrodeposition of PPD on the Pt-ME surface. (f) Stress tests of PPD-Pt 10 μm MEs in 10 μM H2O2 (422 cycles).
Download figure:
Standard image High-resolution imageTo ensure biosensor reproducibility, the roughness factor (Rf) of the bare MEs was characterized in 1 M H2SO4 (Rf = 3.89 ± 0.3). Challenges in increasing surface roughness with mechanical polishing emerge as the electrode size is decreased, 49 making it difficult to roughen electrodes further while maintaining electrode reproducibility.
Moreover, while carbon is an attractive catalytic material due to its low cost and electrical properties, 50 cyclic voltammograms and chronoamperometric measurements in H2O2 demonstrate limited electrocatalytic activity of carbon towards H2O2 oxidation (Fig. S1). Pt MEs, surpass carbon electrocatalytic activity towards H2O2 oxidation (Fig. 1c). CVs of 10 μm bare Pt MEs in 100 μM H2O2 show a H2O2 oxidation onset potential between 0.5–0.6 V (Fig. 1d), also observed with 25 μm bare Pt MEs (Fig. S2). Thus for H2O2 amperometric detection, 0.5 V (vs Ag/AgCl) was chosen as the oxidation potential.
Electrodeposition of the PPD layer onto the bare Pt MEs (Fig. 1e) demonstrated increased PPD layer thickness for the smaller MEs despite using the same electrodeposition protocol (5 cycles, 0.10 Vs−1, −0.10 V to 1.0 V) 34,51 as confirmed by the surface area normalized electrodeposition charge ratio (Q25/Q10 = 0.771). However, reducing the number of PPD cycles from 5 cycles to 3 cycles did not positively impact the H2O2 sensitivity of the PPD-modified ME (Fig. S3b). Following PPD deposition, PPD film stress tests of the modified Pt ME with cyclic voltammetry in 10 μM H2O2 demonstrated high stability to PPD film delamination (Fig. 1f). Moreover, electrochemical cleaning post PPD deposition through cyclic voltammetry in PBS was performed to remove all the residual monomer on the PPD-modified ME surface (Fig. S3a). When stored for a period of four weeks under dry conditions at 4 °C, the PPD film is stable towards the oxidation of 10 μM H2O2 (Fig. S3c).
Decreasing the electrode size does not significantly impact its selectivity 52 as confirmed by the PPD-ME response to common neurological interferences tested at physiologically relevant concentrations (Fig. S4a). While the PPD layer blocks 83% of the H2O2 signal, the PPD- ME exhibits a preferential capacity to detect H2O2 amongst the other analytes tested post-PPD modification (Fig. S4b).
Enzymatic biosensor calibration, detection reproducibility and performance comparison
Although the biosensor backbone was miniaturized and characterized, the eventual success of the final design was not guaranteed. This is especially true with regards to enzyme loading, instrument sensitivity and overall biosensor limit of detection. More importantly, robust biosensor fabrication is essential for biosensor reproducibility.
The functionality and reproducibility of the final biosensor for D-serine detection was evaluated through use of fully constructed biosensors with fresh concentrated RgDAAO and glutaraldehyde (Fig. 2a). The full biosensor was fabricated and calibrated against standard solutions of 2.5−50 μM D-serine, a range appropriate for measurements of D-serine levels in the brain 34 (Fig. 2b). The LOD of the biosensor was 0.361 μM ± 0.08 (ne =7, interelectrode RSD = 6.614 < 10%). High biosensor reproducibility and robustness was achieved (82% success rate, ne = 9) using the final methodology outlined in the experimental section. Importantly, the biosensor's linear and stable response was best achieved by using fresh enzyme and glutaraldehyde. Prolonged enzyme storage (>1 year) and use of glutaraldehyde solutions not prepared on the day of the biosensor fabrication, led to unstable and nonlinear behavior (Fig. S5). The biosensor performance was also compared to that of previous (25 μm Pt backbone) and commercial designs (DSER Probe, Sarissa Biomedical) (Fig. 2c). It is worth noting that biosensor current responses decrease significantly with miniaturization, 34 such that the 10 μm biosensor is the miniaturization limit of biosensors with the same geometry and design.
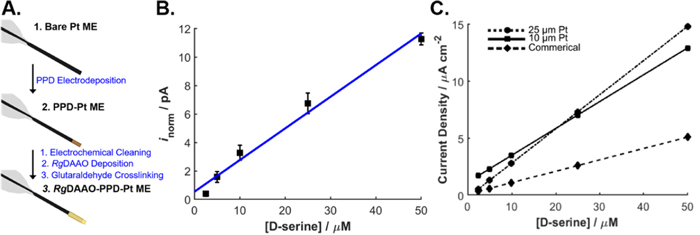
Figure 2. Biosensor development, in vitro characterization of the biosensor, and comparison to other designs. (a) Schematic illustration outlining the key steps in biosensor fabrication (b) Calibration curves for the steady state current corresponding to 0–50 μM D-serine. I (pA) = 0.223 × C (μM) + 0.537; R2 = 0.983, LOD = 0.361 μM ± 0.08, LOQ = 1.20 μM ± 0.03 (n = 7 individual biosensors). Currents were measured at constant potential (0.5 V). (c) Current density response towards 0–50 μM D-serine was measured with a commercially available cylindrical biosensor (dashed line), the experimental disk-shaped biosensor (dotted line) and the miniaturized disk biosensor (solid line).
Download figure:
Standard image High-resolution imageTo account for different backbone ME geometries and sizes, current was normalized to surface area and current density was used as a comparison parameter. Although the biosensor is smaller with respect to surface area, the miniaturized biosensor current density was similar to that of the 25 μm Pt backbone biosensors. The biosensor sensitivity was 283 ± 6 μA cm−2 mM−1 (ne = 7), demonstrating a performance comparable with other electrode designs (Table SI).
Moreover, optimal storage conditions for these biosensors was explored through wet and dry storage at 4 °C over a period of four days. Biosensors were calibrated in D-serine standard solutions each day and the resulting calibration curves are shown in Fig. S6. Wet storage of biosensors resulted in lack of biosensor stability (Fig. S6a) while dry storage of the biosensors resulted in a 55.2% ± 8% slope decrease over 24 h of storage. A slope decrease of 68.0 ± 8% after 72 h of storage from the original biosensor calibration curve slope prior to application and storage was also observed (Fig. S6c).
Biosensor evaluation of interferences of drug candidates used for evoked D-serine release
Glutamate, acting on α-amino-3-hydroxy-5-methyl-4-isoxazolepropionic acid (AMPA) type glutamate receptors as well as adenosine triphosphate (ATP) and norepinephrine (NE) have been suggested to activate a second-messenger signaling cascade in the brain that can induce the release of endogenous D-serine. 35,53–56 The ability of AMPA, ATP and NE to drive D-serine release makes them potentially useful candidates as positive controls when using the biosensor for endogenous D-serine release detection. However, their use is contingent upon the absence of any direct interactions with the electroactive Pt portion of the biosensor or the RgDAAO enzyme itself, which would produce nonspecific readings.
The biosensor responses in vitro demonstrate that NE, also a redox-active molecule, is a substrate of RgDAAO as noted by the increased iss representing elevated levels of H2O2 production (Fig. 3). Similarly, AMPA is a substrate for RgDAAO. RgDAAO has a higher activity on NE than on AMPA, ruling out NE as a drug to be applied in combination with an RgDAAO based biosensor. In previous work, AMPA has been used to experimentally evoke the release of D-serine 34 from the brain, but our findings in the absence of animals indicate that AMPA is a substrate for RgDAAO. In contrast, ATP was not found to generate a redox signal on its own or to promote production of H2O2 in the presence of RgDAAO enzyme, making it well suited for stimulation of endogenous D-serine release when using biosensors.
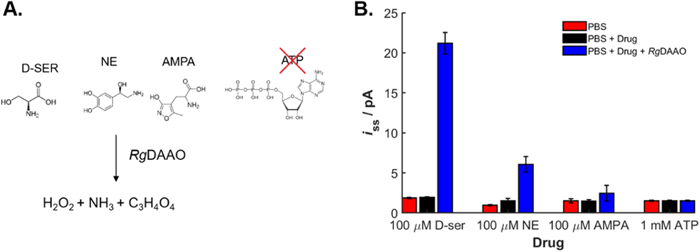
Figure 3. Activity of RgDAAO on pharmacological drugs (a) Chemical structure of tested molecules substrates of RgDAAO. ATP is not a substrate for RgDAAO reaction due to the large molecule size and structural dissimilarity of ATP. (b) A PPD-Pt ME as used to explore the effect of pharmacological drugs on the RgDAAO enzyme (0.142 mg ml−1) as compared to D-serine effect on RgDAAO. The steady state current was measured at 0.5 V in plain PBS (pH 7.4), after addition of the drug and of 0.142 mg ml−1 RgDAAO (n = 3, ±S.E.M.).
Download figure:
Standard image High-resolution imageBiosensor validation by LC-MS
To validate biosensor results, the evoked release of D-serine was measured with a biosensor as well as with LC-MS. Brains of stage 48 Xenopus tadpoles were dissected and five brains were incubated in 1 mM ATP in aCSF for 90 min to evoke D-serine release followed by parallel D-serine detection with LC-MS and a D-serine biosensor (Fig. 4a).
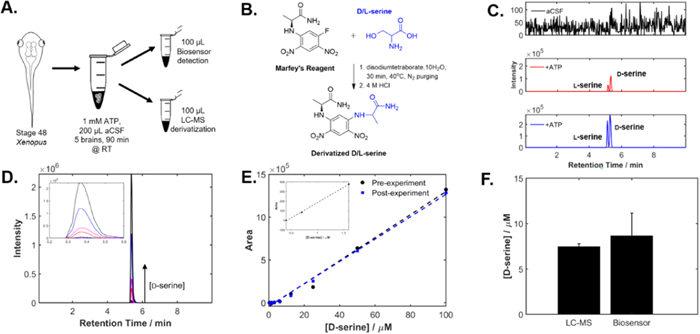
Figure 4. D-serine biosensor validation through detection of evoked D-serine release. (a) Schematic of the experimental methodology used for biosensor validation. (b) Schematic of the derivatization protocol with Marfey's reagent. (c) LC-MS detection of ATP evoked D-serine release. Two samples each with five dissected brains were incubated in 1 mM ATP in aCSF for 90 min. An aliquot from each sample was extracted for derivatization with Marfey's reagent and 10 μl was subjected to LC-MS for detection. The extracted ion chromatograms corresponding derivatized aCSF (top), ATP-infused sample 1 (middle) and ATP-infused sample 2 (bottom) are shown. In the two ATP-infused brain samples, two separate peaks appear (from left to right): one for l-serine and one for D-serine. (d) Extracted ion chromatograms corresponding to the LC-MS peaks for D-serine detection. The increasing intensity of the peaks corresponds to increasing D-serine concentrations. (e) Calibration curve for LC-MS detection of derivatized standard D-serine solution where two linear ranges are present (0–1.5 μM and 6.25–100 μM). Calibration curve duplicates were run, one before D-serine detection with LC-MS and one following LC-MS D-serine detection. Inset: Calibration curve for the lower end of the linear range between 0–1.5 μM. (f) Comparison of biosensor results (8.69 μM) with LC-MS detection of D-serine release (7.49 μM) of D-serine release under ATP stimulation.
Download figure:
Standard image High-resolution imageAn aliquot of the brain conditioned medium (CM) was derivatized with Marfey's reagent and subjected to chemical analysis by LC-MS. The derivatization protocol is shown in Fig. 4b. Extracted ion chromatograms of derivatized extracts are compared against chromatograms for aCSF (Fig. 4c), clearly indicating the presence of Marfey adducts of both l-serine (5.18 min) and D-serine (5.38 min) in the samples (m/z = 356.1). Under the same conditions, the retention time of an authentic standard of Marfey-derivatized D-serine was found to be 5.38 min (Fig. 4d). Using this standard, a calibration curve was constructed for LC-MS quantitation of derivatized D-serine by correlating the area under the extracted ion chromatogram peak to D-serine concentration. Two independent linear ranges were observed for D-serine calibration curves obtained with LC-MS. The LC-MS calibration for concentrations ranging from 6.125−100 μM was used to determine the D-serine concentrations in the samples (Fig. 4e). In addition to D-serine detection, the same methodology can be simultaneously applied for detection of additional amino acids using Marfey's derivatization (Fig. S7). Table SII lists several literature LC-MS methods used for the detection of amino acids, highlighting the extensive time required for sample preparation and amino acid detection as compared to biosensor detection which requires no sample preparation.
The same sample was analyzed for D-serine by amperometric detection (Fig. 4f): the estimated values (7.49 μM vs 8.69 for the LC-MS vs biosensor) showed a ∼15% difference between the two quantification methods. These results validated the biosensor measurements since the LC-MS method is not significantly affected by any of the known interferences that could alter the amperometric responses.
Measurement of D-serine from Xenopus brain preparations
Prior to real-time in vivo D-serine detection, it was essential that the biosensor performance in a less complex biological environment be studied. As such, the biosensor was applied ex-vivo to measure D-serine release from Xenopus. Previous research in mice provided evidence for D-serine level fluctuation as a function of wakefulness. 36 In particular D-serine levels were found to be highest after a full day of being awake. Here, we used the biosensor to explore whether a similar phenomenon exists in Xenopus tadpoles.
Stage 48 animals were sampled randomly from a group of animals raised under 12 h/12 h light-dark cycle for 7–8 d. To mitigate biosensor LOD, five brains were extracted and pooled to constitute a single sample and placed in a single Eppendorf with 200 μl room temperature aCSF. D-serine levels were measured with the biosensor in brain samples collected at various time points throughout the day (Fig. 5a).
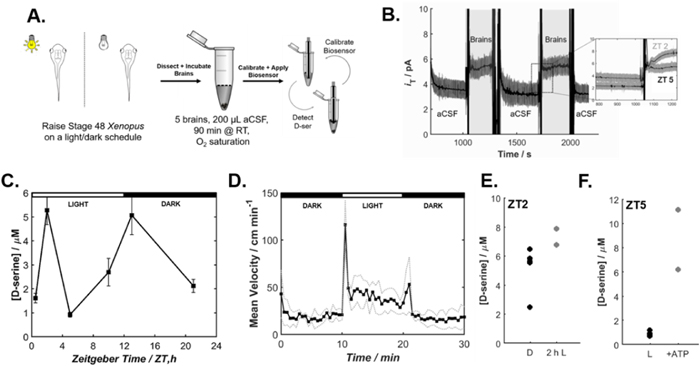
Figure 5. Ex vivo detection of D-serine release over a light-dark schedule (a) Schematic of experiment protocol. (b) Sample experiment. Unhighlighted portions represent the biosensor response in unconditioned aCSF. The highlighted portions represent the biosensor response in the brain-conditioned aCSF medium (CM). Expanded plot shows the difference in the current measured with the biosensor at ZT 2 and ZT 5 corresponding to a variation in D-serine levels. (c) D-serine measurements in ZT0.5, ZT2, ZT5, ZT,10, ZT14 and ZT22 CM (n ≥ 3). Error bars represent ± S.E.M. (d) The average mean velocity of swimming in cm·s−1 of 5 independent experiments done with 6 tadpoles separately housed in a 6 well dish (n = 30). Tadpoles were allowed to stabilize behavior for 10 min and then mean velocity was sampled every 30 s for alternating 10 min light and dark conditions. The dotted grey lines represent the average mean velocity ±S.D. (e) D-serine measurements at ZT2 in CM from animals raised in complete darkness and then either kept in darkness (n = 3), or exposed to light (n = 2) for the 2 h immediately prior to sacrifice. Each point represents an individual measurement. (f) D-serine measurements at ZT 5 in CM from animals raised under a 12 h L/12 h D schedule without (n = 4) or with (n = 2) the addition of 1 mM ATP at the beginning of brain samples incubation in aCSF. Each point represents an individual measurement.
Download figure:
Standard image High-resolution imageD-serine levels were measured following a 90 min incubation period of the brains in the oxygen saturated aCSF. Previously calibrated biosensors were used as D-serine probes in the brain-conditioned aCSF (Fig. 5b). Biosensors were calibrated in standard solutions of D-serine before and after D-serine detection experiments, demonstrating an operational lifetime of at least 4 h of continuous use (Fig. S8). Experiments with the null sensors were also performed to exclude the contribution of false positive signals in biosensor D-serine detection (Fig. S9). In this work, D-serine level fluctuations as a function of Zeitgeber Time (ZT) were studied. Herein, ZT represents the light-driven environmental time cue which trigger Xenopus entrainment to a 24 h cycle. Figure 5b shows a representative result from the biosensor measurements at ZT2 and ZT5.
Comparison of D-serine levels at different dissection times reveals that D-serine levels fluctuate over a 24 h period (Fig. 5c). D-serine levels were highest early in the light phase (ZT2) but rapidly declined until ZT5. D-serine levels were also high at the beginning of the dark phase (ZT14). In particular, significant elevations in D-serine levels were apparent during the initial switch from light-to-dark (ZT2) and dark-to-light (ZT14). Tracking the tadpole's behavior during transitions from dark to light revealed that tadpoles exhibited a higher level of swimming activity during this transition period (Fig. 5d) consistent with the possibility that D-serine levels may increase as a function of wakefulness or locomotor activity.
To further explore the effects of light on D-serine level changes, tadpoles were raised in darkness until they reached developmental stage 48 for 1 week. One group of animals was then exposed to light for 2 h between ZT0 and ZT2, while another group remained in darkness. D-serine detection from samples at ZT2 shows that D-serine levels are higher in the group of animals exposed to 2 h of light (Fig. 5e). These results suggest that the increase in D-serine levels measured after the transition from dark to light is likely due at least in part to an increase in light-driven activity.
Moreover, ATP has been shown to activate calcium transients in astrocytes that induce transmitter release by binding to P2Y1 purinergic receptors. 57 To test whether D-serine release is evoked by pharmacological stimulation of ATP, 5 brains were incubated for 90 min 1 mM ATP at ZT 5. D-serine levels from the animal groups incubated in ATP are higher than any light-driven D-serine release (Fig. 5f), supporting the proposed role of ATP in D-serine release mechanisms, validated with complimentary LC-MS data at ZT5 (Fig. S10). A third group used pharmacological stimulation by incubation in 1 mM ATP at ZT 5 to activate D-serine release.
Sensor application in vivo
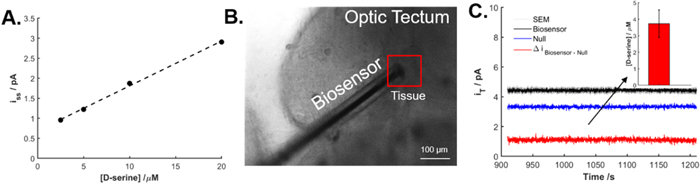
Following successful biosensor ex vivo D-serine release studies, biosensor application in an increasingly challenging in vivo context for real-time local D-serine detection was explored. Biosensors were inserted into the optic tectum of intact tadpole animals. Following sensor stabilization and calibration in the perfusion chamber under animal absence, chronoamperometric recordings in Xenopus were performed to measure in vivo D-serine levels (ne = 4). A representative calibration curve in the perfusion chamber is shown along with the in vivo experiments (Figs. 6a, S11). The in vivo LOD of the biosensors is 0.7 ± 0.2 μM. Under application of 0.5 V, the biosensor was allowed at least a 10 min stabilization in aCSF in the recording chamber away from the animal. The biosensor was then implanted into the ventricle space surrounding the Xenopus optic tectum (Fig. 6b) and a 10 min baseline was measured. The ventricular space adjacent to the optic tectum is a convenient location to measure extracellular D-serine levels without significant damage to the neural tissue. Subtraction of the biosensor signal from the null signal resulted in the quantification of 3.73 ± 0.8 μM D-serine (Fig. 6c). This amount may be attributed to passive diffusion of small molecules possibly assisted by the incision made in the optic tectum. Notably, video monitoring of blood flow and heart beat confirmed that the animals remained alive after the insertion of the sensor into the brain. As such, these experiments demonstrated successful biosensor application in vivo for real-time D-serine detection enabling future work in single-cell measurements of D-serine release.
Figure 6. In vivo detection of D-serine inside the optic tectum of stage 48 Xenopus laevis tadpoles. Currents were measured at constant potential (0.5 V). (a) Standard solutions of D-serine (0–20 μM) were flushed into the measurement chamber in the absence of the animal to calibrate the biosensor in vivo (t = 20−30 min). (b) Optical microscope image of the biosensor inserted inside the tissue of the optic tectum of an Xenopus laevis tadpole (Scale bar = 100 μm. (c) Detection of D-serine in the ventricular space representing D-serine in the cerebrospinal fluid in vivo. The difference in the current between the biosensor and the null was used to determine D-serine concentration. Inset: A concentration of 3.73 ± 0.8 μM D-serine was detected. Error bars represent the standard error of the mean.
Download figure:
Standard image High-resolution image
Conclusions
We successfully miniaturized D-serine detecting biosensors and established their biosensing limits with regards to selectivity, sensitivity, reproducibility, stability, and practical applicability. This is the first report, to our knowledge, combining a comprehensive summary of sensor development, miniaturization, characterization as well as the successful application for D-serine detection ex vivo and in vivo at the micromolar level. This study now paves the way for future application in other animal models to study D-serine at the molecular level under physiological and pathological conditions.
In addition to biosensor characterization, we showed the importance of evaluating the biosensor against any pharmacological drugs prior to their application for evoked D-serine release, identifying ATP as a candidate for application in biosensor studies to evoke D-serine release. More importantly, we also validated the hypothesis that D-serine release is a process tied to tadpole alertness and activity using a combination of biosensor D-serine detection and behavioral activity tracking experiments. Biosensor application ex vivo demonstrated that D-serine levels fluctuate between 1–5 μM depending on the time of the day, with the highest levels being during the initial switch from light to dark and dark to light. Tadpole locomotion experiments demonstrate that tadpole activity is highest during initial switches in light, suggesting that D-serine levels rise with increased Xenopus activity.
Additionally, D-serine measurements from intact Xenopus demonstrated the first measurements of D-serine made in live Xenopus with enzymatic biosensors, without the need for brain preparation to expose cells to the biosensor. Currently, the future of these sensors includes extensive application in vivo for the detection of sensory evoked D-serine as well as single-cell D-serine release studies.
Acknowledgments
This work was supported by NSERC and by a grant from the Canadian Institutes for Health Research (FDN-143238) to ESR. The authors are grateful to Dr. Gary Armstrong for permitting use of the DanioVision behavioral apparatus.
Data Availability
The data is available directly from the author within reasonable requests.