

Abstract
Among several surface analytical methods Ion Scattering is a possibility to study the composition and depth profile of passive layers. Examples are presented for Rutherford Backscattering Spectroscopy (RBS) for the investigation of thick oxide layers up to more than 100 nm on Al containing additions of other metals like Cu and low Energy Ion Scattering Spectroscopy (ISS or LEIS) for thin passive layers of a few nm thickness of binary alloys. The chemical structure of thin passive layers with a high depth resolution is obtained by ISS depth profiles, which supports the results for these films obtained by X-ray Photoelectron Spectroscopy (XPS). A reliable specimen preparation in an electrochemical cell attached to the UHV spectrometer, i.e. in a closed system is described, which helps to exclude changes and artifacts by unwanted environmental factors, which might affect the results of fundamental investigations.

This is an open access article distributed under the terms of the Creative Commons Attribution Non-Commercial No Derivatives 4.0 License (CC BY-NC-ND, http://creativecommons.org/licenses/by-nc-nd/4.0/), which permits non-commercial reuse, distribution, and reproduction in any medium, provided the original work is not changed in any way and is properly cited. For permission for commercial reuse, please email: permissions@ioppublishing.org.
Many surface analytical methods have been developed and applied during the past 50 years to examine the composition and structure of solid surfaces 1 and especially passive layers on metals, which act as an important protection against corrosion. Although many of these methods work in the ultrahigh vacuum (UHV) and thus not under in situ conditions of the corroding systems, they nevertheless provide valuable results of the composition of these layers for a better understanding of the leading mechanisms for their protection of the metals underneath and their breakdown in case of general and localized corrosion. Only a few examples of a large literature are mentioned here. 2,3 Numerous special meetings have been organized in the past and reviews and book chapters have been published to summarize the knowledge and progress for an understanding of the properties of these films. Among the surface analytical methods X-ray Photoelectron Spectroscopy (XPS) and Auger Electron Spectroscopy (AES) have been widely applied often in a close combination with electrochemical method. 4 The scattering of noble gas ions was also very effective for the evaluation of the composition of these films 5 but was not so much applied and accepted by the research groups. Therefore, this review tries to summarize the strength of this method and to present an overview of some of its results, which might cause the interest of younger groups to its application.
There are two main methods which have their special strength. Rutherford Back Scattering (RBS) uses helium ions He2+ with a high primary energy in the MeV-range like the historical experiments of Rutherford, i.e. scattering of α-radiation to study the atomic structure of solids. Ion Scattering Spectroscopy (ISS) uses several noble gas ions, in most cases He+- or Ne+-ions with a primary energy of some few keV. Therefore, the latter method has been called also Low Energy Ion Scattering (LEIS). RBS allows the quasi non-destructive investigation of quantitative depth profiles of relatively thick layers up to the μm range, 6,7 which will be demonstrated in this paper by the example of thick passive layers on Al-Cu substrates. 8 It also allows to determine the relative mobility of cations and anions within the oxide by implanted noble gas markers in an already existing passive layer during its further growth. 9–11 In these studies, one determines where new oxide is formed, at the metal/oxide or the oxide/electrolyte interface. ISS permits the study of the composition of thin passive layers in the nm or sub-nm range together with soft sputter depth profiling. 5 Thus a short section of this review will be addressed to RBS and a larger part to ISS, which is not so well known or applied by the corrosion community. Both methods cannot provide detailed chemical information like the oxidation state of layer components and the water-, OH- or oxide-content of passive layers, which is the strength of XPS. Therefore, ISS has been applied mostly in combination with detailed XPS-studies in the laboratory of the author. The combination of the methods supplies a good insight to the film composition, its formation and reduction and the effective mechanisms of its degradation or film breakdown. 2,3,12 Besides the study of film composition and its changes with the electrode potential and time, as well as the influence of the electrolyte, the study of the atomic structure is of importance. This has been investigated very often in situ by scanning methods like Scanning Tunneling Microscopy (STM) and Atomic Force Microscopy (AFM) 13,14 as well as methods using synchrotron radiation like X-ray Absorption Spectroscopy (XAS) and X-ray Diffraction (XRD) with grazing incidence of the X-ray beam. 15,16 However, these investigations and their methods are not included in this review and the references are recommended for further information.
Furthermore, a study of passivity requires a careful electrochemical investigation and a specimen preparation under well controlled electrochemical conditions. The best surface analysis is unreliable if the electrochemical preparation is not performed under well-known and controlled conditions and electrochemical studies without the information of the results of surface studies are often left with a certain speculation about important details of the chemistry of the processes and their leading mechanisms. Therefore, an additional section describes the specimen preparation in a closed system with the electrochemical cell attached to an UHV spectrometer, equipped with the required ISS and XPS facilities. It also allows to start the electrochemical specimen preparation with a non-contaminated and oxide free surface. Such an equipment was used routinely for the combined electrochemical and surface analytical studies in the group of the author especially for the results presented in this paper.
In the following sections first a brief summary is given about RBS as a comparative method to ISS with its special strengths. This is followed by a discussion of the electrochemical specimen preparations and its transfer to the UHV without contact to the environment in a closed system with a description of an appropriate equipment. In a third section the ISS method is described with its application to the investigation of thin passive layers on some binary alloys followed by a final section on its relation to other surface analytical methods.
Any electrode potentials of this review are given relative to the standard hydrogen electrode (SHE).
Rutherford Backscattering (RBS)
RBS is the development of the historical experiment of Rutherford with α-radiation for the study the atomic structure of solids as an analytical tool for the investigation of surface films on solids. 17 In corrosion research and materials science it has been used to study the composition of surface films on valve metals, i.e. relatively thick oxide layers in the range of several 10 nm up to more than 100 nm forming on metals like Al, Ta etc. 8,11 These films are usually electronic isolators so that they don't permit the transfer of electrons, which is a necessary condition to avoid oxygen evolution at sufficiently positive electrode potentials. As a consequence, thick passivating films may be formed, which requires electrode potentials of 100 V and more. With the semiconductor model of anodic oxide layers this is a consequence of the very high band gap of several eV between the valence band and the conduction band. According to the high field mechanism, these films grow linearly with the electrode potential. The composition of these anodic layers, especially in the case of alloys are of decisive importance of their protecting properties against corrosion. Therefore, the depth profiles of these thick films have been studied with RBS, which may be obtained easily by this method. RBS studies are nondestructive and require less effort for specimen preparation compared to the examination of cross sections with SEM or Scanning AES, which might cause changes after electrochemical specimen preparation.
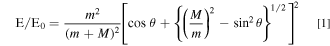
A Rutherford spectrometer requires a beam of helium ions with high energy in the range of 2 MeV. For this purpose, He2+-ions are submitted to a voltage drop of 1 MV given by a Van der Graaf generator. This accelerated beam of He-ions hits the specimen surface in a vacuum line with a primary energy of 2 MeV. These ions are backscattered, for a close approach to the nuclei of the atoms within the specimen and then hit a semiconductor detector on their way back. The primary beam passes the detector by a hole in its center. The backscattering process follows the conditions of the binary elastic collision known from classical mechanics. It causes a characteristic energy transfer of the Helium ion to the backscattering target atoms depending on their masses as given by Eq. 1. m is the mass of the helium ions and M the mass of the atoms of the target. E is the energy of the backscattered ions and E0 their primary energy. The higher the mass M of the scattering atom the smaller the energy transfer and thus the higher the remaining energy of the related backscattered ions. Θ is the backscattering angle between the forward direction of the incident beam and the direction of the detected ions, i.e. the position of the detector. For the RBS spectrometer used here this angle was θ = 175 degrees.
The helium ions are additionally submitted to inelastic energy losses on their way into the depth, where they are backscattered, and their path out of the specimen. So there are two losses, one for the backscattering process itself which is characteristic for the mass of the scattering atom of the target, and another one as a measure for the depth of the scattering process. Each ion causes a pulse of charges in the silicon detector, the size of which is a measure of its energy. All the pulses of the ions are sorted out by their energy and summed up leading finally to an energy spectrum of the backscattered helium ions. This energy spectrum is a presentation of the depth distribution of the elements and their concentration within the film. The deeper the center of the backscattering process the smaller the energy of the helium ions. The heavier the mass of the target atom the smaller is the energy loss during the backscattering process and the higher the energy of their signal in the spectrum. Therefore, elements with high mass appear at the high energy end of the spectrum and light elements at the low end. The width of the signals of the elements is a measure for the depth, i.e. the target atoms at the surface appear at their high energy end and the deeper locations appear at the lower energy end. A typical spectrum of a vapor deposited Al film on a quartz substrate with 1 at% Cu is shown in Fig. 1. 8 It was taken with a primary energy of the He2+ beam of 1.7 MeV and a current of 10 nA. The energy resolution of the detector was 10 keV corresponding to a depth resolution of 20 nm. Cu as a heavy metal appears at the high energy end of the spectrum and Al at its lower end. The width of the Cu- and Al-signals reflect the thickness of the deposited film. At the low energy end of the spectrum the silicon and oxygen signals of the quartz substrate show up. RBS cannot separate the Al and Si signals due to the small mass difference of both elements. The atomic fraction XCu may be calculated from the signal heights H of Cu and Al at the same film depth, i.e. the same energy distance of the leading edge according to Eq. 2. The square of the atomic numbers of the metals of Eq. 2 compensates the increase of their backscattering cross section with these values. The RBS results for the Al/Cu film composition taken from the signal heights H equals the average film analysis obtained by atomic absorption spectroscopy in the range of 0 to 70 at% or more of Cu. 8 The flat signal indicates a homogenous composition of the vapor deposited film. The increase of the signal height at the low energy end is due to an increase of the back scattering cross section with falling kinetic energy. The vapor deposited films consist of grains of ca. 100 nm size as seen by transmission electron microscopy. Due to the low solubility of Cu in Al, films of more than 1 at% of Cu show increasing amounts of the θ-phase CuAl2. 18

Figure 1 depicts an additional spectrum of this vapor deposited film anodized galvanostatically with a current density of 1 mA cm−2 up to E = 100 V in citrate buffer pH 6.0. An anodic oxide layer causes a shift of the leading edge of the Cu signal to smaller energies due to an overlayer of pure Al2O3 which is apparently free of any Cu-atoms. The Al signal shows a separation in two parts. The lower step at the high energy end corresponds to the outer Al2O3 layer, whereas the part at the low energy side to the remaining metal layer underneath. This is a consequence of the lower Al-concentration of the anodic oxide with respect to its higher value within the metal film. In addition, a superimposed oxygen signal shows up on top of the basis of the Al-signal which is part of the oxide layer of the anodized specimen. With the known stopping cross sections ε for the materials, the energy scale may be transformed to a depth scale according to Eq. 3. ΔE is the energy width of the plateau of the signal and K2 the backscattering kinematic factor. The 4He stopping cross sections ε [eV/1015 at cm−2] for the elements Al and O were taken from the values of Ref. 19. ε(in) stands for the ions of the primary energy E0 and ε(out) for the energy E after the backscattering event. For the anodic Al2O3 the values have been calculated with Braggs rule from the values of the elements according to Eq. 4. From the surface density of atoms 1N (at cm−2) the layer thickness was calculated by its division by the density of atoms of corundum (Al2O3). The thickness of the anodic oxide is calculated from the energy width ΔE of all the characteristic structures in the RBS spectrum. The ΔE-shift of the leading edge of the Cu signal, ΔE of the width of the step of the Al-signal and of the integrated area of the oxygen signal allow the calculation of the thickness of the anodic Al2O3 layer in good agreement. 8 Somewhat higher values obtained from the anodic charge during galvanostatic oxidation are explained by some Al-dissolution during this electrochemical treatment. The shift of the leading edge of the Cu-signal yields slightly smaller values due to an interphase roughening, which will be discussed below. All values grow linearly with the achieved electrode potential E during the galvanostatic oxidation process, corresponding to a linear growth of the anodic Al-oxide and its thickness related to the anodic charge. 9 This is the consequence of the anodic film growth after the high field mechanism.


An interesting result is deduced from the structure of the Cu-signal. The Cu free aluminum oxide leads to a vanishing Cu-signal within the energy gap of the spectrum related to the shift caused by the film formation. Cu is much nobler than Al and thus it is not oxidized. It remains at the surface of the metal substrate, where it is accumulated. This shows up as an accumulation peak on top of the broad flat Cu signal of the substrate close to its leading edge. The shift of the Cu-signal increases linearly with potential and thus the time of the galvanostatic oxidation of the metal film. Thus the Cu-free anodic oxide film is increasing and the Cu accumulation grows at the metal surface as shown in Fig. 2. The width of this Cu-accumulation is a real in depth distribution as has been shown by tilt of the specimen relative to the ion beam in the RBS spectrometer, which leads to an expected broadening of the Cu accumulation peak. 8 Apparently this is a result of an accumulation of Cu at the metal's surface which is not completely smooth and thus causes an interface roughening as shown schematically in Fig. 3. This roughening leads to a breakdown of the film at sufficiently high anodization potentials and its following local damage by dissolution of the metal substrate as observed during galvanostatic experiments. 8,18 The breakdown potential decreases with the Cu-content of the vapor deposited film as shown in Fig. 4. 18 Anodization of metal films with large Cu-content causes more and more breakdowns starting already at low potentials and leads finally to a brittle appearance of the specimen's surface. Thin metal films with low Cu content of 0.5 at% Cu could be oxidized completely without breakdown with no Al metal left at the end of the anodization and a copper layer between the oxide layer and the sapphire substrate used for vapor deposition of the metal film in this case. The specimen gets transparent due to the complete loss of reflecting Al-metal with a slight red color due to the Cu-metal film under the anodic oxide. This has been again followed in detail by RBS-analysis. 8

Figure 1. RBS Spectrum of an Al-1at% Cu film on a quartz substrate as deposited and after anodization with i = 1 mA cm−2 to E = 100 V in 0.1 M citrate buffer pH = 6.0. 8
Download figure:
Standard image High-resolution image
Figure 2. RBS Cu-signal of an Al-0.5 at% Cu film anodized with i = 1 mA cm−2 in 0.1 M citrate buffer pH 6.0 up to different potentials E corresponding to different oxide thicknesses as indicated. 8
Download figure:
Standard image High-resolution image
Figure 3. Schematic presentation of anodic oxide formation on vapor deposited Al-Cu films with small Cu content, including the potential drop at the interfaces and within the anodic oxide, (a) native oxide, (b) anodic oxide with Cu enrichment at metal/oxide interface, (c) roughening at the interface leading to local film damage. 8
Download figure:
Standard image High-resolution image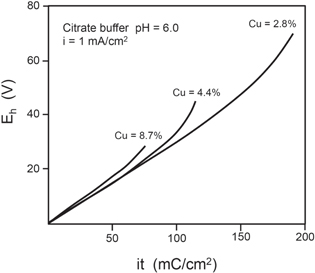
Figure 4. Galvanostatic oxidation of Al-Cu films of different Cu content up to film damage with i = 1 mA cm−2 in 0.1 M citrate butter pH 6.0. 18
Download figure:
Standard image High-resolution imageThe Al-Cu system has been of interest due to several reasons. Al/Cu-films have been used as conducting paths at the surface of integrated semiconductor devices. The Cu content was used to suppress electromigration of Al within the metallic conduction paths. However, corrosion has been a problem due to electrolyte residues from the production process. The access and penetration of water vapor through the encapsulent material to the device's surface builds up an aggressive electrolyte film. The applied voltage to the devices of 5 V or more may cause serious corrosion problems. Similarly, the Cu content of Al is a problem for construction materials at the macroscopic scale. Breakthroughs of protecting anodic films and Cu deposits exposed to the electrolyte as a consequence act as local cathodes for corrosion reactions of the metal constructions. Therefore, other groups have studied this system in detail also with RBS and came to similar results. 20,21 This review restricts mainly to the RBS method and illustrates its useful application by an example studied in detail.
Specimen Transfer in a Closed System
The use of UHV-methods for electrochemical investigations has been a matter of debate about 50 years ago. Despite the criticism of their applicability, one cannot ignore the usefulness of surface analytical methods like XPS, AES and ISS to a better understanding of the mechanisms of electrochemical systems and related corrosion phenomena. This became obvious, when effective specimen transfer systems were commercially available, which allow an easy specimen transfer from the electrolyte to an Ultra High Vacuum system (UHV) equipped with these surface analytical tools. Their application allows to overcome the speculation and uncertainty for the interpretation of pure electrochemical experiments. It is important to measure and know what chemical reactions occur at an electrode surface to get to a reliable interpretation of the results. However, there still exists the question, what changes may happen at the specimen's surface during its transfer from the electrolyte to the UHV. Furthermore, one often even doesn´t know the chemical situation of the electrode surface one is starting with for basic electrochemical studies. Therefore, several groups investigated this critical combination of electrochemistry and surface analysis in the UHV. 22–29 It has been shown, that with appropriate precautions any changes of the results of surface preparations can be avoided during specimen transfer. Even the composition of the electrochemical double layer of pure metal electrodes could be studied successfully for noble and semi-noble metals like Au, Ag and Cu after emersion of electrodes from the electrolyte under hydrophobic conditions. 29–33 One could study the composition of the electrochemical double layer in dependence of the electrode potential by quantitative XPS and determine the potential of zero charge by balancing the amount of cations and anions at the electrode surface and investigate chemisorption phenomena. Even ISS has been successfully applied for the study of the structure of the electrochemical double layer on Ag in alkaline NaOH/NaCl solution. ISS with 4He-ions in combination with a soft sputter process could show, that Cl− is attached directly to the Ag surface followed on top by Na+-ions and finally water. 32 For the investigation of the formation and reduction of passive layers on metal surfaces the application of such a transfer system is very useful and has been applied routinely for many studies.
Figure 5 shows a commercial system which has been adopted to this problem and has been used for numerous studies over the years. 29 It consist of a commercial three chamber vacuum system with a fast entry lock, a preparation chamber and an analyzer chamber, equipped with an ion-source for ISS, an X-ray source for XPS, an electron gun for AES and an UV-source for Ultraviolet Photoelectron Spectroscopic Studies (UPS). The electrostatic energy analyzer is attached as a main part to the analyzer chamber of the spectrometer to measure the energy spectrum of backscattered ions or photoelectrons. A fourth chamber is attached to the fast entry lock to allow an electrochemical specimen preparation (Fig. 6). 29 This electrochemical chamber could be flooded with purified argon (Oxisorb System) to avoid traces of oxygen and other contaminants, which might lead to the oxidation of surface species and uncontrolled layer formation on the specimen. The attached electrochemical cell could be filled with electrolyte degassed with purified argon and water to rinse the electrode surface after its preparation. An effective rack and pinion drive system allows the sample transfer between the chambers, which are separated by gate valves. Manipulators allow the specimen handling within each chamber. The usual controlled specimen preparation includes a surface polishing with diamond paste followed in some cases by electropolishing, cleaning with alcohol and water, its introduction to the fast entry lock and pump down to vacuum. Then it was transferred to the preparation chamber and sputter cleaned with argon ions to remove any residual contaminants and oxide films. Then the specimen was transferred back via the fast entry lock to the electrochemical chamber and touched with a hanging meniscus geometry to the electrolyte surface of the small electrochemical cell of ca. 2 cm3 volume, usually at negative electrode potentials, to remove any residual oxide. Then the potential was stepped to a value of interest for short or long times in the ms to 10 min range. The potential was finally changed to a value, where no reactions or changes are expected, according to the electrochemical characteristics of the system under study. Finally, the specimen was emerged from the electrolyte. For some cases it was just emerged out of the electrolyte without previous potential changes. Short pulse treatments were achieved by pulse generators attached to the adder of the external potentiostat. Any complicated pulse program could be applied. Then the electrode surface was cleaned by extracting the electrolyte form the electrochemical cell and filling it with purified, argon purged water and dipping the specimen surface into it. Finally, the argon filling of the electrochemical cell was removed by evacuation and the specimen was transferred via the fast entry lock and the preparation chamber to the analyzer chamber where it was investigated with the method of choice. The transfer of the prepared specimen from the electrolyte to the UHV of the analyzer chamber with a pressure of 10−9 mbar could be performed within ca. 5 min.

Figure 5. Schematic Diagram for a commercial 3 chamber UHV system with an attached electrochemical preparation chamber for a controlled electrochemical specimen preparation and transfer to the analytical chamber with surface analytical facilities like ISS, XPS and AES without contact to the environment. 29
Download figure:
Standard image High-resolution image
Figure 6. Schematic presentation of the electrochemical preparation chamber with outer supply of electrolyte, water and purified argon gas, WE: working electrode, CE: counter electrode, RE: reference electrode. 29
Download figure:
Standard image High-resolution imageThe application of this procedure has the following advantage:
- 1.One starts with a specimen with a well-known and controlled chemical situation of the surface. Especially oxide free surfaces are an option to start with.
- 2.The specimen preparation may be performed even at relatively negative potentials, where a following air exposure would change the situation by uncontrolled oxidation. It also allows oxidation experiments for very short times in the ms range by electrochemical pulse techniques. Thus the development of oxide films may be studied with high time resolution excluding uncontrolled oxide growth.
- 3.Species of low valence may be preserved and investigated with surface methods in the UHV, as Fe2+ by XPS, which normally is oxidized to Fe3+ by traces of oxygen
- 4.Even the reduction process of films may be followed after their anodic formation.
The formation of a very thin oxide or hydroxide layer cannot be avoided on sputtered surfaces of reactive metals during specimen transfer to the analyzer chamber due to the presence of residual water pressure. However, this was reduced at negative potentials within the elecreolyte before starting the oxidation process at higher electrode potentials. Thus one could start oxide formation with an oxide free surface. In the case of semi-noble metals like Cu or Ag the surface could be kept oxide free in wet environment without oxygen as has been tested in detail, 34 which then allows even the study of a pure metal surface.
This system has been applied for XPS and ISS studies of passive layers on several metals and binary alloys, which will be discussed in the following section.
Ion Scattering Spectroscopic Studies of Passive Layers
ISS is an appropriate method to study the composition of passive layers with a thickness of only some few nm. The backscattering of noble gas ions at surfaces permits the investigation with a monolayer sensitivity, i.e. only the upmost layer is detected. In contrary, other methods like XPS have a depth resolution in the range of about 1 nm due to the mean free path of the photoelectrons. ISS works with a beam of noble gas ions. Noble gas atoms are ionized within the ion gun and accelerated by a voltage of one to some few kV. The focused ion beam leaving the ion gun is directed to the specimen surface. An appropriate equipment was commercially available in the mid 70 ies, which however was restricted to ISS only. It has been applied to passivity of pure copper and vapor deposited aluminum/copper films by the author and his colleagues as mentioned below. A more recent version of an ISS spectrometer is available since a few years. Here the ion beam passes through a hole in the center of the electrostatic analyzer and is directed perpendicularly to the specimen surface. Ions with the same backscattering angle and all azimuth angles are collected, pass the electrostatic analyzer and finally are directed to a position sensitive detector. This design increases the intensity of the ISS signal. This equipment is suited for research and routine tests in industry. It has been used for the elemental analysis of deposited multi layers of metals and inorganic and organic compounds like oxides or self-assembled monolayers and polymer films. In the laboratory of the author an ISS option was added to a commercial XPS spectrometer in collaboration with the company (VG Scientific), which was used for the study of passive layers on various binary alloys as described below. It requires the addition of an ion gun and a possible change of the polarity of the spherical sector analyzer for the energy analysis of electrons for XPS or positive ions for ISS analysis. The focused ion beam may be scanned laterally at its surface to get a soft sputtering of the surface layers for depth profiling with interrupted times for ISS analysis, when it is usually directed to a smaller area at the center of the sputtered surface area. The backscattered ions pass the entrance slit of an electrostatic energy analyzer. In the system applied by the author's group it is an electrostatic spherical sector analyzer. They finally are directed to a channeltron or a channel plate, i.e. the secondary electron multiplier for detection as in the case of photoelectrons.
The backscattering of the noble gas ions at the specimen surface follows the rules of an elastic binary collision process (Fig. 7). As in RBS the energy transfer to the target atom is determined by the masses of the involved atoms as described by Eq. 5, which equals Eq. 1 for a backscattering angle of θ = 90 degrees. M stands again for the mass of the target atom and m for that of the probe gas. E and E0 are the energies after and before the backscattering process, respectively. The ions of the probe gas may be backscattered only by heavier atoms at the target surface, i.e. all atoms may be detected by He+-ions except hydrogen. Neon cannot detect oxygen, but heavier metal atoms.

During the backscattering process most of the noble gas ions are neutralized, because their chemistry leads to an effective uptake of electrons from the target surface. However, the short contact time of the fast accelerated ions during backscattering at the first atomic layer preserves the charge for at least some percent, which then may pass the electrostatic energy analyzer with an appropriately applied deflecting voltage. All ions which proceed to the second or a deeper layer before reflection lose their charge and cannot be detected. As a consequence, this method is sensitive to the first atomic layer only. The scan of the analyzer voltage yields the energy spectrum of the backscattered ions. Together with a soft sputtering process and intermediate times for ISS analysis one obtains a sputter depth profile with high depth resolution of about one monolayer sensitivity. Of course one has to take care of possible preferential sputtering of one surface component, ion mixing processes and recoil implantation. For most cases of the investigated systems this was not a problem. In the case of the analysis of oxide films on Cu and on Al/Cu alloys the analysis was performed with He+- and the sputtering with the heavier Ne+-ions. In the case of oxide films on other alloys the analysis occurred with Ne+ in the system described above. The heavier Ne-ions allow a better energy separation of the ISS signals of atoms of similar mass as i.e. of Cr and Fe. The oxygen content was not of interest for that study. The quantitative evaluation of the spectra yields the surface composition in atom percent. This evaluation requires a calibration with standards of well-known composition, usually pure metals to get the ISS sensitivity factors for the elements on an empirical basis. In the case of Al/Cu films the separation of the backscattered signals was very good so that the peak heights were taken as a measure of the metal content. In other systems overlapping peaks had to be separated with appropriate programs involving the data for peaks of pure metal standards. The quantitative evaluation of overlapping peaks and their integration after separation has been developed for XPS analysis and is described elsewhere. The standard peaks were described by Gauss Lorenz curves. The evaluation of the ISS signals keeps the parameters of the standards peaks constant with variation of their heights only to get a closest fit by their superposition to the measured signal. The areas of these peaks are a measure of the amount of the species composing the specimen surface. They have to be corrected by the relative ISS sensitivity factors given by the measured standard peaks.

Figure 7. Scheme for the backscattering process of noble gas ions of mass m at solid surfaces with target mass M with a backscattering angle θ = direction of energy analyzer, E0 = primary energy, E = energy after backscattering.
Download figure:
Standard image High-resolution imagePassive Layers on Cu and Vapor Deposited Cu/Al-Films
Quantitative ISS measurements were tested with vapor deposited Al/Cu films on smooth quartz and silicon substrates with a copper content between 1% and 70%. The average copper concentration of these films was known from their analysis with Atomic Absorption Spectroscopy (AAS) as mentioned already above for RBS studies. 8 ISS depth profiling yields a fast increase of the aluminum- and a related decrease of the oxygen signal due to the removal of a thin air formed oxide film by sputtering. Also the Cu signal shows a small increase at the beginning of the sputter process. During a sputter time of up to more than 2 hours the Al- and Cu-signals remain at a constant level, indicating that no preferential sputtering was observed. The evaluation of the peak height ratio HCu/HAl of the sputter cleaned surface yields the composition of the metal films as deposited, which shows a good agreement with the data of the AAS-results of these films. This was a successful test, that ISS can be used for the evaluation of the concentration profiles of thin films. The quantitative evaluation of the ISS intensity ratios requires a compensation for the difference of the scattering cross section of the metals Al and Cu, which was taken from ISS spectra of pure Al and Cu specimen with a correction for the surface atomic packing density of both metals. 35,36
The ISS analysis of an Al-film with 10.8 at% Cu after potentiostatic oxidation yields a 10 nm thick Al2O3 layer free of any Cu (Fig. 8) 37 in agreement with the RBS results as described above. 8 However, one does not detect a Cu enrichment at the oxide/metal interface after the anodic formation of a film of ca. 10 nm thickness. Apparently a possible Cu-excess is small and might diffuse into the Al metal. The specimen for RBS studies have been oxidized galvanostatically up to 100 V, whereas for the ISS studies potentiostatic oxidation at E = 1.0 V was performed. Cu shows up, when the sputter process reaches the oxide/metal interface, i.e. when the oxygen signal disappears. The slowly disappearing oxygen signal is a consequence of the bell shaped sputter profile of the spectrometer used in this case. This crater effect was avoided, when a different equipment was used for later studies with a focused ion beam of an ion gun with its appropriate scanning of the specimen surface for sputtering and ISS analysis. Several Al/Cu films with a bulk Cu-content in the range of 1 to 10 at% Cu have been studied with ISS depth profiles with equivalent results. These studies show clearly that, that only pure Al2O3 is formed with no Cu contamination.

Figure 8. ISS depth profile of Al-10.8 at% Cu with 10 nm anodic oxide formed at E = 1.0 V in 0.1 M citrate buffer pH 6.0, ISS 3He, E0 = 1.5 keV, 20 μA cm−2, atomic fraction of metal (Al, Cu) and ISS oxygen signal. 37
Download figure:
Standard image High-resolution imageISS has been applied to evaluate the passive layer on pure copper. According to thermodynamic reasons a thin Cu2O film is formed on Cu electrodes in borax buffer pH 9.2 in the lower passivity range up to E = 0.5 V. At a more positive electrode potential a duplex Cu2O/CuO, Cu(OH)2 film is expected. This is also supported by the characteristic current peaks of anodic and cathodic polarization curves of copper electrodes. 34 ISS analysis of passivated Cu specimen support this model. ISS depth profiles of Cu passivated in borax buffer pH 9.2 at E = 0.15 V and E = 1, 0 V yields characteristic changes. At E = 1.0 V a step for 35 min with ca. 50 at% Cu suggests the presence of an outer CuO film (Fig. 9). 34 Continuous sputtering yields an increase of the Cu content similar to the specimen passivated at E = 0.15 V with the continuous increase of the Cu content right at the beginning of the sputter process. Thus the step of lower Cu content suggests the presence of the outer CuO-layer. Unfortunately, XPS cannot help to get further chemical information due to the vanishing chemical shift between Cu(I)- and Cu(II)-species. The evaluation of X-ray induced Auger signals is an option in this case. The chemical analysis of this film with AES showed an outer Cu(II)-oxide and an inner Cu(I)-oxide layer. 38 A shoulder at higher XPS-binding energy of the O1S signal suggests the presence of a contribution of some outer hydroxide. 34 In conclusion ISS confirms the duplex character of the passive layer of Cu. Later in situ STM investigations support the model of an inner Cu2O and outer CuO part, with an appropriate atomic structure for these sublayers. 39

Figure 9. ISS depth profile of Cu, 10 min passivated at E = 0.15 V and E = 1.0 V in 0.1 M borax buffer pH 9.3. ISS: 3He, E0 = 1.5 keV, 9 μA cm−2. 34
Download figure:
Standard image High-resolution imageThe investigation of the passive layer on Cu/Ni-alloys is another interesting example for the application of ISS in combination with XPS. 40–42 For these alloys the chemical reactivity of the two metal components is not so extremely different as in the case of Al/Cu. Figure 10 presents ISS signals of Cu-50Ni passivated for 300 s in 0.1 M phthalate buffer solution pH 5.0 after different sputter times with Ne as sputter- and probe gas with a primary energy of E0 = 3 keV. 41 The ISS analysis was performed in the closed spectrometer system as described above. For ISS a pass energy of 200 eV was used for the spherical sector analyser (Marc II Fisons/VG Instruments), however, with a reversed deflection voltage for the analyzer for the positive ions. For the analysis the focused ion beam of the gun (EX05, Fisons/VG Instruments) could be scanned across the specimen surface. For sputtering 300 nA were applied to an area of 75.2 mm2 and for ISS analysis 30 nA to 14.9 mm2 in the center, to analyze a homogenously sputtered area and thus avoiding the crater effect. The relative depth values are related to the sputter characteristics of Ta2O5, as usual in surface analysis. One clearly can see, that both metals enter the passive layer in contrast to the Al/Cu films. Although the masses of Cu and Ni atoms are very close, ISS spectra allow a deconvolution to the contributions of both metals with the use of ISS signals of pure metal standards (Fig. 10). 41 With the integrated peak areas and the ISS sensitivity factors of the pure metal standards the quantitative ISS depth profile was calculated, as presented in Fig. 11 with the cationic fraction of Cu as a function of sputter depth. 41 A small Cu-content was found at the outer layer followed by a higher Cu content in the inner layer. At E = 0.28 V the inner layer shows an accumulation of Cu which is the consequence of the preferential consumption of Ni for the Ni-rich outer part at the beginning of the anodization process. This is leveled out for the higher electrode potentials of 0.68 V and 1.38 V with a thicker inner layer and an increasing driving force for the Cu oxidation. The inner part of the passive layer increases preferentially with the electrode potential compared to a smaller change of the outer part. For higher potentials a small accumulation of Cu is detected at the metal oxide interface, which suggests a slight accumulation of the semi noble Cu relative to the more reactive Ni at the metal surface. The XPS results for the specimen are also shown in Fig. 11 (dashed line) and agree well with the ISS data.

Figure 10. ISS signals of Cu-50Ni, 300 s passivated in 0.1 M phthalate buffer pH 5.0 at E = 1.38 V after 6 characteristic sputter times, depth of oxide and their deconvolution into Cu and Ni contributions, ISS: Ne, E0 = 3 keV. 41
Download figure:
Standard image High-resolution image
Figure 11. ISS depth profiles (o) and layer structure according to XPS analysis (......) of Cu-50Ni passivated for 300 s in 0.1 M phthalate buffer pH 5.0 at three characteristic electrode potentials including E = 1.38 V of Fig. 10, ISS as given for Fig. 10, depth scale relative to Ta2O5 sputter profiles. 41
Download figure:
Standard image High-resolution imageXPS analysis provides additional chemical information which allows a more detailed description of this multilayer structure. 40–42 The outer layer consists of hydroxide with a higher concentration of Ni, whereas the inner part is an oxide with an accumulation of Cu relative to Ni. This is a consequence of the depletion of Ni due to the formation of the outer Ni-rich hydroxide. XPS and X-ray induced Auger spectroscopy allow the distinction of Cu(I)- and Cu(II) as well as Ni(II) and Ni(III) species with different chemistry and dissolution characteristics. Their concentrations change with the electrode potential and the pH of the solutions. Higher valent species appear at sufficiently positive potentials only. In acidic electrolytes, Cu(OH)2 and NiOOH are formed and dissolved preferentially at electrode potentials in the transpassive range and lead to a thinner outer part of the layer and a thicker remaining inner oxide. 41 This however is not the case in alkaline solutions like 1 M NaOH, where these species are not soluble and can be detected in the outer part of the passive layer. 42 Thus the results for the passive layer of Cu/Ni alloys with 20, 50, and 80 at% Cu, obtained by a combined ISS and XPS analysis in acidic and alkaline solutions are rather complicated, leading to a model with a multilayer structure as published in several papers, 40–42 which is not the subject of this review on the application of ISS to passive layers. The Cu-metal enrichment at the metal surface is best seen for ISS profiles of Cu50Ni-specimen passivated in 1 M NaOH at elevated potentials, E = 0.44 V and 0.94 V, as presented in Ref. 40.
ISS Studies of Passive Layers on Fe/Cr Alloys
Fe/Cr is an interesting alloy with a very good corrosion resistance due to a very well protecting passive layer. The Cr-content shifts the critical pitting potential for aggressive anions to more positive electrode potentials and pure Cr even does not pit at all in the presence of aggressive chloride. This is a consequence of the extremely slow dissolution rates of Cr(III)-ions of passivating Cr2O3 which holds not only for Cr(III)-oxide but also for Cr(III)-chloride. Thus even an exchange of O2− by Cl− cannot lead to an accelerated dissolution of the passive layer, which means no pitting for pure Cr and for the alloy for sufficiently low potentials. As a consequence, the passive layer on Fe/Cr shows a pronounced increase of Cr2O3 within the passive layer as seen by XPS, 43–45 AES 46 and ISS depth profiles. 47,48 The larger mass difference allows even a better separation of the ISS signals of Fe and Cr compared to Cu and Ni. The ISS data analysis was performed as described for the Cu/Ni system with pure iron and chromium standards. The obtained Fe/Cr ISS sensitivity factor of 1.5 was tested successfully with Fe/Cr alloys in the range of 5 to 30 at% of Cr. Preferential sputtering of one of the alloy components was not a problem neither for the oxide nor the metal substrate. Air formed films on Fe/Cr alloys showed the same Cr enrichment as reported in Refs. 5, 47. Figure 12 shows the sputter profiles for Fe15Cr passivated in 1 M NaOH for 5 min at 4 electrode potentials including a specimen held at E = O.86 V for 20 s and 2 min only. 47 All profiles show a Cr enrichment within the passive layer with a Cr/Fe atomic ratio of up to 1, 25 which corresponds to a cationic fraction of XCr = 55%. These profiles show a long tail with a strong Fe-content for short sputter times, which is a consequence of the high Fe-content of the bulk metal of 85%. In alkaline solutions this Fe part cannot dissolve and piles up as an Fe rich outer layer. After removal of the passive layer the Cr content levels off to the bulk value of 15 at%. The higher the potentials the thicker the layer and the more the Cr enrichment peak broadens and moves inward. Figure 12 also shows a sputter cleaned specimen which has a constant Cr level, because no passive layer has been formed with the related Cr–accumulation. This specimen was transferred directly to the analyzer chamber and has not been exposed to the electrochemical chamber with a residual vapor pressure. The profile formed on a specimen passivated for 20 s and 2 min at E − 0.86 V depicts the accumulation of Cr at the oxide surface with time, with a preferential Cr oxidation and the missing Fe tail right at the beginning for this relatively negative electrode potential. This is a consequence of the low electrode potential and a slow formation of Fe(III) oxide for the less reactive Fe metal.

Figure 12. ISS depth profile of Fe-15 Cr passivated in 1 M NaOH at electrode potentials as indicated given as atomic ratio Cr/Fe, including a sputter cleaned specimen and a specimen passivated at E = −0.86 V for 20 s and 2 min, depth scale relative to Ta2O5-standard. 47
Download figure:
Standard image High-resolution imageFigure 13 shows the results for Fe-15Cr passivated for different times at E = 0.9 V in 0.5 M sulfuric acid. 48 The profiles show a steep increase of the Cr enrichment up to 70 at% for long passivation times of a week. The higher level of Fe(III)-ions for short sputter times and thus for the oxide surface are a result of the relatively high Fe content of the bulk metal, which forms a thin enrichment of Fe(III)-oxide at the beginning of the passivation. Although the dissolution rate of passivating Fe(III)-oxide is small, that of Cr(III)-oxide is smaller by orders of magnitude. Therefore, the Fe(III) -component is lost with time by dissolution and the Cr-enrichment peak shifts towards the surface of the passive layer. Its maximum also increases with time. Apparently the passive film shows a certain dynamical behavior, which is still active up to one week and more. These details can be seen by the high depth resolution of ISS only in comparison to XPS and they give further evidence of the excellent corrosion protection of a high Cr-content of stainless steel.

Figure 13. ISS depth profile of Fe-15Cr passivated in 0.5 M H2SO4 at E = 0.9 V for different times as indicated. 48
Download figure:
Standard image High-resolution imageXPS has been applied to examine quantitatively various species composing the passive layer on Fe/Cr alloys like the cations Fe2+ and Fe3+, the presence of O2− and OH−- ions and traces of Cr2 (SO4)3. 49 In the passive potential range (E = 0 V to 1.2 V) a bilayer is found with an outer hydroxide and an inner oxide with some Cr2 (SO4)3 at the outer part which cannot be washed off with water. This bilayer structure has been found also by other authors. 50 The details of the XPS analysis suggest a stabilization of Fe(II) within the passive oxide by Cr(III) presumably by the formation of Chromite FeCr2O4 even up to potentials of E = 0.9 V, where Fe usually is oxidized to Fe(III). With increasing Cr content of the inner oxide an increasing chromium oxide is found and less chromite. The outer hydroxide film consists mainly of Cr(OH)3. In the prepassive range (E = 0.1 V to 0.3 V) the surface layer is enriched even more in Cr(III)-oxide due to the preferential dissolution of iron, whereas in the transpassive range (E = 0.9 V to 1.2 V) Fe(III) is enriched due to the oxidation and dissolution of Cr(III) as dichromate (Cr2O7 2−). This short description shows, that the structure of passive layers is complicated and shows a detailed chemistry, which depends on the pH, the electrode potential and the time of passivation. These details have to be investigated with several surface methods in combination and with a carefully controlled electrochemical specimen preparation in the closed system. 49
FeAl-, FeSi- and Fe/Ni-Alloys
Additions of Al to Fe reduce decisively the dissolution current density of Fe in acidic solutions especially for the active/passive transition in potentiodynamic polarization curves, as shown for Fe22Al in H2SO4/Na2SO4, pH 3.8. 51 A combined XPS and ISS study shows the formation of a passive layer with a pronounced enrichment of Al in its center. Here 4He-ions were used for ISS measurements with a primary energy of E0 = 2.0 k eV. ISS depth profiles of passive layers of Fe/Al alloys with different Al content, formed for 300 s well within the passive range at E = 1.0 V are presented in Fig. 14. 51 The Al cationic fraction piles up to 70% for the alloys with 15 and 22 at% Al and to 50 at% for the Fe-8Al alloy. The detailed investigation together with XPS results leads to the assumption of an Fe-Al compound oxide within the passive layer, where Al(III)-ions can replace Fe(III)-ions within the oxide lattice. Both metal components are reactive, however Al is more reactive than Fe. The central location of the Al accumulation has been discussed on the basis of a kinetic model with a preferential oxidation of Al at the beginning of the oxidation as a highly reactive metal, which is followed by Fe oxidation. Due to the higher Fe-content within the metal, its later stronger uptake within the anodic oxide is observed. According to Rutherford Backscattering studies with Xenon markers, a comparable mobility of the cations and anions (OH−, O2−) is expected within an Al2O3 layer, which leads to new oxide growth at comparable rates at both interfaces, i.e. the metal/oxide and the oxide/electrolyte interface. 9–11 As a consequence, the Al-rich zone is preserved at the center of the anodic oxide with a higher Fe-content at both interfaces. The ISS profiles level off to the bulk alloy composition after long enough sputter times. The thicknesses relative to the Ta2O5 scale are in the range of passive layers on iron of 2 to 3 nm. The results for borate buffer pH 9.3 are similar. 51 Some more dissolution is expected in the acidic solution, which however, is negligible for sufficiently high electrode potentials of E = 1.0 V well within the passive range. XPS studies show comparable results for passivation in the range of pH 2.5 to 13.8 and in addition provide data about the valence of the cations (Fe(II), Fe(III)) and the presence of hydroxides and oxides. Very long passivation times of up to 24 h in acidic electrolyte show a slow stationary dissolution to the outer parts of the passive layer which leads to a slow shift of the Al2O3-enrichment peak from the center of the layer to the surface, which however is still present within the passive layer even after 24 h. 51 Mutual replacement of Al(III) and Fe(III) ions in the oxide matrix favors the presence of a spinel and for the maximum of 70% Al(III) of hercynite (FeAl2O4). 51

Figure 14. ISS depth profile of three Fe/Al alloys as indicated passivated in H2SO4/Na2SO4, pH 3.8 for 5 min at E = 1.0 V, horizontal lines bulk metal composition. 51
Download figure:
Standard image High-resolution imageFe/Si alloys with a Si content of 2 to 50 at% have been studied with ISS and XPS in borate buffer pH 9.3 and acetate/acetic acid buffer pH 5.0. 52,53 High Si-alloys are interesting for an application in acidic environment due to the formation of a protecting SiO2 film especially at low potentials (E < 0.4 V) where pure Fe is not protecting. For an alloy with a Si content of higher than 21 at% a continuous protecting layer of SiO2 is formed. For higher potentials a bilayer structure is found with a thick inner SiO2 -rich part and an outer Fe(III)-oxide containing part. This is seen clearly in the depth profile of Fig. 15a obtained by ISS with Helium ions. Specimen preparation in the closed system as well as the data evaluation were performed as described above. The small outer Fe oxide covers an inner layer which consists of almost pure SiO2 with a cationic fraction of 1.0 for Si(IV) at its maximum. The Si content level off to the bulk composition for sufficiently long sputter times. Figure 15a contains also the oxygen data which indicate the approach to the oxide/metal interface by its tailing off. Low Si–alloys apparently have not enough Si to form a continuous SiO2-film at low potentials in acidic electrolytes. A partial cover by SiO2 prevents even the formation of a continuous passive layer of Fe(III) oxide, which leads to a removal of the layer and an increase of the current density. Only at sufficiently high potentials of E > 0.8 V a protective film with a high Fe content is formed. So very small Si contents don´t improve passivity of Fe but a high content does with the formation of a continuous SiO2 film. 52

Figure 15. ISS depth profile of Fe-25 Si passivated for 5 min in phthalate buffer pH 5.0 at E = 1.0 V and in borate buffer pH 9.0 at E = 0.9 V, cationic fractions of Fe- and Al- ions including ISS oxygen signal (pointed curve), depth relative to sputter scale of Ta2O5. 52
Download figure:
Standard image High-resolution imageIn alkaline solutions a bilayer structure is found again with a SiO2-rich inner part covered by Fe-oxide (Fig. 15b) which consists after the XPS data at low electrode potentials of Fe(II)/Fe(III) and of mainly Fe(III) at high potentials as described already for pure Fe. 54 The Si-content increases to a somewhat smaller maximum of 80% due to less dissolution of Fe ions in alkaline solution (Fig. 15b).
As a final example an ISS depth profile is presented on Fe-53Ni passivated for 300 s in 1 M NaOH well within the passive range at E = 0.440 V. 55 A pronounced Fe-enrichment is shown in the outer part of the layer which goes up to 100% Fe ions in its center. This layer is only 1.5 nm thick as suggested by the inflection point of the sputter profile of Fig. 16. The depth scale is given again relative to the sputter characteristic of Ta2O5 as usually in surface analysis. This outer layer is followed by an inner layer of 3 nm thickness with a lower cationic fraction of Fe and consequently a related enrichment of Ni-ions. This layers goes till to the second inflection point where the metal phase starts. Apparently there is still a Ni enrichment at the metal's surface. XPS studies yield a hydroxide for the outer passive layer and an inner oxide. They also confirm the Ni-enrichment at the metal surface. 55,56 At low potentials Fe(II) is found for the outer oxide which changes to Fe(III) with increasing potential and passivation time. Ni(II) cations are oxidized to Ni(III) in the transpassive potential range starting at E = 0.64 V. They remain in the outer film as NiOOH and are lost in acidic electrolytes by dissolution. The ISS analysis of specimen prepared at different electrode potentials yields a linear growth of the inner oxide within the passive range of E = −0.3 V to 0.6 V from 2 nm up to 6 nm, whereas the thickness of the outer hydroxide remains at 1 nm and thus is almost unaffected. 55 These values agree very well with those of the XPS analysis. Time resolved XPS measurements of the growth of the passive layer from 1 ms to 1000 s yields a constant composition after 10 ms with a small Ni enrichment relative to the bulk metal and an increasing Ni-enrichment at the metals surface with time. 55,56 Fe is somewhat more reactive as Ni. Therefore, Fe(II) ions are formed at the very beginning of the passivation process in an outer layer, which are oxidized to Fe(III) with time in the passive potential range. The further oxidation builds up an Fe(III) and Ni(III) containing oxide film with a small enrichment of Ni within the oxide and at the metal surface.

Figure 16. ISS depth profile of Fe-53Ni passivated in 1 M NaOH for 300 s at E = 0.440 V, cationic fraction XFe of Fe. Arrows indicate limits of partial passive layers. 55
Download figure:
Standard image High-resolution image
XPS studies in acidic electrolyte (0.005 M H2SO4 + 0.495 M K2SO4) do not show the thin overlayer of hydroxide. Apparently the Fe rich hydroxide is dissolved effectively, which leads to a simple one-layer model with an oxide film enriched in Ni. The oxide layer increases in the passive range of E = 0.6 to 1.4 V from 1, 5 nm to 4.5 nm. 56,57 The metal surface underneath is also enriched in Ni, which is in agreement with the findings of P. Marcus and I. Olefjord. 58 A similarly strong enrichment of one of the metal components of the alloy as in the case of Fe/Cr is not observed. Here the dissolution rates of NiO and Fe2O3 are not so different, which is a requirement for a pronounced accumulation of one of them in strongly acidic electrolytes.
The formation of passive layers of Fe/Ni alloys are a further example of an effective investigation with ISS and XPS in combination. XPS cannot show the details of the layer structure due to the restricted depth resolution, whereas ISS cannot provide the important chemical information during the growth of the layer.
ISS and its Relation to Other Surface Methods
About 10 years ago ISS has been developed to a method for application of product control in some fields of industry like atomic layer deposition and the elemental composition of inorganic and organic films. 59 It also has the potential of an analytical method in corrosion research. Its monolayer depth resolution is very special and thus is a good tool for elemental depth profiling of thin layers. However, it does not provide chemical information and thus it should be used in combination with other methods like XPS. In research it often has not been used as a standalone method, but in combination with XPS with its rich chemical information as shown above. The composition of the passive layers on pure metals and binary alloys gives an insight to their corrosion protection. One main reasons for that is, that the oxides of some metals are insoluble for appropriate environments depending especially on the pH. They are in dissolution equilibrium with the contacting electrolyte as in the case of Al and Cu in weakly acidic electrolytes. Another reason is the slow dissolution kinetics of the oxides on metals like Fe, Cr and Ni in strongly acidic electrolytes, which are far of a dissolution equilibrium. Here the slow transfer of the metal cations at the oxide surface to the electrolyte cause a good or even excellent corrosion protection. This kinetic effect is a consequence of the high activation energy of this reaction step. For alloys the composition of the passive layers depicts the properties of the related oxides within the passive layer. In some cases, a compound oxide on an alloy provides even a better stability as the pure oxides alone. Furthermore, the oxidation states of the cations within of the oxides determine their protectiveness. Fe2+ is dissolving much faster as Fe3+ in acidic electrolytes. Therefore, passivity of iron is observed only at sufficiently positive potentials when Fe2O3 is formed on top of an Fe3O4 layer underneath. This is a classical system which has been studied with XPS in detail. 54 On the other hand, the addition of Cr as an alloying element to Fe improves the passive behavior decisively due to the extremely slow dissolution rate of its oxide. It is also protected against local breakdown of passivity by halides like Cl− due to the slow dissolution rate of CrCl3 at room temperature, which might be formed by anion exchange at the surface of the passive layer but does not lead to a film attack. Thus passivity can be understood by the chemistry of the chemical and kinetic properties of surface oxides, which have to be analyzed by the appropriate combination of surface methods which is XPS and ISS in these cases. Other examples are the protection of iron metal by a larger amount of Si, which forms a protective SiO2 film in acidic electrolytes, as has been discussed above.
Another important factor is the lateral resolution of the surface methods especially in the case of localized corrosion and the investigation of the role of small inclusions at the metal surface. XPS is restricted by the focus of the X-ray beam in the range of 10 μm. For ISS the focus of an ion beam might be better, but it cannot compete with that of an electron beam used for Scanning Auger Electron Spectroscopy, which achieves a lateral solution of 10 nm or better. Scanning Electron Microscopy (SEM) and the related Scanning Electron Microscope Analysis (SEMA) are further examples. For SEMA the electron induced characteristic X-ray fluorescence is used to measure the localized accumulation of species with a lateral resolution below 1 μm. With this method the accumulation of corrosion products in small corrosion pits of μm dimension and the formation of a salt layer has been examined quantitatively after calibration of the method with standards. These old studies provided insight in the basic mechanisms of pitting corrosion on Fe and Ni. 60
Last but not least a more recent in situ approach of XPS should be mentioned. Since some years some groups investigate in situ chemical gas reactions on solid catalysts at more realistic pressures in the range of some mbar and even electrode reactions on surfaces under an electrolyte film by operando Near Ambient Pressure XPS (NAP-XPS). Here the electrostatic photoelectron analyzer is kept still at a pressure of 10−7 to 10−6 mbar. This is achieved by a set of differentially pumped apertures at the entrance to the electrostatic energy analyzer with a slit of 0.1 to 1 mm size and a distance of the specimen as close as its double size. Intermediate electrostatic lenses focus the photoelectrons to the next aperture to reduce their loss and thus to improve the XPS-signals. The applied X-rays have a higher energy than the conventional 1.235 to 1.486 keV of a monochromatic X-ray source (Mg and Al Kα radiation). These so called tender X-rays of 2 to 7 keV are taken from a synchrotron radiation source. One has to choose a compromise between the higher Inelastic Mean Free Path (IMFP) of the photoelectrons and the photoionization cross section, which decreases with the increasing exciting X-ray energy. Thus the increased kinetic energy of the ejected core level electrons of the specimen is high enough to overcome the gap between the specimen surface and the entrance slit of the electrostatic analyzer. For gas phase catalytic studies, a pressure of ca. 1 mbar is acceptable at the surface of the catalyst. Depending on the mole mass of the gas the IMFP is 3 to 20 mm long. 61,62 For a much denser electrolyte film on a solid electrode an IMFP of 10 to 30 nm is expected. A 13 nm thick film of a 4 M KF solution was obtained by a dip and pull method of the electrode from an electrolyte reservoir in the preparation stage, which is thin enough to allow the passage of the photoelectrons with an IMFP of this order of magnitude. The electrolyte film was in contact with the solution of the reservoir containing the counter electrode and the reference electrode, connected to an outer potentiostat, thus providing potentiostatic in situ conditions. The specimen was connected to ground. With this set up one could follow the in situ formation of oxides on platinum or cobalt electrodes during oxygen evolution and study intermediate species during electrode reactions. 61–63 This set up might be used also for the study of passivity and the composition of passive layers by XPS. However, it is not suited for in situ ISS analysis. The ion beam probes the outmost atomic layer and cannot pass through an electrolyte film to the solid specimen surface and get out after backscattering to be measured in the electrostatic analyzer. With an electrolyte film present, one would measure the electrolyte surface only. Removing this film gives access to the surface of the passive layer underneath. But then this set up would work similarly as for a specimen which is transferred between the chambers of a spectrometer after electrochemical treatment as described above. It should be mentioned again, that one may study the intact electrochemical double layer with XPS and even with ISS, when a semi noble electro-polished electrode with hydrophobic surface condition has been pulled out of the electrolyte. On Ag the sequence of Cl−, Na+ and water sitting at the metal surface could be studied with ISS. 32 Quantitative XPS measurements on noble and semi noble metal electrodes yield the composition of the electrochemical interface in dependence of the applied electrode potential and yield even the potential of zero charge via the balance of anions and cations. 29–33 Thus the method works for the closed system as described. Parallel investigations with NAP-XPS for identical conditions would be very interesting and informative.
Conclusions
This review tries to sum up the usefulness of the application of Ion Scattering Spectroscopy to the study of passive layers. Rutherford Backscattering Spectroscopy stands for the investigation of thick anodic layers, which may be formed on valve metals, and the characteristic behavior of their alloying components. Many other aspects have been followed like the migration of anions and cations within the layer with respect to implanted noble gas makers like Xenon. The method is also closely related to implant studies to materials. However, the intention here was only to show, how the method can be used for studies on passivity.
ISS is a very useful additional method for the study of thin layers in the range of a few nm due to its unique sensitivity to the outmost surface layer with a monolayer resolution for sputter depth profiles. However, it is only one additional tool to a couple of other surface methods. It cannot provide chemical information like oxidations states of cations, the water content or the presence of hydroxides within the layers, which is the special domain of XPS. Therefore, we applied ISS always in combination with a detailed XPS study for an investigation of the passivity of various alloys to obtain an almost complete information about the chemical composition and structure of the passive layers. Usually passive layers have a bilayer or multilayer structure, which changes with the experimental or environmental factors like the electrode potential, the passivation time, the composition of the alloy and the electrolyte. A detailed chemistry of these systems should be investigated for a better understanding of their passive behavior. Structure sensitive methods like STM and AFM are excellent methods to learn about the atomic structure of these films as another important detail for a better understanding of their properties. X-ray Absorption Spectroscopy and X-ray Diffraction with grazing incidence of the beam are other structure sensitive in situ methods.
A very important condition for these surface studies is a well-controlled specimen preparation, to get reliable conclusions, free of changes or artifacts caused by their uncontrolled contact to the environment. Therefore, a brief description of a closed system with the specimen preparation within an electrochemical chamber attached to the spectrometer and its transfer to the analytical chamber has been added to this paper.