

Abstract
Binder-free and flexible oxygen-vacancy CeO2@C core–shell nanocomposites directly anchored on carbon cloth (CC) are prepared via a simple two-step process, in which CeO2 nanoparticles are hydrothermally fabricated and mixed with polyvinylpyrrolidone (PVP) composites, subsequently, as-formed CeO2@PVP composites coated on CC are calcined at 700 °C. The morphologies, structures and electrochemical properties of as-obtained CeO2@C nanocomposites are studied by SEM, HRTEM, XRD, XPS and electrochemical techniques, respectively. The CeO2@C nanocomposites are composed of the CeO2 core with diameter of about 10 nm and the carbon shell with thickness of about 1.5 nm. The electrochemical results reveal that the CeO2@C nanocomposites show a wide electrochemical active window of −1.0 ∼ 0.8 V and a specific capacitance of 141.56 F g−1 at 1 A g−1 in 1.0 M Na2SO4 electrolyte. In addition, an asymmetric supercapacitor (ASC) assembled with CeO2@C and poly(3,4-ethylene dioxythiophene) (PEDOT) can work in the wide operational voltage region of 2.0 V and deliver the energy density of 11.12 Wh kg−1 at 2000 W kg−1. The present study indicates that the CeO2@C will have a greater advantage in terms of energy density for CeO2 and its carbon-based composites supercapacitor electrodes.
Export citation and abstract BibTeX RIS
As rapid development of the internet and electronics industries, portable electronic products and automotive energy power systems have spread all over the world, and it is of vital importance to develop clean, sustainable high-performance energy storage devices. 1,2 As most promising energy storage devices, supercapacitors (SCs) possess many excellent features including high power density, fast charge/discharge rate, a long-life span and high reliability. Generally speaking, the size, morphology and composition of the electrode materials determine the capacitance performance. 3 Transition metal oxides and transition metal sulfides, for instance, RuO2, V2O5, MnO2 MoS2 and WS2 have been extensively investigated. 4–6 Among them, as the most promising redox electrode material, RuO2 exhibits good capacitive performance, while high price and toxicity greatly limit its practical application. 7 NiO, MnO2, Co3O4 and other low-cost environmentally friendly metal oxides have been widely studied as a substitution for RuO2. 8–11
CeO2 has drawn intensive attention due to its environment-friendly, low price and electrochemical redox feature. 12 And CeO2 is widely used in the field of catalysis, oxygen gas sensing, solid oxide fuel cells and charge storages. 13–19 In addition, Ce3+ and Ce4+ can quickly and conveniently interconvert in CeO2. Increasing content of Ce3+ can accelerate electron transport and ion diffusion thus improve capacitive performance, making it an important SC material. 20–23 Recently, Li et al. synthesized core–shell structured CeO2@MoS2 by using a wet chemistry strategy, which exhibited a specific capacitance of 102 mF cm−2 at 0.64 mA cm−2. 20 Zhu et al. reported that CeO2@MnO2 nanocomposites exhibited a specific capacitance of 255 F g−1. 24 Kumar et al. reported grapheme/silver/platinum/CeO2 nanocomposites with a high capacitance of 208 F g−1 at 1 A g−1. 25 It is worth noting that the above studies have improved the capacitance performance of CeO2 by adding highly conductive materials. However, when CeO2 is acted alone as SCs electrode material, it exhibits poor capacitance performance. For example, Dezfuli et al. synthesized CeO2 nanoparticles by a sonochemical route exhibiting a specific capacitance of 91 F g−1 at 2 mV s−1. 26 He et al. synthesized CeO2 by facile hydrothermal method showing the capacitance of 46.63 F g−1. 27 The low specific capacitance is due to its low conductivity, which also brings poor long-term electrochemical performance and rate performance. CeO2/carbon composites can improve capacitive performance by enhancing the conductivity. Recently, Wang's research group constructed three-dimensional CeO2/graphene nanocomposites with specific capacitance of 278 F g−1. 28 Aravinda et al. fabricated a composite of CeO2/activated carbon with a specific capacitance of 162 F g−1. 29 Li and Liu reported the synthesis of CeO2 modified rGO composites delivering a capacitance of 282 F g−1 at 2 A g−1. 30 CeO2 in the composite materials is only located on the surface of the carbon material, and it will cause expansion and decomposition during continuous charging and discharging process. 31 Besides, the electrode fabrication often needs none-conductive binder, which results low specific capacitance, poor rate capability and unsatisfied cycling stability.
To improve CeO2 capacitance performance, two aspects can be taken into consideration: (1) constructing binder-free electrodes, (2) architecting core–shell structure composites. On the one hand, CeO2@C core–shell structure can improve capacitance performance, on the other hand, the introduction of highly conductive carbon layer not only increases the structural stability of CeO2, but also enhances the ionic and electronic mobility. So far binder-free CeO2@C composite electrode has not been reported.
Herein, we report the synthesis and the fabrication of a binder-free and flexible CeO2@C composite electrode on the carbon cloth (CC) via a hydrothermal method combined with a subsequent annealing process, which exhibits CeO2 core diameter of 10 nm and shell thickness of 1.5 nm. The electrochemical tests demonstrate CeO2@C has a high electrochemical activity at wide potential window of 1.8 V in 1.0 M Na2SO4 electrolyte and a specific capacitance of 141.56 F g−1 at 1 A g−1. Compared with CeO2 electrode prepared by traditional method, the CeO2@C composite electrode demonstrates exciting potential for high performance supercapacitor.
Experimental
Materials
Ce(NO3)3·6H2O (99.99%) was purchased from Adamas Reagent Co., Ltd. Poly(vinylpyrrolidone) (PVP, K13-18, Mv ≈ 10000) was purchased from Aladdin Reagent Co., Ltd. and ammonia solution (25%–28%), sulfuric acid (98%) as well as absolute ethanol were used from Xilong Chemical Industry Incorporated Co., Ltd. Sodium hydroxide (NaOH, A.R. degree), and polymerized styrene butadiene rubber (SBR, 48%–52%) were received from Shanghai Vita Chemical Reagent Co., Ltd. 3,4-Ethylenedioxythiophene (EDOT) was received from Energy Chemical (Shanghai, China). The water used throughout the experiment was deionized water. CC (W1S1005) was purchased from Ce Tech Co. Ltd., which was ultrasonically treated in acetone, ethanol and deionized water, then dried at 60 °C for 12 h before use. All chemicals have not undergone any purification and treatment before use.
Preparation of CeO2 and CeO2@C
The CeO2 was synthesized by hydrothermal process. Namely, 3.9 mmol Ce(NO3)3·6H2O was dissolved in 50 ml deionized water under stirring. Then 7 ml NaOH (0.1 mol l−1) and 3 ml ammonia solution (0.5 mol l−1) were added dropwise under vigorous stirring for 10 min. The mixed solution was transferred into an autoclave and heated hydrothermally at 140 °C for 1 h. Finally, as-obtained product was washed for 3 times with deionized water and dried in a vacuum oven at 60 °C.
For preparation of CeO2@C electrode, CeO2 and PVP (CeO2 content: 50 wt%) were ground for 10 min and then ultrasonically dispersed in ethanol aqueous solution (water content: 50%) for 20 min. And the mixture was uniformly coated on the treated CC (area: 2 cm2). Finally, the CeO2@PVP/CC was placed in a vacuum oven at 60 °C for 12 h, then heated and maintained temperature at 700 °C for 30 min under N2 atmosphere, finally cooled down to room temperature.
For preparation of CeO2 electrode, CeO2 was heated and maintained temperature at 700 °C for 30 min within N2 atmosphere. 80% of the prepared material, 10% conductive addiction (super p) and 10% binder (SBR) were mixed into an appropriate amount of ethanol aqueous solution, and then the mixture was dropped onto the CC, finally, dried in a vacuum oven at 60 °C for 12 h.
Characterization
The morphology of the as-prepared samples was analyzed by scanning electron microscopy (SEM, JSM-7500F, JEOL, Japan) and high resolution transmission electron microscopy (HRTEM, Tecnai-G20, FEI, America). X-ray photoelectron spectroscopy (XPS, Escalab 250Xi, Thermo Fisher Scientific, America) was conducted to investigate valence states of elements. X-ray diffraction (XRD, Bruker D8, Bruker, Germany) with Cu Kα (λ = 0.154056 nm) was carried out to check crystal structure. The electrochemical performance of electrodes was tested at room temperature using CHI660E electrochemical analyzer (Shanghai, China), containing cyclic voltammetry (CV), galvanostatic charge/discharge (GCD), cycle stability and electrochemical impedance spectroscopy (EIS). The platinum electrode was used as the counter electrode and saturated calomel electrode (SCE) was used as reference electrode. The Na2SO4 solution (1 M) and H2SO4 solution (1 M) were used as the electrolyte in 3-electrode and 2-electrode system, respectively. The specific capacitances (CS) of the electrode are calculated according to the CV and GCD curves by following formula:


Where "E1 " and "E2 " are the starting and ending potentials in CV, respectively. "i(E)" represents the instantaneous current, and "i(E)d(E)" represents the area enclosed by the CV curve gained by integration of the positive and negative sweeps in the CV, "v" represents scan rate (V s−1), and "m" represents mass (g) of the electrode. "I" represents charge and discharge current (A), and "Δt" represents the discharge time (s), "ΔV" represents the voltage window (V) during discharge. 32 Energy density (E, Wh kg−1) and power density (P, W kg−1) are calculated by following equations: 33


Where Cs represents the specific capacitance of single electrode for device and "m" represents total mass (g) of the electrodes of the ASC device.
Results and Discussion
The preparation of CeO2@C is briefly described in Fig. 1, and the prepared CeO2@C (about 2 mg cm−1) can directly be anchored on the CC substrate, forming a flexible and robust electrode. The CeO2@C/CC electrode can be bend to any angle. From the TEM and HRTEM images, as-prepared CeO2 nanoparticles have uniform size of about 10 nm diameter (Fig. 2a), and there are no other substances on the surface of CeO2 nanoparticles (Fig. 2b). The CeO2@PVP composites are easily formed when the CeO2 nanoparticles and PVP are mixed, and CeO2@PVP composites can be well coated on the CC substrate. After calcining 700 °C at N2 atmosphere, the color of CeO2@PVP turned from pale yellow to black. In Fig. 2c, the CeO2@C composites are uniformly arranged on the CC substrate. Fig. 2d shows the core–shell structure of CeO2@C with core diameter of about 10 nm and the carbon layer shell diameter of about 1.5 nm. It can be calculated that the lattice space is 0.308 nm corresponding to the (111) plane. The selected area electron diffraction (SAED) pattern of CeO2@C exhibits several distinct diffraction rings, from inside to outside assigned to the (111), (200), (220) and (311) planes of CeO2 (Fig. 2e). At the same time, the well-resolved intense rings indicate the polycrystalline nature. In the XRD pattern (Fig. 2f), the CeO2@C composites show characteristic diffraction peaks at 28.52°, 33.13°, 47.54°, 56.38°, 59.21°, 69.48°, 76.83°, 79.15° and 88.52° with corresponding phasic indexes of (111), (200), (220), (311), (222), (400), (311), (420) and (422) (JCPDS PDF#75-0120).
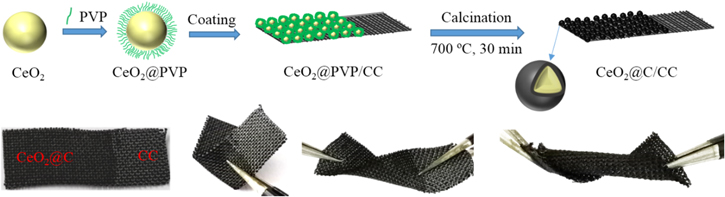
Figure 1. Schematic illustration of preparation of flexible CeO2@C electrode and its twisted states.
Download figure:
Standard image High-resolution image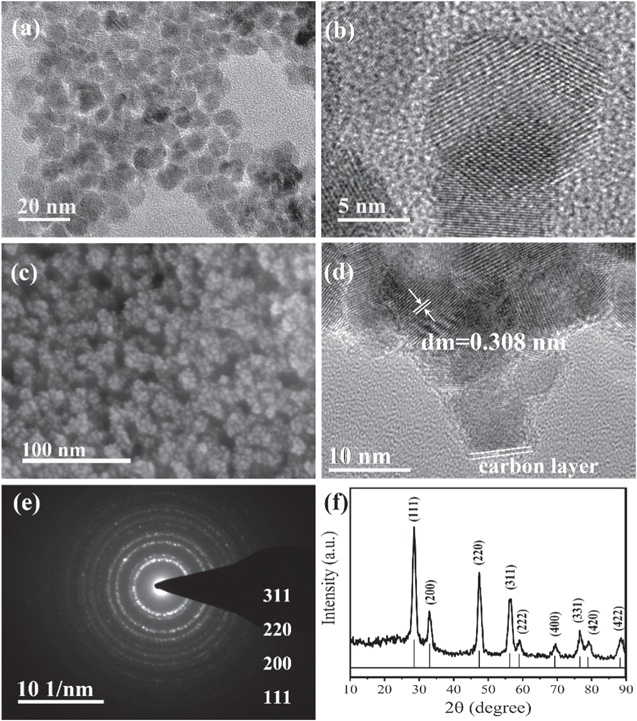
Figure 2. TEM (a) and HRTEM (b) images of the CeO2, SEM (c), HRTEM (d), SAED (e) and XRD (f) of the CeO2@C.
Download figure:
Standard image High-resolution imageAs shown in Fig. 3, the chemical composition of as-synthesized CeO2@C was investigated by XPS. In Fig. 3a, the XPS survey spectrum shows that CeO2@C is composed of Ce, C and O. In Fig. 3b, the Ce 3d XPS spectrum consists of eight sub-peaks, two of which are located at 903.6 eV and 907.2 eV, representing the 3d104f1 electronic configuration related to Ce3+ oxidation state. 34,35 The other six sub-peaks at 881.7 eV, 882.8 eV, 888.5 eV, 898.2 eV, 900.8 eV and 916.5 eV correspond to the 3d104f0 electron configuration of the Ce4+ oxidation state. 36,37 The results indicate that there are both Ce3+ and Ce4+ valence states in the sample. In Fig. 3c, the C 1s consists of three sub-peaks: C–C (284.5 eV), C–O (285.25 eV) and C=O (286.34 eV), which are attributed to carbon derived from PVP. As depicted in Fig. 3d, the O 1s spectrum is mainly divided into three sub-peaks, which are chemisorbed water (OW) located at 532.4 eV, oxygen atoms in the vicinity of an oxygen vacancy (OV) located at 531.2 eV and lattice oxygen (OL) located at 529.6 eV, 38 respectively. By using the ratio of the sum of the integrated peak intensity regions related to Ce3+ and Ce4+, the relative content of Ce3+ and Ce4+ of sample can be calculated. 39 Ce3+ triggers the creation of oxygen vacancy defects in CeO2 lattice. So the larger ratio of Ce3+/Ce4+, the higher percentage of oxygen vacancies. The relative concentration of Ce3+ valence state of CeO2@C is calculated to be 14.86% according to the peak area percentages of different element components. The more Ce3+ ions, the more oxygen vacancies are formed on the CeO2 surface. 40–42 More importantly, oxygen vacancies are proven to accelerate the ion diffusion and charge mobility because the oxygen vacancies migration in CeO2 occur through a jumping mechanism, 43,44 Similar to the calculation method of cerium valence state, the OV peak area percentage is calculated to be 11.23%. The presence of oxygen vacancies can enhance electronic conductivity and promote the kinetics of surface reactions, 22 thereby enhancing electrochemical reactions. 45 In addition, oxygen vacancies can also be used as active sites for redox reactions to increase the capacitance. 46–49
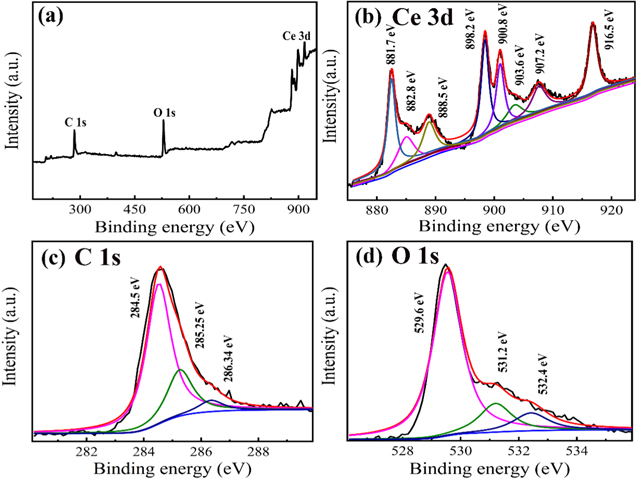
Figure 3. XPS survey spectra (a) and XPS deconvolution of Ce 3d (b), C 1s (c) and O 1s (d) of CeO2@C.
Download figure:
Standard image High-resolution imageFig. 4 shows the electrochemical performance of CeO2@C. For comparison, CV of the pure CeO2 treated under 700 °C for 30 min is tested. The area of the CV curve is in proportion to capacitance. In Fig. 4a, the CV curve integrated area of the CeO2@C electrode is far larger than that of pure CeO2, which indicates that the CeO2@C composites exhibit much higher capacitance than pure CeO2. According to the results, it can be judged that the utilization rate of pure CeO2 nanoparticles is poor, which may be due to their low specific surface area and poor conductivity. However, the CeO2@C nanocomposites have a much higher conductivity due to the existence of carbon layer, which is conducive to the rapid transmission of electrons, thus greatly improving the utilization of the active materials. More importantly, the CeO2@C shows strong electrochemical activity in a very wide potential range of −1 ∼ 0.8 V. The CV curves of CeO2@C are also investigated at the different scan rates (Fig. 4b). In the CV curves, the broad redox peaks at about 0.23/0.35 V and −0.71/−0.63 V are attributed to the conversion of Ce3+/Ce4+ related to the redox reaction of CeO2, 50–52 as shown in the Eqs. 6, 7.


It can be observed that the CV curves of CeO2@C have no obvious distortion from 5 mV s−1 to 100 mV s−1, implying excellent stability and capacitance performance. Based on Eq. 1, the CeO2@C exhibits 72.67 F g−1 at scan rate of 100 mV s−1, only 26.80% decrease when the scan rate increased up to 100 mV s−1 (Fig. 4c), indicating outstanding rate capability. The nonlinear GCD curves of CeO2@C also prove the occurrence of redox reaction (Fig. 4d). Based on Eq. 2, the specific capacitance of CeO2@C reaches 141.56 Fg−1 at 1 Ag−1 (Fig. 4e). As the current density increased, the specific capacitance gradually decreased. This is because the electrolyte ions cannot diffuse into the bulk phase of active material in time at high current density. Fig. 4f displays that the CeO2@C electrode has a good cycling stability after 3000 cycles.
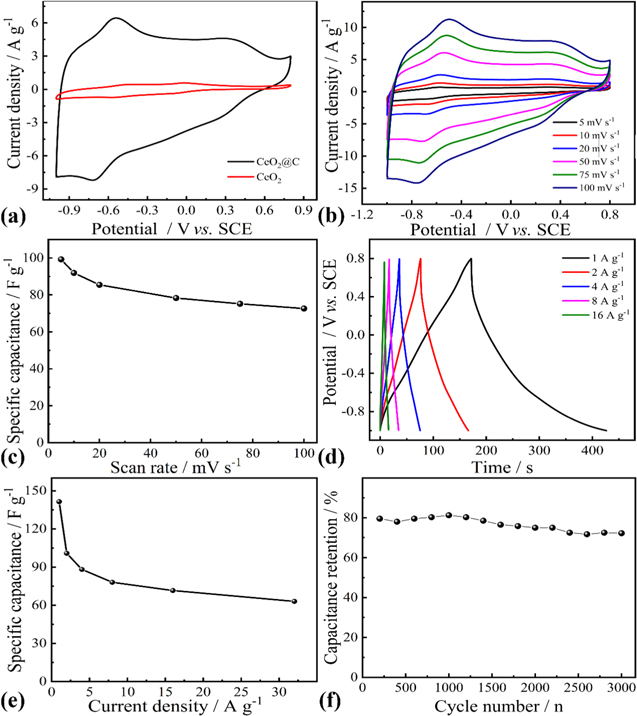
Figure 4. (a) CV curves of CeO2@C and CeO2 at 50 mV s−1, (b) CV curves of CeO2@C at different scan rates, (c) Specific capacitance of CeO2@C as a function of scan rates, (d) GCD curves of CeO2@C at different current densities, (e) Specific capacitance of CeO2@C as a function of current densities, (f) Cycling stability of CeO2@C at 8 A g−1.
Download figure:
Standard image High-resolution imageImpedance spectrum curve demonstrates the response of the electrode and electrolyte to frequency, which is divided into a semicircle in high frequency region and an inclined line in low frequency region. The semicircle diameter corresponds to charge transfer resistance (Rct) between electrode and electrolyte, and inclined line reflects the ion diffusion of the electrode. And the intercept of curve on real axis corresponds to equivalent series resistance (ESR, Rs). 53 In Fig. 5, the CeO2@C electrode exhibits big slope in low frequency region, very small semicircle (Rct, 0.5 Ω) and low ESR (Rs, 2.7 Ω) in high frequency region.

Figure 5. Nyquist plot of CeO2@C composite in the frequency range of 0.01 Hz to 100 kHz.
Download figure:
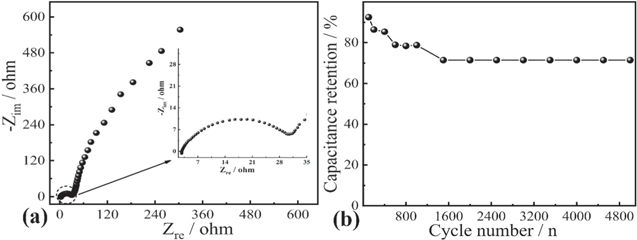
Standard image High-resolution imageThe CV curves in Fig. 6a display that the CeO2@C and poly(3,4-ethylene dioxythiophene) (PEDOT) electrodes have stable electrochemical activity in negative polarization and positive polarization in three electrode system, respectively. It is expected that an asymmetric supercapacitor (ASC) can be assembled with CeO2@C as negative electrode and PEDOT as positive electrode. Fig. 6b displays the CV curves of the ASC at different scan rates and demonstrates that the operational voltage window reaches 2.0 V. In Fig. 6c, based on Eq. 3, the specific capacitance of ASC is calculated to be about 80.0 F g−1 at 2 Ag−1, and at 5 Ag−1, the specific capacitance is about 57.6 F g−1. Fig. 6f represents Ragone plot, and the ASC exhibits a maximal energy density of 11.12 Wh kg−1 and a power density of 2000 W kg−1, which is higher than those values recently reported for CeO2 and its carbon-based composites supercapacitor (Table I). The EIS of the ASC is further tested. In Fig. 7a, it can be seen that the Rs is about 2.8 Ω and Rct value is about 27.2 Ω. The cycle stability of ASC has also been tested (Fig. 7b). There is still a capacitance retention of 71.43% after 5000 cycles, presenting good cycling stability.

Figure 6. Electrochemical performances of ASC: (a) Comparative cyclic voltammograms of CeO2@C and PEDOT electrodes in three electrode system at a scan rate of 50 mV s−1, (b) CV curves at different scan rates, (c) GCD curves at different current densities, (d) Specific capacitance as a function of scan rates, (e) Specific capacitance as a function of current densities, (f) Ragone plot.
Download figure:
Standard image High-resolution imageTable I. Comparison with those reported devices based on CeO2 materials.
| Materials | Voltage range | Energy density | Power density | References |
|---|---|---|---|---|
| CeO2/activated carbon | 1.0 V | 4.86–5.62 Wh kg−1 | 289–3500 W kg−1 | 29 |
| CeO2 nanoparticles | 0.5 V | 2.5–5.1 Wh kg− 1 | 250–1000 W kg−1 | 54 |
| Hollow CeO2 nanospheres | 0.55 V | 5 Wh kg−1 | 1000 W kg−1 | 31 |
| CeO2 nanoparticles | 0.8 V | ∼8.064 Wh kg−1 | 100 W kg−1 | 35 |
| CeO2 nanorod framework | 1.5 V | 2.98–5.83 Wh kg−1 | 74.96–1500.4 W kg−1 | 55 |
| CeO2@C | 2.0 V | 11.12 Wh kg−1 | 2000 W kg−1 | This work |
Figure 7. Nyquist plot (a) and cycling stability (b) of ASC device at 5 A g−1.
Download figure:
Standard image High-resolution image
Conclusions
In summary, for the first time, we synthesized and fabricated a binder-free and flexible CeO2@C composite electrode on CC via a hydrothermal method combined with a subsequent annealing process. As-prepared CeO2@C exhibits CeO2 core diameter of 10 nm and carbon shell thickness of 1.5 nm. The CeO2@C has an electrochemical active window of 1.8 V and delivers a specific capacitance of 141.56 F g−1 at 1 A g−1. And the ASC is fabricated by using CeO2@C as negative electrode and PEDOT as positive electrode, which can be operated in a 2.0 V voltage window. The energy density of ASC reaches 11.12 Wh kg−1 at power density of 2000 W kg−1. Hence, these results indicate that CeO2@C is a promising electrode material for electrochemical energy storage application.
Acknowledgments
This work was supported by the National Natural Science Foundation of China (grant nos. 51862011, 51662012, 51863009), Jiangxi Outstanding Young Talent Fund Projects (20171BCB23076), the Natural Science Foundation of Jiangxi Province (20171BAB206013), Jiangxi Provincial Department of Education (GJJ201108) and Scientific Research Projects (YC2019-X14) of Jiangxi Science and Technology Normal University.