
Abstract
The energy density of traditional Li−Si/FeS2 thermal batteries, which multiple cations are contained in molten salt electrolyte, is limited by the deficiency of Li+ in cathode when a high discharge current is applied. To address this issue, LiCl−KCl is taken as an example to build a functional gradient structure through Li−Si/FeS2 thermal batteries. By levering the Li+ concentration in cathode and preventing the formation of high concentration polarization resistivity as well as molten salt precipitation, the energy density of Li−Si/FeS2 single cell with a discharge current of 500 mA cm−2, increase from 157.0 Wh kg−1 to 218.4 Wh kg−1 at 450 °C (with an increase ratio of 39.1%), compared with the original one. Similarly, a 25.6% raise is observed at 525 °C. Moreover, the effects of LiCl-rich electrolyte and the functional gradient structure on the electrochemical performance of Li−Si/FeS2 single cells are discussed and classified.
Export citation and abstract BibTeX RIS
Thermal batteries are regarded as the main power sources for weapons such as missiles and torpedos, due to its high power density with fluid molten salt electrolyte, and long storage life with solid salt as separator. 1–3 After the activation of thermal batteries in seconds (1), the fluid molten salt electrolyte is transferred from the solid salt separator by absorbing the heat of the adjacent pyrotechnic powders. Compared with traditional Li−Si/FeS2 thermal batteries that can only work bellow 550 °C due to the thermal decomposition of FeS2, 4 lithium halide-based mixtures include LiCl−KCl, LiF − LiCl−LiBr, and LiCl−LiBr−KBr are able to withstand high temperature, thus can be adopted as molten salt electrolytes. 5–7
Usually, in order to increase the electrochemical reaction area of Li-Si/FeS2 thermal batteries, molten salts are added into FeS2 with a range of 0 ∼ 40 wt.% to construct a composite cathode. 8,9 During the discharge process, while Li+ is consumed in cathodes, composition gradient of the molten salt is formed due to the limited diffusion of Li+ in the non-all-lithium molten salt system. 10–12 Moreover, when a high discharge current is applied, the decreased concentration of Li+ near the electrochemical active sites will lead to high polarization resistivity, which further lowers both the discharge voltage and the energy density of thermal batteries. Even worse, the molten salt will precipitate because of the elevated liquid point temperature. 13,14
The all lithium molten salt electrolyte, LiF−LiCl−LiBr, is capable of avoiding deviation of cation, and exhibiting quite high ion conductivity. 6,15 However, its melting point is high (430 °C), 16 making it not suitable for thermal batteries, which have requirements for temperature range from −55 to +75 °C. 1 Other all lithium molten salt electrolytes also exhibit high melting points except those contain LiI. 6,15,17,18 Nevertheless, severe hygroscopicity of this kind of material impede their practical applications. 6,19 Therefore, strategies that can suppress the deficiency of Li+ in cathode are highly necessary.
Here, we report a functional gradient structure to enrich the active lithium ions around the electrochemical active sites of the cathode by using molten salt with multiple cations. In this contribution, LiCl−KCl is taken as an example to construct a functional gradient structure to enrich the active lithium ions around the electrochemical active sites of the cathode. Moreover, increased energy density is achieved in Li−Si/FeS2 thermal batteries, which meet/satisfy their need of high-power output.
Experimental
Materials preparation
Molten salt electrolytes (E) of x wt.% LiCl−(100-x) wt.% KCl (x = 45, 50, 70, designated as E1, E2, E3 respectively), electrolyte binder (EB) of 60 wt.% MgO−40 wt.% Ey (y = 1, 2, 3 and labeled as EB1, EB2, EB3, respectively), cathodes of 78 wt.% FeS2−22 wt.% Ey (y = 1, 2, 3 and denoted as C1, C2, C3, respectively), were prepared by using LiCl (Kermel, AR), KCl (Kermel, AR), MgO (Kermel, AR) and FeS2 powders that filtered with a 100-mesh sieve (Jiangsu Metallurgical Research Institute Co., Ltd, ≥ 95wt.%). For simplicity, all the simplified labels included in the text were listed in the Appendix (Table A·I). Before weighting, KCl and LiCl were calcined at 300 °C for 4 h, to remove the absorbed water. MgO powders were also burned at 600 °C for 2 h, to eliminate the impurities. The chlorides and MgO in E or EB were mixed at specified ratios and ball-milled at a speed of 300 rpm for 2 h. These mixtures were then burned at 600 °C for 4 h, followed by ball-milling as above to achieve the fine E or EB powders. The cathode materials were obtained by ball-milling FeS2 and E powders in proportion at a speed of 300 rpm for 2 h. All materials were prepared in a dry room with a dew point ≤−50 °C.
Wettability measurement
Dense FeS2 block (Jiangsu Metallurgical Research Institute Co., Ltd, ≥95 wt.%) polished with 500#, 1000#, 2000# sandpaper in sequences, and cleaned with deionized water or alcohol for several times, was used as the substrate for the wettability measurement. Around 10 mg molten salt pellets (E1, E2, E3) were shaped into a die with a diameter of 2 mm. The contact angles of E1, E2, E3 on FeS2 were measured at 450 °C in an Ar-filled glove-box (H2O < 0.1 ppm and O2 < 0.1 ppm), by using a video-based optical contact angle measure systems (OCA25, DataPhysics Instruments).
Electrochemical measurement and material characterization
Single cells of Li−Si/EBz/Cd (z, d = 1, 2, 3) (as illustrated in Fig. 1) were fabricated by uniaxially die pressing 0.2 g Li−Si (44 wt.% Li−56 wt.% Si, Beijing Derui Technology Co., Ltd), 0.3 g EBz, 0.4 g Cd powders via layer-by-layer assembly technique. All materials were prepared in a stainless steel die with a diameter of 22 mm and under pressure of 100 MPa. For simplicity, the single cells were written as HS1, HS2, HS3, IHS2, IHS3, with (z, d) equal to (1, 1), (2, 2), (3, 3), (1, 2), (1, 3), respectively. The discharge performances of single cells were performed at a constant discharge current of 500 mA cm−2, and pulse discharge current of 1000 mA cm−2 (1 s) with an interval of 20 s. For the open circuit voltage (OCV) measurement, specimens composed of EB1 (0.3 g)/EB1 (0.4 g) (labeled as OS1) and EB1 (0.3 g)/EB3 (0.4 g) (labeled as OS2), were prepared with the same routes of single cells, but with Mo plates as electrodes. Before discharge performance test, each single cell was placed onto the heating plate of a home-made furnace for 300 s to achieve the stable working temperature. Before the OCV test, it took 50 s for the specimen to melt the molten salt. All the electrochemical measurements were carried in an Ar-filled glove-box (H2O < 0.1 ppm and O2 < 0.1 ppm) at 450 and 525 °C. Current and voltage of samples were recorded by a Land CT2001A battery test system. For the elements distribution test, a scanning electron microscope (SEM, Phenom Prox) was utilized to examine the distribution of K+ and Cl− ions in OS2, before and after heating at 450 °C for 1000 s.
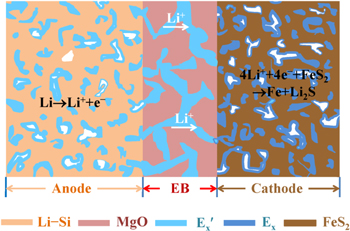
Figure 1. Schematic diagram of single cells of Li−Si/EBz/Cd (z, d = 1, 2, 3).
Download figure:
Standard image High-resolution imageResults
Electrical conductivity and phase composition of LiCl−KCl
Table I lists the estimated average electrical conductivities (κ), the liquid points, and phase compositions of E1, E2, E3 at 450 and 525 °C. Data in this table is based on the data reported in Refs. 20, 21, and phase diagram information provided by FactSage thermochemical software. Detailed estimated process of κ are described in the Supporting Information (available online at stacks.iop.org/JES/168/010503/mmedia). The liquid points of E1, E2, and E3 are 352, 395, 513 °C, respectively. Consequently, at 450 °C, they are all present as liquid phases except E3, which contains 72 vol.% liquid and 28 vol.% solid. The κ of Ey (y = 1, 2, 3) increases with increased LiCl amount at 525 °C, while κ of E3 exhibits the lowest at 450 °C.
Table I. The estimated κ, the liquid points and phase compositions of E1, E2, E3 at 450 and 525 °C.
| 450 °C | 525 °C | ||||
|---|---|---|---|---|---|
| Ex | Liquid point (°C) | κ (S cm−1) | Phase compositions | κ (S cm−1) | Phase compositions |
| E1 | 352 | 1.54 | 45 wt.% LiCl−55 wt.% KCl (Liquid) | 2.01 | 45 wt.% LiCl−55 wt.% KCl (Liquid) |
| E2 | 395 | 1.70 | 50 wt.% LiCl−50 wt.% KCl (Liquid) | 2.16 | 50 wt.% LiCl−50 wt.% KCl (Liquid) |
| E3 | 513 | 1.40 | 58 wt.% LiCl−42 wt.% KCl (Liquid) +LiCl (Solid) | 2.97 | 70 wt.% LiCl−30 wt.% KCl (Liquid) |
Wettability measurement of LiCl−KCl on FeS2
Figure 2 shows the contact angles of LiCl−KCl with varied LiCl contents on FeS2 at 450 °C, under Ar atmosphere. The average value of the left and right contact angles is 122.2° for E1, in good agreement with literature. 22 For E2 and E3, the average contact angles are 128.1° and 151.8°, respectively. The results suggest that less wettability of LiCl−KCl on FeS2 is expected with higher LiCl concentration in this research region. The reason is ascribed to the increased surface tension of molten salt, as described in Ref. 21. It should be noticed that no bright plot was observed in the "drop" of E3 (Fig. 2c), as it is composed of liquid and solid salt phase.
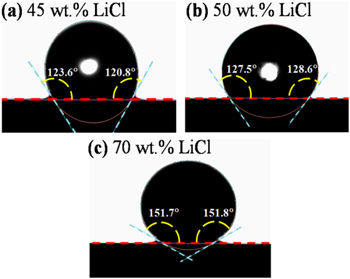
Figure 2. Contact angles of LiCl−KCl with varied LiCl contents on FeS2 at 450 °C under Ar atmosphere: (a) E1; (b) E2; (c) E3.
Download figure:
Standard image High-resolution imageElectrochemical performance of single cells with a functional gradient structure
Figure 3 illustrates the discharge curvess and energy density of HS1, IHS2, IHS3 measured at 450 and 525 °C, with a cut-off voltage of 1.0 V. The discharge voltage and energy density of IHS2 and IHS3 are higher than that of HS1, indicating that the functional gradient structure is beneficial for the energy density enhancement. The energy density rises about 39.1%, from 157.0 Wh kg−1 of HS1 to 218.4 Wh kg−1 of IHS2 at 450 °C, while 25.6%, from 269.5 Wh kg−1 of HS1 to 338.8 Wh kg−1 of IHS3 at 525 °C. IHS2 exhibits the highest energy density at 450 °C. However, at 525 °C, IHS3 shows the best performance instead of IHS2. Normally, two effects as the electrical conductivity as well as Li+ concentration of the molten salt electrolytes are mainly affecting the electrochemical performance of IHS2, IHS3. At 450 °C, the Li+ concentration in E3 with liquid state (58 wt.% LiCl−42 wt.% KCl) is higher than that in E2 (50 wt.% LiCl−50 wt.% KCl), but the electrical conductivity of E3 is lower compared to that of E2, because of the existence of solid phase in E3. The competitions between the positive effect of increased Li+ concentration and the passive effect of decreased electrical conductivity in E3 compared to that of E2, leading to the worse electrochemical performance of IHS3 than that of IHS2 at 450 °C. On the contrary, at 525 °C, both the Li+ concentration and electrical conductivity of E3 are higher than that of E2, leading to the better electrochemical performance of IHS3 against that of IHS2.
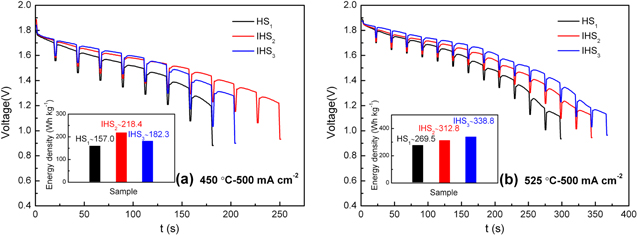
Figure 3. Discharge curves and energy density of HS1, IHS2 and IHS3, with a cut-off voltage of 1.0 V, measured at 450 °C (a) and 525 °C (b).
Download figure:
Standard image High-resolution imageFigure 4 depicts the effective cell resistivity (Rcell) of HS1, IHS2, IHS3 at 450 and 525 °C. The value of Rcell, includes ohmic and concentration/migration contributions, was calculated via Eq. 1, 23 and data shown in Fig. 3. The Rcell increases during the discharge process, due to the generation of reaction products with low conductivity, 4,23 and the concentration gradient formed during the discharge process. 10–12 In general, the numerical value of Rcell follows an order as HS1 > IHS2 > IHS3 at 525 °C, and the initial stage of the discharge process at 450 °C. Nevertheless, for the latter stage at 450 °C, Rcell of IHS3 increases more rapidly compared to that of IHS2, and even becomes a little higher than that of HS1. The existence of solid phase in E3 contained in cathodes at 450 °C, might be responsible for the rapidly increase of Rcell in IHS3 compared to that of the others.

where ΔI represents the difference between the pulse and constant current, V1 and V2 represent the instant voltage before and after the applied pulse current, respectively.

Figure 4. Rcell of HS1, IHS2, IHS3 at 450 °C (a) and 525 °C (b).
Download figure:
Standard image High-resolution imageElectrochemical performance of single cells with the unitary molten salt electrolyte
Figure 5 shows the discharge curves of HS1, HS2, HS3, with a cut-off voltage of 1.0 V, measured at 450 and 525 °C, respectively. The energy density of the measured cells follows an order of HS1 > HS2 > HS3 at 450 °C, while HS2 > HS3 > HS1 at 525 °C. The results above indicate that the Li+-rich electrolyte can improve the electrochemical performance of Li−Si/FeS2 thermal batteries at 525 °C. However, it does not follow the same order as the magnitudes of κ. The electrochemical performance of HS3 is less satisfied compared to that of HS2, though it contains much higher Li+ contents. The reason can be explained that at 450 °C, the Li+-rich molten salt exhibits adverse effect on the electrochemical performance, and the adverse effect becomes bigger when the concentration of LiCl is higher.

Figure 5. Discharge curves, and energy density of HS1, HS2, HS3, with a cut-off voltage of 1.0 V, measured at 450 °C (a) and 525 °C (b).
Download figure:
Standard image High-resolution imageFigure 6 illustrates the Rcell of HS1, HS2, HS3 at 450 and 525 °C, calculated with the data presented in Fig. 5. At 450 °C, the Rcell of HS3 is much higher compared to that of HS1 and HS2, ascribed to the low ion conductivity (less proportion of liquid phase) of HS3, as listed in Table I. The Rcell of HS2 is also higher than that of HS1 at the latter stage of the discharge process. At 525 °C, the difference of the Rcell among HS1, HS2, HS3 is not obvious at the initial stage of the discharge process. However, at the latter stage, the Rcell of HS1 and HS3 become much higher compared to that of HS2. The results indicate that LiCl-rich molten salt is not suitable for Li−Si/FeS2 thermal batteries, as they require high-power density and low working temperature at the same time.

Figure 6. Rcell of HS1, HS2, HS3 at 450 °C (a) and 525 °C (b).
Download figure:
Standard image High-resolution imageCorrelation of the Electrochemical Performance of Li−Si/FeS2 Single Cells and the Functional Gradient Structure in Molten Electrolyte
In this contribution, influence of LiCl−KCl compositions on the electrochemical performance of Li−Si/FeS2 single cells should be noticed. Firstly, increased LiCl contents will increase Li+ concentration and electrical conductivity of the molten electrolyte (as listed in Table I), accelerating the Li+ transport rate. Secondly, increased surface tension of LiCl−KCl caused by increasing LiCl portion will increase the contact angles (as shown in Fig. 2), in other words, decrease the interface area between molten salt and FeS2. Thirdly, when a high discharge current is applied, the composition deviation of molten salt might lead to redistribution of Li+ and precipitation of molten salt, lowering its electrical conductivity and increasing the concentration polarization resistivity. The competition among the effects mentioned above, leads to the better electrochemical performance of HS2 than that of HS1 at 525 °C, while an inverse phenomenon is observed at 450 °C, as shown in Fig. 5.
Furthermore, for the single cells with the functional gradient structure, increased Li+ concentration might also be beneficial for the enhanced electrochemical performance. Therefore, it is necessary to identify the effect of the composition change and functional gradient structure. In this contribution, the electrochemical performances of HS2, HS3, and IHS3 are compared, as shown in Fig. 7. For IHS3, the average composition is 55.6 wt.% LiCl−44.4 wt.% KCl. At 450 °C, the energy density of IHS3 (182.3 Wh kg−1) is almost one half higher than that of HS2 (125.0 Wh kg−1) (Fig. 7a). The results are not consistent with the trend that increased LiCl contents lead to decreased energy density of single cells (Fig. 5), indicating that the suppression effect of the Li+-deficiency via the functional gradient structure in cathode is working. At 525 °C, the energy density of IHS3 (338.8 Wh kg−1) is between that of HS2 (342.2 Wh kg−1) and HS3 (280.8 Wh kg−1), suggesting that the effect of increased Li+ concentration through the functional structure is dominated.
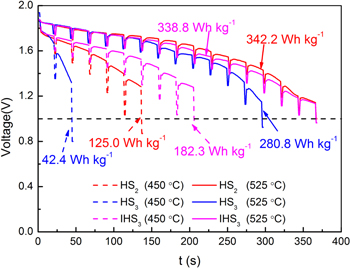
Figure 7. Comparison of the discharge curves and energy density of HS2, HS3 and IHS3 at 450 and 525 °C.
Download figure:
Standard image High-resolution imageThe role of functional gradient structure plays on the electrochemical performance of Li−Si/FeS2 single cells is discussed to further understand its working mechanism. For the melt molten salt with composition gradient, ions will diffuse and become homogeneous, such as previously reported NaNO3−AgNO3 and KNO3−AgNO3 systems. 24,25 Similar diffuse behavior can be predicted in the single cells with the functional gradient structure, when the temperature is in the range of 450 and 525 °C, as illustrated in Fig. 8. At the initial stage (t = 0), there is a composition gap between EB and cathode for the relative ratio of Li+/K+ (denoted as LK), as shown in Fig. 8a. During the discharge process, Li+/K+ diffuses from high concentration to low concentration, together with generation/consumption reactions of Li+ in electrodes, leading to the disappear of LK gap (t = t1, Fig. 8b). At a certain time (t = t2), a homogeneous distribution of ions is formed across the single cells (Fig. 8c). When t = t3, a Li+ concentration gradient forms, as illustrated in Fig. 8d.
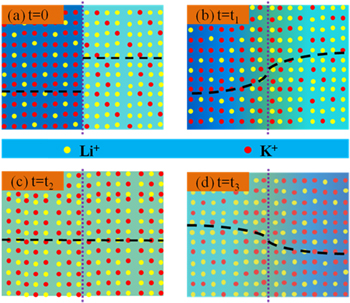
Figure 8. Illustration of the evolution of the molten salt composition during the discharge process, for single cells with the functional gradient structure (left and right sides of the dotted lines represents the relative ratio of Li+ and K+ in EB and cathode, respectively): (a) t = 0; (b) t = t1; (c) t = t2; (d) t = t3 (t3 > t2 > t1 > 0).
Download figure:
Standard image High-resolution imageMoreover, specimens composed of EB1/EB1 and EB1/EB3, labeled as OS1 and OS2, respectively, are used to further characterize the ions diffusion process in the simplified porous structure. Figure 9 shows the variety of the open circuit voltage (OCV) of OS1 and OS2 at 450 and 525 °C. The measured OCV originates from ions concentration gradient, which reflects the ions distribution across the specimens. As a reference, the OCV of OS1 reaches a steady value around zero in a short time (∼50 s), after forming stable interfaces between OS1 and Mo electrodes. For OS2, the absolute value of the measured voltage decreases with increasing time, indicating that the ions concentration gradient is diminishing. At 450 and 525 °C, it takes ∼1000 and ∼270 s, respectively, for the OCV of OS2 to reaches a relative constant value around zero. The relative constant value reflecting the uniform distribution of molten salt, which is also confirmed by the elements (K+/Cl−) mapping results of OS2 after being held at 450 °C (Fig. 10). For the initial stage of OS2, an obvious K+ concentration difference is observed between EB1 and EB3 (Fig. 10a), while it vanishes after the high temperature treatment for 1000 s (Fig. 10c). In contrast, the distribution of Cl− ions across the specimen is quite uniform, no matter before and after the heating treatment, as shown in Figs. 10b and 10d.

Figure 9. Variety of OCV of OS1 and OS2 with time at 450 and 525 °C.
Download figure:
Standard image High-resolution image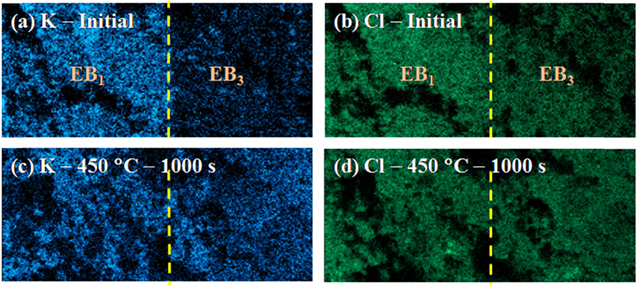
Figure 10. Elements mapping result of OS2: (a) K-Initial (t = 0); (b) Cl-Initial (t = 0); (c) K-450 °C-1000 s (t = 1000 s); (d) Cl-450 °C-1000 s (t = 1000 s).
Download figure:
Standard image High-resolution image
Though the ions redistribution process in OS2 is different from that in the single cells, as the electrical potential fields and components are not the same, it still can provide useful information to clarify the work mechanism of the functional gradient structure on the electrochemical performance of Li−Si/FeS2 single cells. In this contribution, at 525 °C, the total time (ttotal, ∼320 s) for heat treatment before OCV test and ions redistribution in OS2 is almost the same with that of the preparing time (300 s) before the discharge performance test for IHS3. In contrast, at 450 °C, the ttotal (∼1050 s) in OS2 is much longer than ∼1000 s that used for IHS3. That means at 525 °C, if the difference between the ions redistribution process in OS2 and IHS3 is not considered, the functional gradient structure is almost disappeared and the ions becomes homogeneous in molten salt before the discharge performance test. That is the reason for the enhancement of the electrochemical performance of single cells with the functional gradient structure. Consequently, the suppression effect of Li+-deficiency cathode formation works well at 450 °C, while the effect of increased Li+ concentration dominates at 525 °C. Usually, in real thermal batteries, the activation time for thermal batteries to achieve their working temperature is within 10 s (1), much shorter than the time for the ions redistribution in the single cells with the functional gradient structure. Nevertheless, the suppression effect of Li+-deficiency cathode formation via the functional gradient design can still work at high temperature.
Above all, the functional gradient structure developed in this contribution can improve the electrochemical performance of Li−Si/FeS2 single cells with homogenous structure, and the improvement effect depends on the temperature and composition gradient. Additionally, similar strategy as using the Li+-deficiency molten salt to construct the functional gradient structure, can also be adopted to prevent the LiCl precipitation and decrease the concentration polarization resistances in anodes, when big discharge current is applied, but it will lower the electrical conductivity of the electrolytes, which might exhibit adverse effect on the electrochemical performance of thermal batteries. The main disadvantages of using the Li+-rich molten salt in cathode is to lever the liquid point of the electrolyte, which is not benefit for the thermal batteries with very low working temperature. Combined with the design of Li+-deficiency anode, the shortcomings of Li+-rich cathode could be overcome. Moreover, it should be noticed that the functional gradient structure should be designed carefully, as the Li+-rich LiCl−KCl molten salt might exhibit adverse effect on the electrochemical performance of single cells.
Conclusions
In summary, we designed a functional gradient structure and using a Li+-rich molten salt to lever the Li+ concentration in FeS2 cathode to enhance the energy density of Li−Si/LiCl−KCl/FeS2 thermal batteries., Moreover, the functional gradient structure guarantees the high performance of the thermal batteries by preventing the generation of high concentration polarization resistivity and molten salt precipitation. The highest increase percentage of the energy density in single cells of Li−Si/LiCl−KCl/FeS2 reached 39.1% and 25.6% at 450 and 525 °C, respectively, at a discharge current of 500 mA cm−2. Based on systematically study of temperature, composition and functional gradient design, we concluded that the efficiency enhancement is result of the increased Li+ concentration and/or suppression effect of Li+-deficiency cathode. With high efficiency and easy operation, the functional gradient structure is potential/readily for the practical application of thermal batteries.
Acknowledgments
This work is financially supported by NSAF (Grant No. U1930208), National Natural Science Foundation of China (Grant No. 21703215); Science and Technology Innovation foundation of Institute of Electronic Engineering (S201904).
Appendix
Table A·I. Simplified labels and corresponding compositions.
| Serial Number | Simplified Labels | Compositions | Serial Number | Simplified Labels | Compositions |
|---|---|---|---|---|---|
| 1 | E1 | 45 wt.% LiCl − 55 wt.%KCl | 9 | C3 | 78 wt.% FeS2 − 22 wt.% E3 |
| 2 | E2 | 50 wt.% LiCl − 50 wt.% KCl | 10 | HS1 | Li−Si/EB1/C1 |
| 3 | E3 | 70 wt.% LiCl − 30wt.% KCl | 11 | HS2 | Li−Si/EB2/C2 |
| 4 | EB1 | 60 wt.% MgO − 40 wt.% E1 | 12 | HS3 | Li−Si/EB3/C3 |
| 5 | EB2 | 60 wt.% MgO − 40 wt.% E2 | 13 | IHS2 | Li−Si/EB1/C2 |
| 6 | EB3 | 60 wt.% MgO − 40 wt.% E3 | 14 | IHS3 | Li−Si/EB1/C3 |
| 7 | C1 | 78 wt.% FeS2 − 22 wt.% E1 | 15 | OS1 | EB1/EB1 |
| 8 | C2 | 78 wt.% FeS2 − 22 wt.% E2 | 16 | OS2 | EB1/EB3 |