
Abstract
Ni-rich lithium transition metal oxides have high specific capacity but generally have inferior cycling performance compared to their lower Ni content counterparts. core–shell structures with a Ni-rich core and a Mn-containing shell have been reported to improve the cycling performance of Ni-rich materials, but the impact of the shell on the performance of core–shell materials needs to be elaborated more. In this work, three core–shell precursors having a Ni(OH)2 core, but different shell compositions and thicknesses, were lithiated at various temperatures and the resulting materials were examined physically and electrochemically. They were compared to the corresponding uniform "shell" materials lithiated at the same temperatures. The selection of heating temperature is crucial and must be made with care to limit the interdiffusion between core and shell compositions while still heating to sufficient temperature to prepare crystalline materials with little lithium in the transition metal layer. Once these factors are understood, core–shell structures with an optimized shell thickness and Mn content can be made to simultaneously achieve high specific capacity and long cycle life.
Export citation and abstract BibTeX RIS

This is an open access article distributed under the terms of the Creative Commons Attribution 4.0 License (CC BY, http://creativecommons.org/licenses/by/4.0/), which permits unrestricted reuse of the work in any medium, provided the original work is properly cited.
The ever-increasing demand for higher energy density lithium-ion batteries drives the development of layered Ni-rich positive electrode materials. LiNi0.8Mn0.1Co0.1O2 (NMC811) and LiNi0.88Co0.09Al0.03O2 have been successfully implemented in current commercial lithium-ion batteries, yet the road to even higher Ni content still continues. It has been shown by many reports that the improved specific capacity of materials with increased Ni content is compromised by decreased capacity retention during charge-discharge cycling compared to lower Ni-content materials. 1,2 This trade-off substantially limits the application of Ni-rich materials. One method to mitigate this problem involves material surface modifications, such as coating an inactive but protective surface layer to improve the charge-discharge cycling performance of Ni-rich materials. 3–5 However, it is not clear that inactive material coatings are the best approach and alternatives need to be explored. For example, core–shell and gradient materials have been developed and showed great promises. 6–13
In a core–shell material, the Ni-rich high-capacity core, is protected by a lower capacity, but more stable shell which contacts the electrolyte. Recently, Y. Liu et al. 14 demonstrated a very promising Co-free Ni-rich core–shell material with specific capacity around 220 mAh g−1 that has a capacity retention and rate capability comparable to commercial-grade NMC811. Though not a completely new concept, the core–shell structure with a Ni-rich core and a Mn-containing shell was shown to mitigate the poor cycling performance of Ni-rich materials. The Co-free core–shell material reported by Y. Liu et al. 14 can be readily synthesized using common co-precipitation methods, without significant modification, in existing manufacturing processes.
This work is a continuation of the work by Y. Liu et al. 14 focusing on the effects of heating temperature, shell composition and shell thickness on the physical properties, specific capacity and charge-discharge cycling performance of core–shell materials. We demonstrate factors that must be carefully considered to make core–shell materials with both high specific capacity and excellent cycling performance.
Experimental
Materials preparation
Three core–shell precursors and two uniform "shell" precursors were provided by Zoomwe (Hunan Zoomwe Zhengyuan Advanced Material Trade Company, Ltd., Changsha 410000, China). The core–shell precursors are:
- 1.17 μm diameter Ni(OH)2 core and 0.5 μm thickness Ni0.5Mn0.5(OH)2 shell
- 2.16 μm diameter Ni(OH)2 core and 1 μm thickness Ni0.8Mn0.2(OH)2 shell
- 3.17 μm diameter Ni(OH)2 core and 0.5 μm thickness Ni0.8Mn0.2(OH)2 shell
Core–shell precursors #1–3 have an average Ni content of ca. 92 mol%, 94 mol% and 97 mol%, respectively, tested by Zoomwe. The two uniform "shell" precursors both with 16 μm size are Ni0.8Mn0.2(OH)2 and Ni0.5Mn0.5(OH)2. The as-received precursors were mixed with Li(OH)2·H2O (FMC Corporation) powder by a mortar and pestle until it was homogenous. The mixed powder had a lithium to transition metal molar ratio of 1.02. The lithiation process was started by initially heating the mixed powder in oxygen in a tube furnace at 480 °C for 3 h with ramping rate of 10 °C min−1. This step allows the Li(OH)2·H2O to melt and react initially with the precursors. The preheated powder was then taken out of the furnace and ground to eliminate areas of local lithium excess. The ground powder was heated again in oxygen at 650 °C, 700 °C, 750 °C or 800 °C for 20 h with the same ramping rate. The tube furnace was allowed to cool down naturally and the collected samples were ground again and stored in an argon-filled glove-box for further use. For ease of discussion, the lithiated materials were given names based on their corresponding precursors, for example, CS92-5050-17/0.5, or the CS92 series for brevity, is the lithiated material made from a core–shell precursor #1 that has an average Ni content of 92 mol%, a Ni50Mn50(OH)2 shell, a 17 μm diameter core and a 0.5 μm thickness shell. Results for the CS94 series lithiated at 750 °C and 800 °C were reported and compared to commercial NMC811 in Ref. 14.
Powder X-ray diffraction (XRD)
Powder XRD was conducted using a Bruker D8 diffractometer equipped with a Cu target X-ray tube and a diffracted beam monochromator. Samples were measured in a scattering angle (2Ɵ) range from 15° to 90° for a dwell time of 3 s at intervals of 0.02° with a 1° divergence slit, a 1° antiscattering slit and a 0.2 mm receiving slit. Rietveld refinement was conducted using Rietica Software. 15
The refinements assumed the R  m space group (#166) with Li in 3a sites, Ni (and Mn) in 3b sites and oxygen in 6c sites. Neutral atom scattering factors were used. Two models for the structure were considered. In the first, a lithium deficient structure, [Li1-xNix]3aNi3bO2 was assumed in which Ni atoms filled the vacancies in the Li layer. In the second, cation exchange was assumed as [Li1-xNix]3a[Ni1-xLix]3bO2. It is expected that the former is more likely when the Mn content is low and the latter is more likely when the Mn content is high. In any event, both models give virtually the same result for the fraction of Ni in the Li layer (NiLi) in the 3a sites. Table I gives results for core–shell precursor #3 lithiated at 800 °C. Table I shows that the refined value for the fraction of NiLi differs by only 0.001 between the two models. Model 2 was used for the results plotted in Fig. 3.
Table I. Rietveld refinement results for core–shell precursor #3 lithiated at 800 °C.
| Fitted parameters | Model 1—[Li1-xNix]3aNi3bO2 | Model 2—[Li1-xNix]3a[Ni1-xLix]3bO2 |
|---|---|---|
| Lattice constant, a (Å) | 2.8768 | 2.8768 |
| Lattice constant, c (Å) | 14.2003 | 14.2003 |
| Oxygen position, z | 0.2419 | 0.2420 |
| Fraction of NiLi in 3a Li site, x | 0.0212 | 0.0203 |
Scanning electron microscopy (SEM) and cross-sectional energy-dispersive X-ray spectroscopy (EDS)
SEM images and EDS mapping/line scans were measured using a Hitachi S-4700 cold field emission SEM with an integrated Oxford Inca EDS system. The SEM images for examining the particle morphology were obtained using an accelerating voltage of 5 kV and a current of 15 μA. For cross-sectional SEM imaging and EDS, fresh electrodes were first ion-milled with a JEOL IB-19530CP cross-section polisher. Fresh electrodes were milled with an Ar-ion beam for 50 min using a 6 kV coarse step followed by a 5 min 4 kV fine step. Cross-sectional SEM images and EDS mappings/line scans were taken on the as-milled electrodes with an accelerating voltage of 15 kV and a current of 15 μA. The EDS mapping was carried out for ca. 7 min until a satisfactory image was obtained. An extra 3 min of data collection was obtained for the 800 °C samples in an effort to observe the core–shell structure.
Coin cell building and cycling
Electrodes for cycling were prepared by mixing 92 wt% of the as-synthesized core–shell material, 4 wt% of Kynar polyvinylidene fluoride binder and 4 wt% of Super S carbon black in N-methyl-2-pyrrolidone in a planetary mixer. The mixture was coated on Al foil with a 150 μm notch bar spreader. The resulting electrode was dried in a convection oven at 110 °C, then calendered. The electrode was further punched into small circular electrodes with a diameter of 12 mm for coin cell building. The electrode loading was ca. 10 mg cm−2.
The electrolyte for coin cell half-cell cycling was 1.2 M LiPF6 in FEC/DMC (1:4 v/v). Standard 2325 coin cells were assembled in an argon-filled glovebox. Each coin cell has one positive electrode and one Li foil negative electrode with two pieces of Celgard 2300 separator. Galvanostatic charge/discharge cycling was conducted with E-one Moli Energy Canada battery testing systems at 30 °C. Coin cells were cycled from 3 to 4.3 V vs Li/Li+ with 2 initial C/20 cycles and then continued cycling with C/5 for 100 cycles. Two C/20 cycles were run after the 50th C/5 cycles and another 2 C/20 cycles after the 100th C/5 cycles. The 1st C/20 cycle was taken as 100% capacity.
Results and Discussion
Figure 1a shows SEM images of three core–shell precursors along with cross-sectional SEM images and Mn EDS mappings shown in the insets. All three precursors were synthesized by the co-precipitation method. The EDS mappings confirm the presence of Mn-rich shells as desired. The three precursors all have an identical D50 diameter of 18 μm but have varying core sizes, shell thicknesses and compositions as noted in the Experimental section. Figure 1b shows the XRD patterns of the core–shell precursors in comparison to the "core" Ni(OH)2 which is also commercial-grade. The XRD pattern of core–shell precursor #2 clearly shows Bragg peaks from both the core and shell phases while the peaks from the shell phase in #1 and #3 are less intense due to the limited amount of the shell phase. In the case of #1, due to the similarity of lattice constants between the Ni(OH)2 core phase and Ni0.5Mn0.5(OH)2 shell phase as shown by Zhou et al. 16 , the Bragg peak separation from these two phases is even harder to observe than core–shell precursor #3. XRD patterns of the two commercial-grade uniform "shell" precursors, Ni0.8Mn0.2(OH)2 and Ni0.5Mn0.5(OH)2, are shown in Fig. S1 (available online at stacks.iop.org/JES/167/160556/mmedia). The Ni0.5Mn0.5(OH)2 XRD pattern shows the presence of oxyhydroxide phase. Figures 1c and 1d show SEM images of the uniform "shell" precursors Ni0.8Mn0.2(OH)2 and Ni0.5Mn0.5(OH)2, respectively. The Ni0.5Mn0.5(OH)2 particles show a very rough surface morphology compared to Ni0.8Mn0.2(OH)2, presumably a result of much higher Mn content.
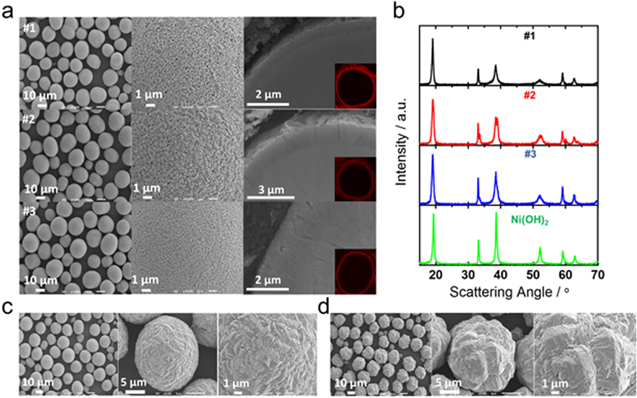
Figure 1. (a) SEM images of three core–shell precursors #1 to #3 from top to bottom. Inset images are cross-sectional Mn EDS mapping. (b) XRD patterns of the core–shell precursors and nickel hydroxide. XRD patterns of the uniform "shell" precursors Ni0.8Mn0.2(OH)2 and Ni0.5Mn0.5(OH)2 are shown in Figs. S1c and S1d SEM images of the uniform "shell" precursors Ni0.8Mn0.2(OH)2 and Ni0.5Mn0.5(OH)2, respectively.
Download figure:
Standard image High-resolution imageFigure 2a shows SEM images of all three core–shell precursors after heating with LiOH·H2O at 800 °C or 750 °C for 20 h. The SEM images indicate the spherical morphology of the precursor materials was maintained after heating with LiOH·H2O. The SEM images of the materials heated at 700 °C and 650 °C are shown in Fig. S2 where spherical morphology can also be seen for these materials. Figure S3 shows the morphologies of the lithiated "shell" precursors. All these images indicate no significant alteration of morphologies compared to their precursors.
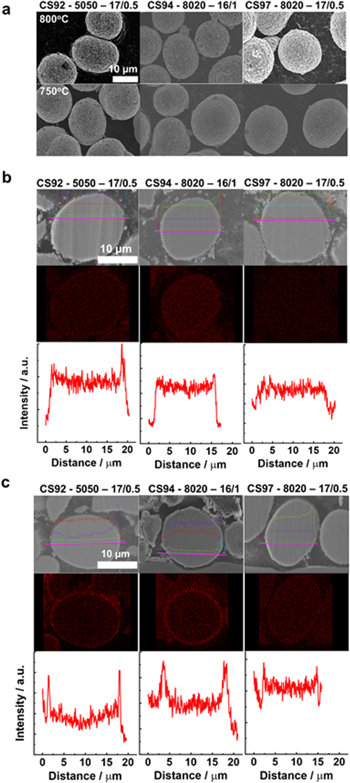
Figure 2. (a) SEM images of lithiated materials at 800 °C and 750 °C. SEM images of lithiated materials at 700 °C and 650 °C are shown in Fig. S2. SEM images of lithiated "shell" materials are shown in Figs. S3b and S3c Cross-sectional SEM images, Mn EDS mapping and line scans of materials lithiated at 800 °C and 750 °C, respectively. Cross-sectional SEM images, Mn EDS mapping and line scans of materials lithiated at 700 °C and 650 °C shown in Fig. S4.
Download figure:
Standard image High-resolution imageFigures 2b and 2c show the cross-sectional SEM images, Mn EDS mappings and line scans of materials heated at 800 °C and 750 °C, respectively. The Mn line scans indicate the core–shell structure is maintained to some extent for CS92 at 800 °C whereas, at the same temperature, CS94 and CS97 demonstrate a rather uniform Mn distribution, suggesting interdiffusion occurs at this temperature. Comparing CS92 (50% Mn in shell) to CS97 (20% Mn in shell), which have identical precursor shell thickness, a more Mn-rich shell is advantageous to maintain a core–shell structure at a higher heating temperature. At 750 °C, the Mn EDS mapping and line scans for all three materials show much more prominent core–shell structure than those at 800 °C, indicative of a lesser degree of interdiffusion. Figure S4 shows well-defined core–shell structures at 700 °C and 650 °C for all three CS series.
Figure 3 shows the average lattice constants and percentage of Ni in Li layer (NiLi) from the Rietveld-refined XRD patterns as a function of lithiation temperature for all the materials made from core–shell precursors #1–3. lattice constants and NiLi of the corresponding "shell" materials, LiNi0.5Mn0.5O2 and LiNi0.8Mn0.2O2, denoted as NiMn5050 and NiMn8020 respectively, and LiNiO2 taken from Ref. 2 are also included for comparison. All the refined XRD patterns can be found in Fig. S5. The XRD patterns from 20 to 35° scattering angle are free of any observable impurity peaks. An increased (108)/(110) Bragg peak splitting (near a scattering angle of 65°) at higher temperature indicates increased material crystallinity. However, for NiMn5050, its crystallinity does not seem to improve significantly at least up to 800 °C.

Figure 3. Rietveld-refined average lattice constants and average percentage of Ni in the Li layer, NiLi, as a function of lithiation temperature. NiMn5050 and NiMn8020 denote LiNi0.5Mn0.5O2 and LiNi0.8Mn0.2O2, respectively. Rietveld-refined XRD patterns of each sample are shown in Fig. S5. lattice constants and NiLi for LiNiO2 synthesized at 700 °C were taken from Ref. 2.
Download figure:
Standard image High-resolution imageThe lattice constants and the percentage of NiLi of the CS92, 94 and 97 series all follow the same trends. Their lattice constant, a, varies little with heating temperature while the lattice constant, c, increases with heating temperature. Higher heating temperature decreases the average NiLi degree for the CS92, 94 and 97 series samples. If one assumes that Mn in the layered structure has an oxidation state of +4, Ni has to be partially reduced to Ni2+ from Ni3+ in order to maintain the average transition metal oxidation state of +3 in the layered structure. As a result, NiLi occurs due to the similar ionic radii of Ni2+(0.69 Å) and Li+(0.73 Å). 17 Therefore the CS97 series with only 3% Mn is expected to have the lowest average NiLi of all the CS series (a well-synthesized LiNiO2 has a NiLi about 1%) which is exactly what is observed in Fig. 3. Similarly, one expects NiMn5050 to have the highest percentage of NiLi followed by NiMn8020, which is consistent with Fig. 3. Unlike any of the CS series and NiMn8020, heating up to 800 °C does not lower the NiLi in NiMn5050 as a result of high Mn content. Both NiMn5050 and NiMn8020 show larger lattice constants than any of the CS series. High percentage of NiLi, and vice versa, allows more Li+, which is larger than Ni3+(0.7 Å) to reside in the metal oxide slabs resulting in an increased lattice constant.
Figure 4 shows the voltage vs capacity (V-Q) curve of each material as a function of lithiation temperature. Specific capacity information is tabulated in Tables SI to SIII for the CS92, CS94 and CS97 series, respectively. At each temperature, the specific capacity increases from CS92 to CS97 as the Ni content increases. Within each CS series, the specific capacity sequentially increases from 650 °C to 800 °C while the voltage polarization becomes smaller, especially near the top of charge. The refinement results in Fig. 3 show that the percentage of NiLi decreases from 650 °C to 800 °C. Less NiLi reduces voltage polarization at the top of charge as previously shown. 14,18,19 The dashed red rectangular regions in Fig. 4 enclose the two CS materials that became approximately uniform after heating as Mn interdiffusion occurred substantially at 800 °C according to Fig. 2. The V-Q curve of the CS97 series at 800 °C resembles that of pure LixNiO2 which undergoes several phase transitions, believed to be detrimental for cycling, as x varies. 20–23 Irreversible capacity, in general, decreases as temperature gets higher. The irreversible capacity was reported to be related to slow diffusion of lithium due to the small number of di-vacancy sites in the lithium layer at high lithium content near the bottom of discharge. 24

Figure 4. Voltage vs capacity curve of each material as a function of lithiation temperature. Enclosed graphs (red dashed rectangle) are approximately uniform materials due to interdiffusion which occurred at high lithiation temperature. Tabulated specific and irreversible capacities are shown in Tables SI to SV.
Download figure:
Standard image High-resolution imageSpecific capacity information for the uniform "shell" materials is tabulated in Tables SIV and SV. The specific capacity of NiMn8020 increases with temperature. Both the specific capacity and voltage polarization of NiMn8020 are much weaker functions of temperature compared to any of the CS series. The specific capacity of NiMn5050 is essentially unchanged from 650 °C to 800 °C and the voltage polarization remains high. This correlates to the XRD refinement results that show percentage of NiLi remains almost constant as the heating temperature increases. The V-Q plots of "shell" materials suggest that, for any CS series, the increase of specific capacity and reduced voltage polarization as a function of temperature is primarily due to the Ni-rich core.
Figure 5 relates the irreversible specific capacity (IRC) to the percentage of NiLi. The solid arrow and the dashed arrow point to the direction of increasing heating temperature for core–shell and "shell" materials, respectively. For the core–shell materials, the irreversible capacity is a strong function of NiLi as a small increase of NiLi such as 2% can lead to a significant rise in IRC. On the other hand, the IRC of the "shell" materials heated from 650 °C to 800 °C is almost unchanged with respect to NiLi. Therefore the Ni-rich cores of core–shell materials are most likely to be responsible for their strong dependency of IRC on NiLi. Both of the "shell" materials may require a heating temperature much higher than 800 °C to further lower their IRC under the synthesis condition in this study. LiNiO2 synthesized at 700 °C was reported to have an IRC of ca. 25 mAh g−1 when charged to 4.3 V vs Li/Li+ at 30 °C. 2
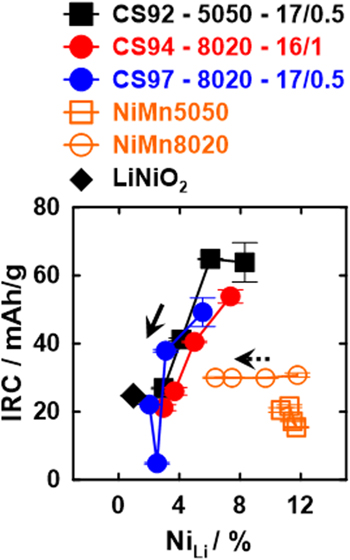
Figure 5. Irreversible specific capacity vs percentage of Ni in Li layer, NiLi. Each IRC data point is the average of two coin-cells. The solid and dashed arrow point to the direction of increasing heating temperature of core–shell materials and the "shell" materials, respectively. IRC and NiLi of LiNiO2 synthesized at 700 °C were taken from Ref. 2.
Download figure:
Standard image High-resolution imageFigure 6a shows the charge-discharge cycling performance for the CS92, 94 and 97 series lithiated at different temperatures. The best performance of the CS92 and 94 series was achieved at the highest temperature with the core–shell structure still maintained. The best performing samples are CS92 at 800 °C and CS94 at 750 °C. However, for the CS97 series, the best performance was at 700 °C not at 750 °C which suggest the importance of having a sufficiently thick shell and/or Mn content in the shell after heating. The CS94 and CS97 series samples at 800 °C both had severely diminished shells due to interdiffusion and show poor cycling performance which are in sharp contrast to their counterparts heated at 750 °C. This illustrates the importance of a Mn-rich protective "shell" to achieve long cycle life of the Ni-rich core. CS97 series at 800 °C has the worst charge/discharge cycling performance of all the CS series samples as expected since it is basically equivalent to uniformly 3% Mn doped material, LiNi0.97Mn0.03O2. Heating to higher temperature enhances the rate capability of all CS series, which can be observed as the decreasing specific capacity difference between the C/20 and the C/5 cycles. This correlates with the decrease in the percentage of NiLi that occurs with higher heating temperature.
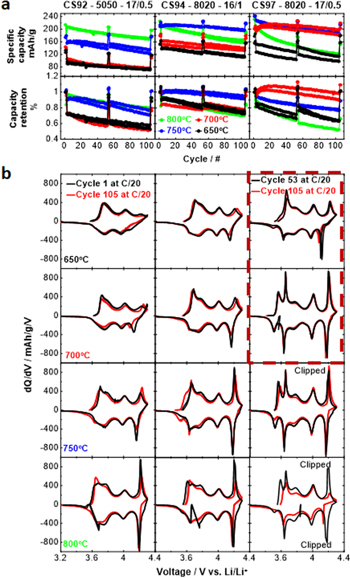
Figure 6. (a) Specific capacity and capacity retention vs cycle number as a function of lithiation temperature. (b) Evolution of C/20 differential capacity before and after cycling. Enclosed region (dashed red rectangle) compares the 53rd cycle at C/20 (instead of cycle 1) to the 105th cycle at C/20 as specific capacity initially increased with cycles.
Download figure:
Standard image High-resolution imageFigure 6b examines the charge-discharge cycling stability of each CS series by comparing the C/20 dQ/dV vs V profiles before and after cycling. The dQ/dV profile of an excellent material should be unchanged after cycling. In general, dQ/dV features (peaks) become increasingly prominent as a function of the lithiation temperature, especially the peaks at ca. 4.2 V are remnants of the H2 to H3 phase transition of LiNiO2. 20 In this region, the unit cell volume changes dramatically and it is believed this can cause particle cracking for polycrystalline materials. 25–27 Of all the samples, the CS94 sample lithiated at 750 °C and the CS97 sample lithiated at 700 °C show the most stable dQ/dV peaks during cycling and these samples also have the best capacity retention in Fig. 6a. The volume changes in a Mn-rich shell will be smaller than those in the core since the amount of lithium that can be extracted to 4.3 V becomes smaller as the Mn content increases, 18,28 such a shell apparently protects the core and stable cycling ensues.
Figure 7a compares the cycling performance of the uniform "shell" materials to their corresponding CS series. At 650 °C and 700 °C, every CS series has very close specific capacity and capacity retention to its corresponding uniform "shell" material, except for CS97 at 700 °C. This implies that the heat treatment temperature is too low for the core to attain a small amount of NiLi and to develop its expected capacity. For CS97 at 700 °C, it not only has a core–shell morphology as shown in Fig. S4 but also has a small average NiLi as shown in Fig. 3, which can be the reason of why its performance stands out among all materials at 650 °C and 700 °C. Comparing the cycling performance of LiNiO2 and CS97, taken from Ref. 2, the CS97 sample outperforms LiNiO2 in terms of capacity retention even with 2% larger NiLi which indicates the significance of having a Mn-containing shell. At 750 °C all the CS series show much improved performance compared to the corresponding uniform "shell" materials as the average percent of NiLi gets smaller in all of them. However, careful examination of Fig. 7a shows that CS97 has inferior capacity retention compared to CS94 which we believe is due to the near elimination of the shell in CS97 at 750 °C as shown in Fig. 2c, while CS94 has a clear Mn-rich shell. At 800 °C, all the CS94 and CS97 materials initially show higher specific capacity compared to the corresponding shell materials but their capacity retention is worse than the corresponding CS materials heated at 750 °C because the shell has been eliminated by interdiffusion at 800 °C (See Fig. 2b). By contrast, CS92 still retains some evidence of a shell after heating to 800 °C (See Fig. 2b) and Fig. 6a shows that its capacity retention is similar to that of CS92 heated at 750 °C while its specific capacity is much larger due to a decrease in the average percentage of NiLi.

Figure 7. (a) Cycling performance comparison of the "shell" materials to the corresponding CS series. Cycling data for LiNiO2 synthesized at 700 °C were digitized from Ref. 2. Cycling was performed under the same condition as this work. (b) Evolution of C/20 differential capacity before and after cycling of NiMn8020 and NiMn5050 at various lithiation temperatures.
Download figure:
Standard image High-resolution imageFigure 7b examines the electrochemical characteristics of the "shell" materials during charge-discharge cycling. The dQ/dV vs V profiles of NiMn8020 change systematically with temperature as the specific capacity increases. In particular, the peak in dQ/dV vs V at about 4.25 V sharpens as the temperature increases. Figure 3 shows that the percentage of NiLi is still decreasing between 750 °C and 800 °C suggesting an even higher heating temperature would be appropriate for NiMn8020 to simultaneously achieve higher specific capacity and lower NiLi. However, for a core–shell material, a higher temperature would lead to more rapid interdiffusion between core and shell and hence inferior performance. On the other hand, neither the specific capacity nor the dQ/dV profile of NiMn5050 varies with heating temperature between 650 °C and 800 °C which is consistent with the relatively invariant percentage of NiLi for this material with temperature in Fig. 3.
There are three factors which govern the behavior shown in Fig. 7. Firstly, the core material, nominally LiNiO2, needs to be heated to near 700 °C or 750 °C to attain a small amount of NiLi using the synthesis condition in this work. Percentages of NiLi in LiNiO2 as low as 1% have been also attained in oxygen at 700 °C by de Biasi et al. 21 and at 750 °C by Kobayashi et al. 22 If LiNiO2 is heated to higher than 750 °C, then lithium loss occurs 29,30 and lithium deficient materials with NiLi will likely result. If LiNiO2 is heated at temperatures lower than 700 °C, it is difficult for a perfect layered structure to form leading to cation mixing between Ni and Li and hence, resulting more Ni in the Li layer. Secondly, the shell materials which contain 20% or 50% Mn need to be heated to temperatures at least to 800 °C to attain optimum properties, which is evident in Fig. 7a by their steadily increasing specific capacities with temperature. Lastly, the interdiffusion between the Mn rich shell and the core proceeds at a significant rate beginning at 700 °C, therefore if a shell is too thin or contains too little Mn, it will not remain when the temperature is too high. It is clear from Figs. 2, 6 and 7 that a Mn-rich shell is desired for the best capacity retention.
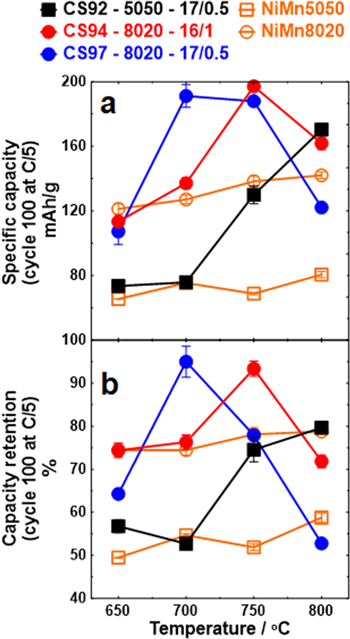
Figure 8 summaries the specific capacity and capacity retention at the 100th cycle of each material as a function of the lithiation temperature. To attain high specific capacity from the Ni-rich core, heating temperatures near 700 °C to 750 °C is necessary, but the highest specific capacity and capacity retention are attainable only with a core–shell structure. The CS94 and CS97 series show their best performance at 700 °C and 750 °C, respectively, and beyond these temperatures, their performance deteriorated as a result of a diminishing shell. In contrast, the performance of the CS92 series keeps increasing as a function of temperature most likely because of the very high Mn content originally in the shell. If heated far beyond the highest temperature studied in this work, it is likely the CS92 series would have worse capacity retention because the core–shell structure would not survive.
Figure 8. Specific capacity (a) and capacity retention (b) of all materials at cycle 100 as a function of lithiation temperature. Testing was performed at 30 °C between 3.0 and 4.3 V.
Download figure:
Standard image High-resolution image
Apparently, the optimal temperature is closely associated with the shell thickness and Mn content. Comparing the optimal temperature of the CS97 series to the CS94 series, both of which have identical shell composition, the CS97 series performs the best when heated at 700 °C, 50 °C lower than the best of the CS94 series when heated at 750 °C. This is due to Mn interdiffusion almost eliminating the thinner shell in CS97 when heating to 750 °C. In general, a thicker shell helps maintain the core–shell structure but with a trade-off as more Mn content in the material lowers the specific capacity. It is very likely that a core–shell material with optimized shell thickness and Mn content can perform even better than CS94 at 750 °C, the best performing material in this study.
Conclusions
Core–shell precursors with a Ni(OH)2 core and either a Ni0.8Mn0.2(OH)2 or Ni0.5Mn0.5(OH)2 shell were heated with LiOH·H2O at temperatures from 650 °C to 800 °C. The impact of shell composition and thickness on the structure and properties of the resulting materials was explored by cross-sectional EDS, XRD and charge/discharge cycling. Each CS series showed an increased specific capacity when heating to higher temperature. However, the shell completely disappeared when the temperature became too high due to Mn interdiffusion. When this occurs, the material simply becomes a uniformly doped Ni-rich material with poor cycling performance. The highest temperature a core–shell precursor can be heated while still maintaining a well-defined core–shell structure depends on the shell thickness and its Mn content. To attain both a high specific capacity and excellent cycle life for a core–shell material, optimized shell thickness, Mn content and heating temperature are necessary.
The best material created in this work started with a 16 μm diameter core of Ni(OH)2 covered by a 1 μm thick shell of Ni0.8Mn0.2(OH)2. This was heated with LiOH·H2O at 750 °C to make a layered core–shell material which was confirmed by EDS mapping and EDS line scans. After 100 charge discharge cycles, the specific capacity at C/5 was ca. 200 mAh g−1 and the capacity retention was about ca. 93%. The effect of the core–shell particle size will be emphasized in our future work.
Acknowledgments
The authors acknowledge the financial support of NSERC and Tesla Canada under the auspices of the Industrial Chairs program.