
Abstract
Redox flow batteries (RFBs) have been studied over the past several decades as a promising candidate for stationary energy storage applications. It is therefore important to understand the reliability of RFBs and the mechanisms that cause degradation with time. Contributions from individual electrodes are difficult to separate especially for long-term cycle testing due to the lack of a stable reference electrode. In our work, the reliability and degradation mechanisms of an all-vanadium RFB were investigated by a stable reference electrode based on the dynamic hydrogen electrode (DHE). The newly developed DHE reference electrode demonstrated high accuracy and long-term stability that enables in situ monitoring of individual electrode signals over hundreds of cycles in a vanadium RFB. This approach enables the full cell degradation to be separated into contributions from the cathode and anode. The cathode and anode were found to play quite different roles in the increase in overpotential of the vanadium RFB during long-term cycling. The anode reaction limited both the charge and discharge capacity over 100 cycles. The negative side also appeared to be the rate limiting factor throughout cycling as determined by EIS measurement. The cathode contributed to the performance degradation as cycling exceeded 50 cycles.
Export citation and abstract BibTeX RIS
The increasing necessity to develop high performance, low cost, and reliable electrochemical energy storage systems (ESS) is driven by the rapid growth of renewable energy needs, e.g. in smart grid integration applications. All-vanadium redox flow batteries (VRFBs) with two soluble redox couples (V4+/5+ and V3+/4+) contained in external electrolyte tanks are promising candidates for stationary energy storage because they provide some unique features. These features include separation of energy capacity and power output, high safety, long cycle life, and ease of manufacturing. 1,2 However, the VRFB typically suffers from complicated degradation mechanisms such as oxidation of carbon based electrodes (by electrolyte or high potential), 3,4 electrolyte crossover, 5,6 membrane degradation (mechanical and chemical), 7–10 electrolyte precipitation (as a function of temperature), 11 and from inactive components (bipolar plate, gasket, and current collector). 12,13 Understanding the reliability of RFBs and insight into the degradation mechanisms are therefore becoming critical for large scale applications. These efforts are severely lacking at present; the degradation mechanisms of VRFBs have typically been investigated in full cell mode by simply monitoring the cell voltage and current under varied operating conditions. The contributions from individual electrodes (cathode or anode) are hard to separate, especially for long-term cycling, due to the lack of a stable reference electrode (RE).
State-of-the-art RE approaches in RFBs are typically leveraged from those in fuel cells. 14,15 They can be classified into two kinds: internally or externally located in the cell. Ag/AgCl electrodes, inserted in the inlet and outlet tubing of the cell, have been reported as external REs for the determination of individual overpotentials in each half-cell of a vanadium RFB. 16 This design has potential chloride contamination and a large IR drop associated with a large distance between RE and electrode (cathode or anode). In alternative approaches, a Pt wire 17,18 or carbon cloth/fiber 19,20 based potential probe was applied internally into the cell (e.g. in the midst of the membrane). The potential probe was used to decouple the cathode and anode potential drop and impedance during operation. However, the potential continued to shift 21 during cycling and therefore deemed unstable for long term testing. A dynamic study of a VRFB based on a DHE placed internally between membranes was reported by the Zawodzinski group. 17,18,22–24 It was found that the DHE potential was dependent on the resistor used and contamination of the Pt wire can lead to unknown potential drift. 25 At present, a reliable and stable reference electrode for long-term testing of RFBs to study degradation mechanisms and long-term reliability and the ability to decouple the anode and cathode contributions is in great need.
In this work, the reliability and degradation mechanism of an all-vanadium redox flow battery was investigated by a stable reference electrode. A stable reference electrode based on the dynamic hydrogen electrode (DHE) was developed which demonstrates accuracy and long-term stability in the VRFB. This approach enables the in situ monitoring of individual electrode signals and the performance degradation contributions of cathode and anode to be decouple during long-term cycling.
Experimental
DHE setup
The detailed setup of the DHE followed a process reported in the literature 21,24 with some modifications. As illustrated in Fig. 1, two Pt wires with straight or curved shapes were inserted into membranes of a redox flow battery. The Pt wires were placed 5 mm apart from the edge of the electrodes in the VRFB to avoid interference by the electric field generated between the two electrodes. 21,25 These two Pt wires serve as the positive and negative electrodes connected to an external electric circuit with a battery (9 V) and a resistor. The negative electrode Pt wire which is directly connected to the negative terminal of the battery is employed as the DHE reference electrode in this study. The DHE reference electrode is where the hydrogen evolution reaction (HER) occurs and the current flowing through the cell is optimized using an adjustable resistor.

Figure 1. Schemes of (a) an all-vanadium redox flow battery with a DHE based reference electrode, and (b) detailed design of DHE in an RFB.
Download figure:
Standard image High-resolution imageThe two Pt wires (dia. 0.3 mm) were first soaked in a 5 wt.% Nafion solution (DE520, Ion Power). After drying, the Pt wires were sandwiched between laminated Nafion membranes using a hot-press at 130 °C for 10 min with a force of 1000–1200 lbs.
Cell fabrication with DHE
A VRFB single cell was assembled using an in-house design. 1 Each half-cell consisted of a stainless steel end plate, a current collector, a graphite bipolar plate, a gasket, a graphite felt electrode (GFD 4.6, SGL Carbon Group, 5 cm × 2 cm for active area), and a Nafion membrane (N212, Ion Power). The DHE was placed between both half cells. Prior to cell assembly, the graphite electrodes were thermally treated at 400 °C in air for 6 h to increase its hydrophilicity and the laminated Nafion N212 with two Pt wires were soaked in deionized water at room temperature for 24 h.
The original vanadium electrolytes were solutions of 1.7 M V (IV) in 4 M or 3.3 M sulfuric acid and 50 mM phosphoric acid. These were prepared by dissolving VOSO4·4.5H2O (97%, Sigma–Aldrich) in H2SO4 (96%, Sigma–Aldrich) and used as the positive electrolyte (catholyte). The V (III) electrolyte, prepared by electrochemically discharging from the original V (IV) electrolyte, was used as the negative electrolyte (anolyte). The electrolytes were pumped from the electrolyte reservoirs (Pyrex graduated cylinders) to the flow cell compartments by using a peristaltic pump (Cole-Parmer, Masterflex L/S 7551) at a flow rate of 20 ml min−1 through Viton tubing. The reservoirs were bubbled with nitrogen for 10 min and sealed before testing.
Electrochemical testing and electrochemical impedance spectroscopy measurement
The assembled flow cell was cycled in a charge-discharge process at room temperature with a voltage window between 1.63–0.5 V at a constant current of 50 mA cm−2 using a Gamry Reference 3000 potentiostat/galvanostat/ZRA (Gamry Instruments, Warminster, PA). The electrochemical impedance spectroscopy (EIS) of the full cell (positive to negative current collector) and the half-cells (positive or negative current collector to DHE) were recorded at the end of charging or discharging using the Gamry instrument with a frequency range of 0.1 Hz to 100 kHz and a perturbation voltage of 10 mV. After measurements, the EIS curves were analyzed using the Zview program (Scribner).
Results and Discussion
The results and discussion section are divided into two sections, the first section investigates the development of a stable reference electrode to decouple the cathode and anode throughout long-term cycling. The second section examines the development of a reference electrode that enables the in situ monitoring of individual electrode signals (such as potential and impedance). The ultimate goal is to develop a stable reference electrode that can be used for in situ monitoring of electrodes and understanding the reliability and degradation mechanisms of VRFBs.
A stable DHE reference electrode development
In this work, a dynamic hydrogen electrode (DHE) was investigated because it is widely used in fuel cells as well as RFBs. 14,15 More specifically, it has recently been used for a dynamic study of vanadium RFBs. 17,18,22–24 Until now, the DHE has not been reported on studies involving long-term cycling of batteries due to stability issues. It has been found that the potential of the DHE drifts over cycling potentially due to Pt wire contamination. 21 The present study will investigate the factors responsible for increasing accuracy and stability of the DHE in vanadium RFBs and implement findings to decouple electrode reactions during long term cycling.
Resistor effect on DHE
It has been reported that the key parameter to stabilize the hydrogen evolution reaction at the DHE 21 is the adjustment of the current flow through the cell. Experiments started with adjusting the resistor in the circuit to tune the current flowing through the DHE. Figure 2 shows the charge-discharge curves of a full cell and its individual electrodes (cathode or anode vs DHE) with resistors of 3.3 and 1.0 MΩ. The selection of the resistors was aimed at approaching the optimal current (approximately 6 μA or less as reported 21,25 ) through the Pt electrode of the DHE. As an example, a 9 V battery with 3.3 or 1 MΩ resistors should lead to a current of 2–9 μA assuming the contact resistance is insignificant.
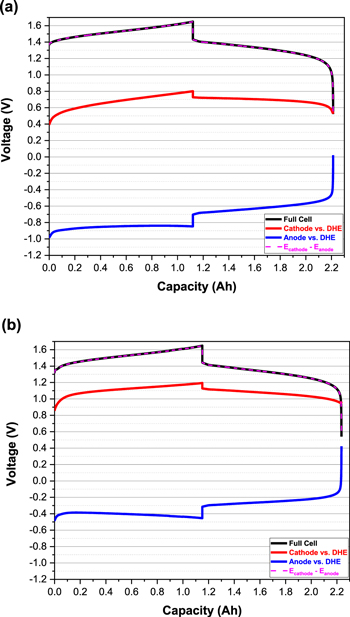
Figure 2. Charge-discharge profiles of full cell and its single electrode (cathode or anode vs DHE) for an all-vanadium RFB by using straight Pt wires based DHE with the resistor of (a) 3.3 MΩ and (b) 1.0 MΩ.
Download figure:
Standard image High-resolution imageThe accuracy of the DHE for both resistor-based systems (Figs. 2a and 2b) is validated since the potential difference between the cathode (vs DHE) and anode (vs DHE) is the same as the measured full cell potential (cathode vs anode). 21 In addition, when the resistance was decreased from 3.3 MΩ to 1.0 MΩ, the cathode or anode voltage (vs DHE) was increased by ca. 0.4 V that reflects the decrease of the DHE voltage by ca. 0.4 V. Therefore, the reported resistor effect on the reference DHE is validated in our experiment. Considering the cathode reaction (VO2 + + 2H+ + e− ↔ VO2+ +H2O) of a vanadium redox flow battery (VRFB) with an equilibrium potential E° of 1.00 V vs NHE, the cathode voltage profile between 1–1.2 V vs DHE in Fig. 2b indicates the DHE potential approaches 0 V when using a 1.0 MΩ resistor. Similar cathode discharge potential has been reported by Choi in their DHE design. 21 The difference in Pt wire potential using the two resistors indicates the reactions occurring at the Pt wires are different. With 3.3 MΩ, the current passing through the Pt wire is relatively small and the vanadium redox reaction plays a dominant role which makes the Pt wire potential increase by 0.4 V. For the 1.0 MΩ case, the current passing through the Pt wire is much higher and the vanadium present at the vicinity of Pt wire might be consumed faster than normal. The hydrogen evolution reaction (HER) dominates the Pt wire potential which leads to a stable and reliable DHE reference electrode.
Pt electrode shape (area) effect on DHE
The design of the DHE was further investigated to improve the stability by examining the shape of the Pt wire. A curved Pt wire electrode was used to replace the straight Pt wire inserted into membranes as illustrated in Fig. 1b. The curved Pt wire was utilized to maximize the contact area between the Pt wire and the membrane and to further improve the stability of the DHE. As discussed earlier, the straight Pt wires in conjunction with a 1.0 MΩ resistor for the DHE has demonstrated a stable system in the initial DHE setup, (Fig. 2b). As shown in Fig. 3a, the voltage profile of the cathode or anode (vs DHE) continues to shift during cycling of the cell when a curved Pt wire with a 1.0 MΩ resistor is used. The initial discharge voltage of the cathode increases gradually from 0.88 V to 1.15 V vs DHE in the first four cycles which indicates that the voltage of DHE decreases continually and approaches 0 V where the hydrogen evolution reaction happens. Since the DHE (Pt wire) was inserted into the membranes, the shifting voltage of DHE reflects internal (electrolyte) environmental changes during the initial charging-discharging. This behavior is probably attributable to the depletion of vanadium ions in the vicinity of the Pt wire which causes a gradual increase in the proton transport properties of the Nafion matrix surrounding the DHE or decreased in the polarization at the Pt wire. 21

Figure 3. Voltage profiles of full cell and its single electrode (cathode or anode vs DHE) for an all-vanadium RFB by using curved Pt wires based DHE with the resistor of (a) 1.0 MΩ and (b) 820 kΩ.
Download figure:
Standard image High-resolution imageTo further develop a stable DHE using a curved Pt wire, a resistor with a lower resistance, 820 kΩ, was used. As shown in Fig. 3b, the cathode or anode discharge voltage profile (that started close to 1.2 V or −0.3 V vs DHE) stayed consistent during initial cycling which again indicates a stable DHE. As discussed earlier, the straight Pt wire based DHE was shown to have a stable HER with a 1.0 MΩ resistor whereas the curved Pt wire based DHE resulted in a stable HER with a slightly lower resistor value of 820 kΩ. The resistor value differences are likely attributed to an increased in the contact resistance between the curved (longer) Pt wire and the membrane. This results in a lower resistance needed to achieve an optimum current for the HER in the DHE circuit. The results demonstrate a stable DHE that can be achieved by optimized design and an adjustable resistor.
Acid (proton) concentration effect on DHE
As there is co-existence of H+ and vanadium species in the electrolyte, the competition of HER and vanadium redox reaction occurs on the DHE. 21 Thus the acid (H+) concentration might affect the stability of DHE, which has not been reported in the open literature, however. For a stable DHE, the HER (Eq. i) continuously occurs in which the consistent supply of protons is required since protons are continuously consumed at the vicinity of the Pt wire. If the acid concentration is low, HER will compete with vanadium redox reaction, and a mixed potential might occur on the Pt wire, leading to an unstable and/or unreliable DHE potential.

To investigate the effect of acid concentration on the DHE performance, a flow cell with a lower acid concentration (3.3 M H2SO4) based electrolyte was assembled with a DHE using the resistor of 820 kΩ. The voltage profiles of the full cell and the individual electrodes (vs DHE) are shown in Fig. S1a (available online at stacks.iop.org/JES/167/160541/mmedia). When the concentration of H2SO4 was decreased from 4 M to 3.3 M in the electrolyte, the cathode or anode voltage (vs DHE) decreased by ca. 0.35 V, indicating the DHE voltage was increased by ca. 0.35 V. In the previous 4 M H2SO4 based electrolyte, the DHE with a resistor of 820 kΩ demonstrated a stable reference electrode that approaches 0 V with continuous HER. Here the DHE voltage in the cell with 3.3 M H2SO4 based electrolyte shifts to ca. 0.35 V which is close to the equilibrium potential E° for the V (IV)/V (III) reaction (Eq. ii).

The results indicate that the (negative) Pt electrode in DHE might be dominated by V (IV)/V (III) reaction in a lower acid concentration of electrolyte which probably leads to the inaccuracy and instability of the DHE. Thus the acid (proton) concentration should be considered as a factor to influence the reaction occurring on the DHE. A higher proton concentration at the Pt wire of DHE enhances the chances of the HER happening which improves the accuracy and stability of the DHE.
To achieve a stable DHE in the cell with 3.3 M H2SO4, the resistor was adjusted to a lower value so that the HER could happen and be maintained on the Pt electrode at a higher current. As shown in Fig. S1b, the cathode (or anode) voltage increased and remained stable at 1.2 V (or −0.3 V) vs DHE when the value of the resistor was decreased to 511 kΩ, indicating the DHE approached 0 V with a HER. A lower resistor leads to a higher current in the DHE, where a faster consumption of vanadium species occurs at the vicinity of the Pt wire and the HER dominates the Pt wire potential. In addition, the low acid concentration decreases the membrane conductivity, which also requires resistor with a lower value to maintain constant HER at the Pt wire. A more systematical study on the acid (proton) effect on the DHE potential, such as splitting vanadium effect, pH effect due to proton concentration on the potential, and conductivity effect due to proton concentration will be a subject of ongoing investigation in our laboratory.
Reliability and degradation mechanism study by optimized DHE
Factors that influence the stability of a DHE in a VRFB as discussed earlier (resistor value, Pt electrode shape, and acid concentration) have allowed the development of a stable DHE that can be used for long term cycling and investigation of degradation mechanisms in VRFBs, i.e. a curved Pt wire with a resistor of 820 kΩ in a concentrated acid (4 M H2SO4) based electrolyte solution.
Cell performance over long-term cycling
Figure 4 shows the long-term cycling performance of the all-vanadium RFB using 1.7 M vanadium, and 4.0 M H2SO4 based electrolyte and a Nafion N212 double membranes with the DHE inserted in the middle of the membranes.
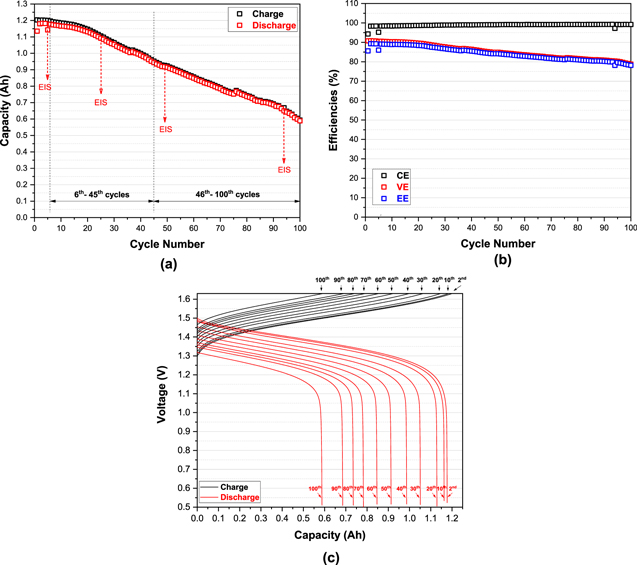
Figure 4. Electrochemical performance of an all-vanadium RFB using V (1.7 M) and S (5.7 M) based electrolyte and N212 double membranes at a constant current density of 50 mA cm−2: (a) charge and discharge capacities as a function of cycle number; (b) Coulombic efficiency (CE), voltage efficiency (VE), and energy efficiency (EE) as a function of cycle number; and (c) charge-discharge voltage profile as a function of capacity at different cycles (at the second and every tenth cycles).
Download figure:
Standard image High-resolution imageAs shown in Fig. 4a, the charge and discharge capacity continuously decreased from 1.203 and 1.135 Ah in the 1st cycle to 0.5934 and 0.5887 Ah in the 100th cycle respectively; discharge capacity retention is approximately 51.9%. The performance efficiencies (CE-Coulombic efficiency, VE-voltage efficiency and EE-energy efficiency) in Fig. 4b, however, exhibited much higher retention than the capacity, with the CE, VE and EE of 94.3, 90.8, and 85.6% in the 1st cycle and 99.2, 78.8, and 78.2% in the 100th cycle, respectively. The cell achieved a stable and even slightly increasing Coulombic efficiency of 98%–99% (except for the 1st cycle). And the EE, very close to the VE, achieved a high retention 91.3% for 100 cycles. Another phenomenon is that in the overall 100 cycles, both the capacity and the efficiencies remained nearly constant in the initial fifteen cycles. After 15 cycles, the capacity dropped significantly along with the VE (and EE). This indicated that the cell likely starts to degrade after the initial fifteen cycles.
The charge-discharge voltage profile over cycling in Fig. 4c further demonstrated that capacity fading was associated with increasing the overpotential of the cell. This is typically indicated by the continuously increasing charge voltage (in black) and decreasing discharge voltage (in red) as cycling proceeded. It has been reported that the increasing cell polarization with cycling possibly results from decreasing proton conductivity of the Nafion membrane over time and the increase in concentration polarization due to significant crossover. 6,26
Charge-discharge voltage profiles over long-term cycling: full cell and individual electrodes
Utilizing the developed DHE reference electrode inserted between the two Nafion N212 membranes, the charge and discharge voltage profiles of the full cell and individual electrodes (vs DHE) during 100 cycles are shown in Figs. 5a–5b. As shown in the charge process of Fig. 5a, the voltage curves of the full cell continuously increase during cycling which indicates the overpotential continues to increase as discussed previously. The voltage curves of individual electrodes (cathode or anode vs DHE) present quite different behavior throughout the 100 cycles. The cathode curve continuously increases with cycling (∼0.15 V) which exhibits a similar trend of the full cell (∼0.17 V). The anode cycling curves, however, remain relatively consistent with cycling. The observed phenomenon of single electrodes indicates the performance degradation (overpotential increasing) during the charge process of the cell was dominated by the cathode side.
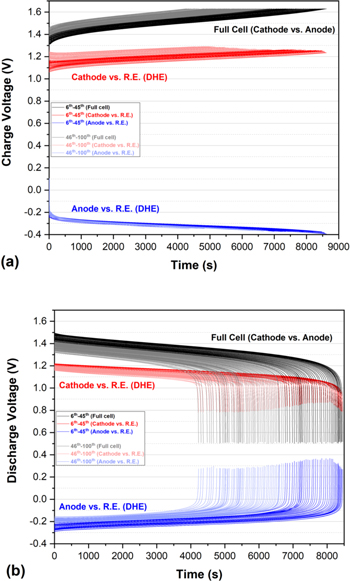
Figure 5. Long-term cycling performance of an all-vanadium RFB with DHE as reference electrode sandwiching between N212 membranes at a constant current density of 50 mA cm−2: (a) Charge and (b) discharge voltage profile of a full cell and its single electrode vs DHE reference electrode throughout 100 cycles (dark color: 6th−45th cycles, light color: 46th−100th cycles).
Download figure:
Standard image High-resolution imageFor the discharge process shown in Fig. 5b, the voltage curves of the full cell shifted with cycling in the opposite direction of the charge process. Shifting of the voltage curves, however, still indicates an increase in overpotential with cycling. Unlike the charge process, the individual electrodes in the discharge process did not show consistent behavior throughout the whole 100 cycles. In the initial 45 cycles, the voltage curve of the full cell decreased gradually by 0.1 V during which time the anode curve increased by 0.1 V and the cathode curve was relatively constant. It can be deduced that the overpotential increase in the initial 45 cycles is mostly derived from the anode contribution. In the 46th−100th cycles, the voltage curve of the full cell further deceased by 0.1 V while the cathode curve decreased by 0.05 V and the anode curve increased by 0.05 V, indicating the performance fading of the full cell is from the degradation of both cathode and anode with a similar contribution. Thus, in the discharge process of the cell, the anode side dominates the initial ∼50 cycles of performance degradation whereas the cathode degradation is insignificant but plays a more significant role in later cycling (>∼50 cycles).
Prior art using DHE in RFBs suffered issues associated with potential drifting over long-term cycling. Previous work 21 found that the average potentials of cathode and anode (vs DHE) increased by 4.5 mV after 10 cycles and 76 mV after 50 cycles, this indicated a significant drift of the DHE potential to a lower potential with cycling that was associated with either a gradual reduction in proton transport for the Nafion matrix surrounding the DHE or an increase in the passivation at the Pt electrode. 21 The reported issue of the drifting of the DHE potential with long-term cycling was not observed in this work. Although the voltage curves of the cathode (vs DHE) continuously increase in Fig. 5a, the anode curve remained consistent over cycling, indicating the voltage shift was originally from degradation (overpotential increasing) in the cathode. The voltage curve of the full cell shows a matching trend to the cathode behavior. Moreover, the observed gradual decreasing and increasing of the voltage curves of the cathode and anode respectively in the discharge process (Fig. 5b) were associated with the decrease in the voltage curves of the full cell. The potential drifting associated with a DHE reference electrode will always lead to the potential increasing (or decreasing) of both cathode and anode (vs DHE) simultaneously. 21 A stable DHE was demonstrated for long term cycling of VRFBs in this work. This is the first study to report a stable DHE that can go through hundreds of cycles for a VRFB, and it is also the first study to disclose the individual electrode contribution to the performance degradation during long-term cycling of a VRFB by using a stable and reliable DHE.
To further explain why the newly developed DHE is much more accurate and stable than the prior art, the main factors to influence the DHE should be taken into consideration, which turned out to be the DHE design, acid (proton) concentration, and the cell size. Compared with the prior art of DHE, the improvement in this work for the DHE design optimization is the contact enhancement between DHE (Pt wires) and the membranes, such as using different (curved) shape of Pt electrode to increase its contact area with the membranes, as well as introducing a lamination process combined with Nafion solution soaking (shown in Experimental). Moreover, a highly concentrated acid (4 M H2SO4) environment is another main reason to improve the stability of DHE as discussed above, whereas a relatively lower concentration of acid (e.g. 2–3 M) was mostly used in the previous studies. 21 In addition, the effect of cell (electrode) size, which was not discussed in detail here, was probably hardly to be ignored. Our recent study revealed that DHE might be more stable in a relatively smaller cell (e.g. 10 cm2 for the electrode area in this work) than that in a bigger cell (e.g. 49 cm2), possibly due to the non-uniform current distribution. 27 The stability of DHE in a scaled cell will be a subject of ongoing study in our laboratory.
Overpotentials at the end of charge and discharge: full cell and individual electrodes
Figure 6a–6b shows the selected overpotentials as a function of cycle numbers for the full cell and individual electrodes (vs DHE) at the end of charge and discharge. The relative proportion of the overpotential for individual electrodes was also plotted in Figs. 6 c–6d. The overpotential (ΔV) was calculated from the difference between the voltage at the operation current (50 mA cm−2) and the OCV at the end of charge (1.63 V) or discharge (0.5 V). In general, the overpotential of the full cell gradually increased over cycling at the end of charge or discharge. Relatively higher overpotentials were observed at the end of discharge.

Figure 6. (a)–(b) Selected overpotentials as a function of cycle numbers for the full cell and individual electrodes (vs DHE) at the end of charge and discharge; and (c)–(d) the relative proportion of overpotential for individual electrodes.
Download figure:
Standard image High-resolution imageAt the end of charge in Figs. 6a, 6c, the overpotential increased with cycling in both the cathode and anode, whereas the overpotential of the anode was much higher than that of the cathode, indicating the anode reaction limited the charge capacity. 21 After approximately 70 cycles, the overpotential of the anode reached its highest point and then reached a plateau; the overpotential of the cathode gradually increased over cycling. At the end of discharge in Figs. 6b, 6d, the overpotential of the anode increased while the overpotential of the cathode slightly decreased until the 25th cycle where the anode and the cathode reached the highest and lowest overpotentials respectively. Beyond 25 cycles, the overpotentials had opposite trends: the anode overpotential decreased and the cathode overpotential increased until they almost reached a similar overpotential near 100 cycles.
The results indicate that the anode reaction limited the charge capacity of the cell throughout 100 cycles, and it also limits the discharge capacity in the initial 50 cycles. The cathode reaction more strongly influenced the discharge capacity (31%–49% ΔV in Fig. 6d) than in the charge capacity (20%–39% ΔV in Fig. 6c). In addition, the cathode overpotential contributed a more significant role in the capacity limitation as the cycles proceeded (especially after ∼50 cycles). For example, the cathode showed almost the same influence as the anode on discharge capacity limitation at the 93rd cycle. It has been reported that the anode reaction of a VRFB limits both the charge and discharge capacity in the initial cycles, 21 which agrees well with our result. This phenomenon is probably associated with the (vanadium ion based) electrolyte crossover issue during cycling that leads to the imbalanced vanadium active species and the asymmetrical valence of vanadium ions in positive and negative electrolytes. 6 This work was first to disclose the role of individual electrodes in limiting the charge or discharge capacity over long-term cycling. The results were achieved by using a stable DHE reference electrode and in situ monitoring of the cathode and anode throughout 100 cycles of cell charging-discharging.
Electrochemical impedance spectroscopy (EIS) measurement: full cell and individual electrodes
Using the developed stable DHE, the electrochemical impedance spectroscopy (EIS) of the full cell and individual electrodes (cathode or anode vs DHE) was also measured during long-term cycling using the stable DHE. The impedance distribution across the whole flow cell can be dissected and the contributions from positive and negative electrodes can be decoupled. Shown in Fig. 7 are typical Nyquist plots at the end of charge (a–b) or discharge (c–d) with different cycles. The theoretical value (Zcathode + Zanode) shown in Figs. 7a and 7c, the sum of measured cathode and anode impedance, was in a good agreement with the experimental result of the full cell; this behavior demonstrates the good accuracy of the DHE in the EIS measurement. 22 The measured full cell, cathode and anode spectra demonstrated different features during cycling. At high frequencies in the full cell and anode spectra, there is an inductance resulting in negative –ZIM, whereas the cathode exhibits a high frequency arc which indicates a different process, e.g. membrane-electrode interface resistance, etc. The impedance measurements consist of a semicircle at higher frequencies followed by flat and straight lines at lower frequencies. The semicircle is indicative of the charge transfer process; the intercept at higher frequency at the real axis represents the Ohmic resistance (Roh). The diameter of the semicircle represents the charge transfer resistance (RCT). 4 The frequency range for the semicircle is also different for the full cell, the anode and the cathode. For the full cell and the anode, the semicircle appeared at high frequency range whereas the semicircle appears at medium to low frequency range for the cathode. The difference in frequency range indicates the difference in the double layer capacitance or constant phase element (CPE) at the electrode/electrolyte interface accompanying the charge transfer process. The high frequency range of the semicircle for the full cell and anode indicates small effective double layer capacitance at the electrode/electrolyte interface while the low frequency range in cathode indicates a large effective double layer capacitance for the cathode electrode/electrolyte interface. This behavior suggests that the electrode/electrolyte interface might be different for the cathode and anode. The straight line at the lowest frequency range is caused by a Warburg resistance due to the electroactive species transport. The features between the straight line and semicircle are likely due to other processes, e.g. non-ideal charge transfer process (RCT perhaps performs like a CPE) and/or other processes accompanied with charge transfer resistance such as absorption etc. 26
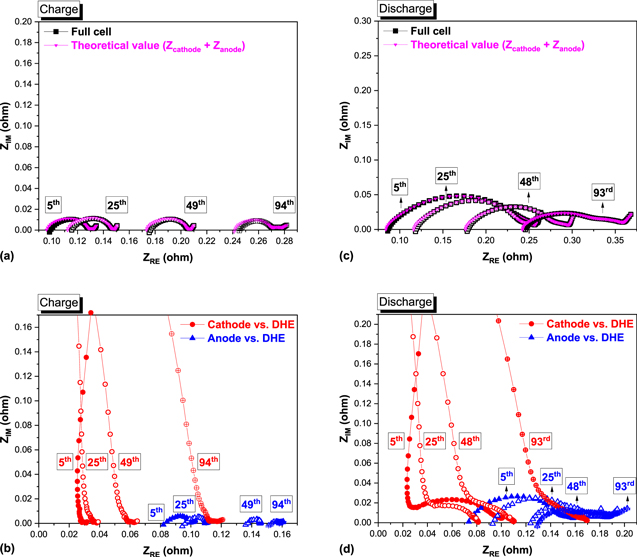
Figure 7. Selected Nyquist plots by EIS spectra of the full cell and its individual electrodes (cathode or anode vs DHE) at the end of charge (a), (b) and discharge (c), (d) in an all-vanadium RFB with different cycles, frequency ranges 100 kHz to 100 mHz, and perturbation voltage 10 mV.
Download figure:
Standard image High-resolution imageThe ohmic and charge-transfer resistances of the full cell and individual electrodes were plotted as a function of cycle number in Fig. 8 using Zview software. As shown in Figs. 8a, 8d, the Roh of the full cell increased significantly with cycling for both the charge and discharge process, which was derived from the continuous increase of the Roh in both the cathode and anode where much larger ohmic resistance was observed in the anode than the cathode, and the cathode showed the higher increase rate than the cathode after 50 cycles. The RCT of the full cell, however, remained stable in the initial cycles and then decreased gradually over cycling, as shown in Figs. 8b, 8e. In particular, much higher RCT was observed at the end of discharge than charge. Here the individual electrodes showed quite different behaviors: the anode started to decrease after initial cycles that was consistent with the full cell while the cathode tended to the opposite direction.

Figure 8. Ohmic resistances (Roh) and charge transfer resistances (RCT) of the full cell and its individual electrodes (cathode or anode vs DHE), at the end of charge (a), (b) and discharge (d), (e) with different cycles; and the relative proportion of Roh or RCT for individual electrodes (c), (f).
Download figure:
Standard image High-resolution image
The relative proportions of Roh and RCT for individual electrodes were further plotted in Figs. 8c, 8f. At the end of charge, the total Roh (combining cathode and anode) played a dominate and gradually increasing role (from 79% to 92%) in the total resistance while the RCT was insignificant and kept decreasing (from 21% to 8%) throughout 100 cycles. In comparison, the RCT dominated at the end of discharge during initial cycling and then slowly decreased (from 64% to 33%) until 70 cycles followed by slight increase (to 35%) near 100 cycles. The Roh contribution increased as cycling increased (from 36% to 67%) until 70 cycles followed by slight decrease (to 65%) in the end.
It can be concluded that cell impedance is greater at the negative side at the end of charge and discharge process, which suggests that the rate limiting step in a VRFB is at the anode side. These results are in agreement with previously published results (particular in the initial 50 cycles). 19 In general, the impedance of the positive electrode increased relatively slow before 50 cycles, but had a greater contribution to the performance degradation over long-term cycling. The results are in good agreement with the overpotential trend shown in Fig. 6.
Conclusions
The investigation on reliability and degradation mechanisms in an all-vanadium redox flow battery was achieved using a stable reference electrode based on the DHE. Factors influencing the accuracy and stability of the DHE were first determined which included: (i) the current flowing through the DHE (adjusted by a resistor), (ii) the contact area between DHE and cell membrane (adjusted by the shape/area of Pt electrodes), and (iii) the acid (proton) concentration of the electrolytes. By design and system optimization, the newly developed DHE reference electrode demonstrated high accuracy and long-term stability that enables the in situ monitoring of individual electrode signals (such as potential and impedance) throughout hundreds of cycles in a vanadium RFB. Using this approach, the contributions of the cathode and the anode were determined. The overpotential continuously increasing during charging and discharging over long-term cycling. The overpotential at the end of charge and discharge further indicated the anode was the rate limiting step in both the charge and discharge process throughout 100 cycles; the cathode had a more significant influence after ∼50 cycles. EIS measurement were taken at the end of charge and discharge and further demonstrated and verified a similar trend observed in earlier potential measurements.
Acknowledgments
The authors would like to acknowledge financial support from the U.S. Department of Energy's (DOE) Office of Electricity (OE) (under Contract No. 57558). We also are grateful for insightful discussions with Dr. Imre Gyuk of the DOE-OE Grid Storage Program. Pacific Northwest National Laboratory is a multi-program national laboratory operated by Battelle for DOE under Contract DE-AC05-76RL01830.