
Abstract
Lithium-ion batteries (LIBs) have a profound impact on our modern society because of its diverse applications. In the state-of-the-art battery technology, the procedure for slurry preparation remains an important challenge which is vital for electrochemical performance enhancement and usually exhibits higher cost. In this work, two procedures are designated for the preparation of LiNi1/3Co1/3Mn1/3O2 (NMC111) cathode slurry. In procedure A, a mixture of active material and conductive carbons are blended with an additional NMP solvent, while, in procedure B, the NMP is introduced after mixing in dry of active material and carbons. Half-cell prepared by the method A exhibited better capacity and cyclability, which delivered 158.8 mAh g−1 and retained 89.8% capacity compared to 151.2 mAh g−1 and 81.3% obtained by the method B at 0.1 C rate. Full-cell also showed its superior performance with a maximum capacity of 155.5 mAh g−1 and 93.9% retention after 100 cycles. In the rate capability test, the cells fabricated by method A could perform well up to 2 C while, for method B, the cell shows poor performance. These outstanding performances were explained by the small charge transfer resistance of the cathode-based method A due to the well-dispersed electrode compositions.
Export citation and abstract BibTeX RIS
The first generation of cathode materials used in LIBs were layered oxide LiCoO2 (LCO), spinel oxide LiMn2O4 (LMO), olivine oxide LiFePO4 (LFP), etc. Batteries manufactured with these active materials exhibit high operational voltage 1 and low-self discharge 2 with LCO, high rate capability 3 and lower cost 4 with LMO, excellent safety 5,6 and sustainable synthesis 7 with LFP. LiNi1/3Co1/3Mn1/3O2 (NMC111) is among representatives of NMC layer oxides family firstly introduced by Ohzuku and Makimura in 2001. 8 Currently, it has been successfully applied in commercial LIBs market since it offered several advantages of high capacity, high energy density, good capacity retention, and safety characteristics. 8–13 These advantages are harmonized with those key characteristics required for new applications, especially in the automotive industry compared to the classical LiMn2O4 and LiFePO4 materials. 14–17 Moreover, NMC111 is also cheaper than the LiCoO2 due to the decrease of the high cost of cobalt content.
Inspiring from great features of NMC111 cathode, several scientists have focused on synthesis route, 18–22 structural orientation, 23 surface modification, 24–29 elements doping, 10,30 and porosity control. 31,32 Generally, the electrochemical behavior of a novel active material is evaluated via making composite electrodes usually followed by the standard formulations or the common lab-procedures, 30,32 As earlier stated, preparing the cathode slurry is an inevitable part of the electrode fabrication process, however, it has not been vigorously considered whether at the laboratory size or even in the large scale production. 33–38 As a result, the cell performance is still far away from the optimized condition due to agglomeration of the electrode individual ingredients and homogeneity issues. 39
Regarding the electrode preparation, to obtain a well-mixed slurry, PVdF binder must be added into the mixture right after initial blending the dry powders, then followed by adding the N-methyl pyrrolidone (NMP) solvent or adding the binder together with the solvent after firstly mixing the dry powders. Indeed, both ways all significantly improved the discharge capacity and the long lifespan of LiCoO2 active material. Dividing the NMP solvent or the styrene-butadiene rubber (SBR) binder and the carboxymethyl cellulose (CMC) thickener into multiple addition steps also produced a better dispersion of compositions, reduced electrode polarization as well as improved cycling performance and rate capability. 35,40 Recently, another study on the fabrication of NMC111 electrode showed an effective pathway of coated-carbon (Super C65) on the surface of active material with the PVdF binder solution and the effect of various carbon black (CB) fractions via dry mixing, 32 Besides that, the role of dispersion agents such as Triton-100, 41 poly (4-styrene sulfonic acid) (PSSA), 42 polyethyleneimine (PEI), 43 and ammonium polyacrylic acid (PAA–NH4) 44 facilitating the cathode slurry preparation could not be ignored as it increases the homogeneity of components dispersion, adhesion strength, and agglomeration phenomenon reduction. These approaches lead to enhance the diffusion of lithium ions (Li+), electrical conductivity, and cycling stability.
This work proposes two procedures for slurry preparation which aim to investigate their effect on the fabrication of LiNi1/3Co1/3Mn1/3O2 electrodes. The electrochemical performances and the distribution of electrode components were studied in detail. The electrochemical performance of two methods was evaluated in NMC111/Li (referred to as a half-cell) and in NMC111/graphite (referred to as a full-cell) in terms of capacity, cyclability, rate capability, and electrochemical impedance.
Experimental
Electrode compositions
The positive electrode comprises of an active material of NMC111 (MTI Corporation, USA), a mixture of Super P (Imerys, Switzerland) and KS6 (Timrex) conductive carbons, and a binder of polyvinylidene fluoride (PVDF) (99,9%, Sigma-Aldrich, USA) in weight ratio 94:3:3 (with the ratio of Super P is twice of KS6). The negative electrode formulation was 95 wt% graphite (Imerys), 4 wt% CBC/SBR binder, and 1 wt% Super P. The anode loading density was about 2.5 mg cm−2.
Electrode preparation
To prepare cathode slurry, two widely-used procedures were proposed to study the mixing efficiency as outlined in Fig. 1. A ball milling machine (MSK-SFM-3 Desktop, MTI Corp., USA) was used to obtain homogeneity of slurry mixing at 1200 rpm. The powders used to prepare the electrodes were essentially pre-dried together for 12 h at 110 °C. In method A (Fig. 1a), the dry powders were mixed with N-methyl pyrrolidone (NMP) solvent for 30 first minutes before the addition of PVdF/NMP binder solution (10 wt%) and continuously kept mixing for 30 min. In method B (Fig. 1b), NMC powder and carbons initially mixed in 30 min without NMP, the binder solution with an additional amount of NMP was then introduced into the powders and continuously mixed for 30 min. The total amount of NMP used (including in already PVdF solution and the additional amount) was 1.2 times higher than NMC111 in both methods. The cathode slurry was finally cast uniformly on a 12 μm thick aluminum foil and then dried in a vacuum oven for 12 h at 110 °C. The loading density was 5.9 ± 0.6 mg cm−2.
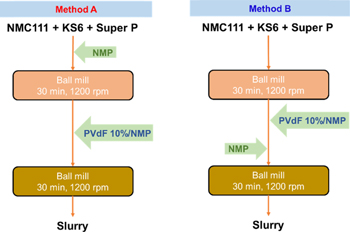
Figure 1. Schema illustrating method A and method B for NMC111 slurry preparation.
Download figure:
Standard image High-resolution imageCell-assembly
The electrolyte solution contained 1.2 M lithium hexafluorophosphate (LiPF6) in EC: EMC (3:7 v/v) + 1 wt% VC (≥99%, Sigma-Aldrich, USA). The electrochemical measurements were performed in CR-2032-format stainless steel coin cells (MTI Corp., USA) with the same polypropylene (PP) (1.8 cm diameter) separator. The total amount of the used electrolyte was 120 μl including 40 μl for wetting cathode surface and 80 μl electrolyte for wetting PP separator, respectively. Special attention should be taken to align the anode symmetrically above the cathode to obtain reliable data and the reproducibility of electrochemical performance. 45 The anode (1.77 cm2) is a piece of lithium foil in half-cell or the graphite disc in full-cell. The cathode (1.77 cm2) prepared by two methods was punched into ground shape. The graphite anodes should be used to match the N/P ratio of 1.15. Assume that theoretical capacity of 360 mAh g−1 for graphite and 160 mAh g−1 for NMC111. All cells were assembled in an argon-filled glove box (O2 < 10 ppm, MBraun, Germany).
Structure and morphology determinations
The active electrode material was characterized by a powder X-ray diffraction technique on Bruker D8 Advance Diffractometer, using CuKα X-ray source (λ = 1.5406 Å) to determine the crystal structure before and after drying. The prepared electrodes through two methods were simultaneously observed by Scanning electron microscopy (SEM) and Energy Dispersive X-ray spectroscopy (EDS) on a Hitachi's S-4800 (Japan).
Electrochemical evaluations
After assembling, the cells were aged for 14 h at 25 °C and then tested on MPG 2 Battery Tester (BioLogic, France) at room temperature. For the half-cell test, the cell was charged and discharged at 0.1 C rate (1 C = 278 mA g−1—relating to theoretical capacity) in voltage windows of 3.0–4.35 V. Regarding the full-cell evaluation, the charge-discharge protocol was carried out in the same voltage range with a rate of 0.05 C in the three initial cycles. Then, the current of 0.1 C was applied for the following cycles. Using various current rates aims to form a stable solid electrolyte interface (SEI) in the initial cycles and shorten the time in the following cycles. 46
The electrochemical impedance spectroscopy (EIS) measurements were performed on a VSP impedance analyzer (Bio-logic SAS, France) in a frequency range of 1 MHz to 10 MHz at 8 mV amplitude. The cells rested at least 12 h to stabilize the open circuit potential before EIS testing.
Results and Discussion
X-ray diffraction (XRD)
The XRD method was subjected to determine the phase purity of NMC111 (Fig. 2). All the diffraction peaks could be indexed as a layered hexagonal α-NaFeO2 structure with R-3m space group. The large ratio of I(003)/I(104) (1.41) and obvious split of (006)/(102) and (108)/(110) peaks indicated a minimal variance between lithium and transition metal sites. 13 Sintering the active powder NMC111 at 110 °C did not show any change of crystal structure compared to the as-received material. However, all peaks' intensity of the pre-heated sample was higher along with a very low and smooth background compared to the pristine one. This result was in agreement with the role of high humidity existing during transportation and storage upon cycling stability, which was previously discussed on the moisture-sensitive of NMC family cathode materials. 47 Otherwise, the pre-drying step of active materials including the NMC111 and carbons was necessarily introduced before the preparation of cathode slurry.
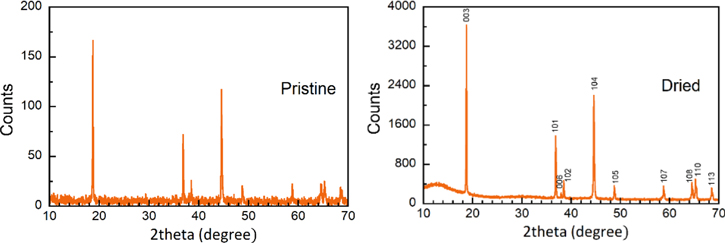
Figure 2. XRD patterns of as-received NMC111 material (left) and after drying 12 h in a vacuum environment (right).
Download figure:
Standard image High-resolution imageHalf-cell testing
The voltage profile of half-cells Li∣∣NMC111 prepared by two methods is shown in Fig. 3. In general, the charge-discharge curves are identical with the short plateau of 3.6–3.8 V and the open-circuit voltage (OCV) is mostly 2.6 V in both preparation methods. However, the electrochemical performance was quite different depending on the method of electrode preparation. At 1st cycle, the electrode prepared by the method A exhibited 158.8 mAh g−1 with Coulombic efficiency (CE) of 87.3%, while the discharge capacity was only 149.4 mAh g−1 with 84.4% CE by using method B. The initial CE of the two methods about 90% could be originated from the oxidation reaction of electrolyte to form a cathode electrolyte interface (CEI), especially with the presence of VC additive. And this side reaction still occurred in the second cycle. During long-term cycling, the Li∣∣NMC111 cells exhibited a potential polarization, which is especially serious in the cell prepared by the method B. This phenomenon can be explained due to the inhomogeneous distribution of electrode ingredients in the cathode preparing-based method B than that of method A. Indeed, the large active surface of NMC/carbons area and the low contact electrolyte-electrode resistance could be expectedly induced. Noting that the total over-potential could be also attributed to the surface of Li anode, 48 but the difference in potential polarization in both methods is assumed to be only affected by the cathode because of the similar anode usage.
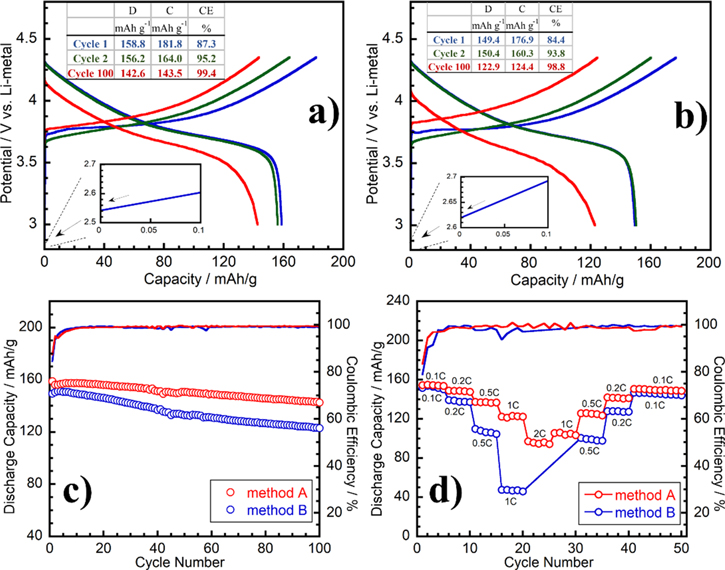
Figure 3. Charge-discharge profile of Li∣∣NMC111 half-cell followed by method A (a) and method B (b) (at 25 °C in the 3–4.35 V range, current density contained 0.1 C). The half-cell's long-cycling performance (c) and rate capability test (d). The inset tables show charge (C) and discharge (D) capacities and Coulombic efficiencies (CE).
Download figure:
Standard image High-resolution imageFigure 3c compared the cycling performance of the two prepared types of NMC111 cathode in Li∣∣NMC111 cell over 100 cycles at 0.1 C. The electrode produced by the method A always showed its superior cycling performance with high discharge capacity and good CE. Indeed, a good capacity of about 142.6 mAh g−1 and 89.8% capacity retention were still obtained at the final cycle. Oppositely, the cathode-based method B displayed the poor performance, typically the discharge capacity was only 122.9 mAh g−1 and 81.3% retention at the 100th cycle. The average CE between the third and 100th cycle of method A was 99.1%, which is higher than 89.9% of method B.
The rate capability test is shown in Fig. 3d corresponding to various rates of 0.1 C, 0.2 C, 0.5 C, 1 C, and 2 C. With the increasing current density, NMC111 prepared by method A exhibited better rate performance than the cathode based-method B. At 2 C, the rate capability was significantly different between the two methods of cathode preparation. The cathode based-method B gave unworked cell while the one based-method A held 62.7% of capacity compared to the value at 0.1 C. Additionally, method A also exhibited a slight change in CEs at a high C-rate. The excellent rate capability performance of the cathode-based method A could be ascribed to the low internal resistance of the electrode, leading to low cathode polarization even at the high current rate. Meanwhile, at a low rate of 0.1 C, the internal resistance seems probable not to give an impact on the cells' capacity, however, its effect became seriously since the rate of 0.2 C was applied.
Full-cell testing
In full-cell configuration, all cells display quite similar charge-discharge curves (Figs. 4a, 4b) and their curves are not different from the curves of half-cell. In the first cycle at 0.05 C rate, the performance of Graphite∣∣NMC111-based method A was slightly poorer than the other method. In particular, the discharge capacity of 133.1 mAh g−1 and 75.9% CE compared to 142.0 mAh g−1 and 76.1% CE, respectively. However, since the 4th cycle at 0.1 C rate, the cathode-based method A is always better than the one-based method B as it exhibited a discharge capacity of 149.4 mAh g−1 and 99.6% C compared to the value of 122.2 mAh g−1 and 98.8%, respectively. The initial CE of the full-cells is slightly lower than that of half-cells, which could be attributed to the strong generation of an SEI layer on the graphite anode resulting in the irreversible active Li+ consumption and increase of the charge capacity, and thus the decrease of CE value. 49 Contrary to the half-cell, lithium metal like a huge active Li+ reservoir is used as the negative electrode and can compensate for any loss of Li+ consumption. Hence, it reduces the initial specific capacity loss. Besides, hindrances in the lithiation kinetic of the cathode also contribute to the irreversible capacity loss. 50 SEI layer serves as a very thin layer to suppress further reduction of the electrolyte and the lithium consumption. Therefore, once the SEI layer is stabilized at the 4th cycle, the excellent CE was obtained in both methods, about 99.5%.

Figure 4. Charge-discharge profile of full-cells of Graphite∣∣NMC111 prepared by (a) method A and (b) method B (at 25 °C in the 3–4.35 V range, the current density of 0.05 C in the first 3 cycles and 0.1 C in the following cycles). The long-cycling performance of full-cells (c) and rate capability test (d). The inset tables show charge (C) and discharge (D) capacities and Coulombic efficiencies (CE).
Download figure:
Standard image High-resolution imageFigure 4c showed a comparison of the cycling performance in full-cells using the cathode prepared by two methods. It is seen that the capacity of the cathode-based method A keeps stabilizing until the 21st cycle, even at the rate of 0.05 C applied from the 4th cycle. However, with the method B, the capacity decreased at a high rate and constantly faded over cycling. The general increase of capacity in a few first cycles could be explained by the incomplete formation of the SEI/CEI layer and it stabilizes gradually in the following cycles. 51 In some cases, this formation is over-controlled and becomes too thick, which induces an increase of electrochemical resistance during cycling (as shown in Figs. 5d–5f). As consequence, the capacity reduces unexpectedly. Furthermore, the surface area of the cathode also indirectly affects the generation of the CEI through a separator. The high active electrode surface improved the smooth formation of the SEI layer which helps to reduce the formation of dendrites due to the cracking of this layer. Evidently, at the 100th cycle, the full-cell with cathode-based method A delivered 146.0 mAh g−1 and remained 93.9% of initial capacity compared to the highest value of 155.5 mAh g−1 obtained at the 21st cycle. On the contrary, the full-cell using cathode-based method B suffered seriously the capacity fading, which shows the capacity of 122.2 mAh g−1 and kept only 81.8% of initial capacity compared to the 4th discharge capacity. The cycle life of the full-cell was even longer than that of the half-cell, especially with method A. It could be explained by the thick CEI layer forming on the NMC111 cathode caused by the stronger degradation of electrolyte when using the Li-metal anode rather than its graphite counterpart. 52
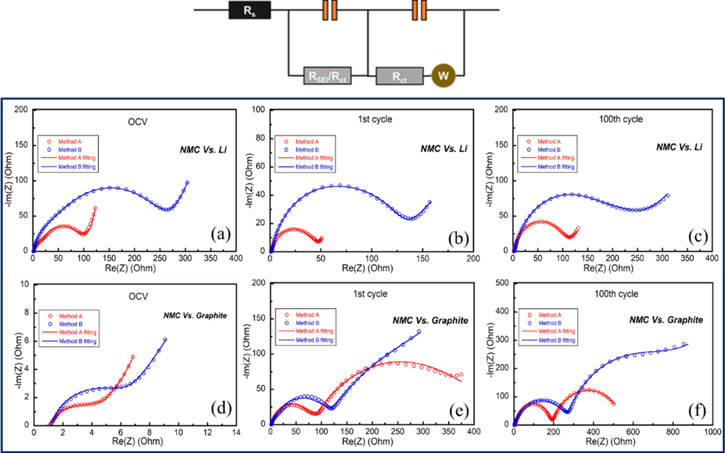
Figure 5. Electrochemical impedance spectra of cells using cathode NMC111 prepared by method A and method B obtained on half-cell: after (a) OCV, (b) 1st and (c) 100th cycles; on full-cell: after (d) OCV, (e) 1st and (f) 100th cycles (at frequencies from 1 MHz to 10 MHz).
Download figure:
Standard image High-resolution imageFigure 4d displayed the full-cell operation at different current rates. Like the half-cell, cathode-based method A showed expectedly the good performance at all scan rates. Indeed, the initial discharge capacity and CE value repeated when turning back from 2 C to 0.1 C. In the case of method B, the electrochemical behavior was even worse than the half-cell and the full-cell could not work at 1 C. At high C rate, the full-cell suffers the capacity fading, only 50.3% of the initial value. Indeed, this result could be related to the high cathode polarization which is mainly derived from electrochemical impedance including the contact resistance of NMC/carbons interface and the thickness resistance of the SEI formation.
Electrochemical impedance spectroscopy (EIS)
A comparison of electrodes impedance on the two configurations is shown in Fig. 5. The EIS results were simulated using an equivalent circuit given inside Fig. 5 including two charge transfer processes through the SEI layer and the electrode-electrolyte interface (SEI). In half-cell, before cycling, the EIS spectra of both methods contains one depressed semicircle relating to charge transfer resistance at a high-frequency region and a slope line related to the diffusion part at a lower frequency region. The linear diffusion becomes curvature where the impedance goes to a finite value at very low frequency due to the finite-length of diffusion between the two electrodes. The full-cell at OCV state shows the same feature likely the half-cell. However, after cycling, the two-semicircle feature could only be seen in the EIS spectra of full-cell caused by the charge transfer process of both anode/cathode and the presence of the SEI layer. The reason explained for one-semi circle in half-cell after cycling may be the overlap of two processes occurring at the same or very closed frequency. It is noticed that the resistance increased fast during cycling, which is responsible for the capacity fading of the cells. In three states including OCV, 1st, and 100th cycles, both the half and full-cells using the NMC111 cathode based-method A were better than those of method B. Indeed, the better electrochemical behavior of the cells with NMC111 cathode prepared by method A was contributed by the lower internal impedance.
Scanning electron microscope (SEM)
SEM images were performed to observe the differences in the surface and components distribution of electrode prepared by two methods. The difference in surface area of the two electrode could be ignored as both electrodes were identical in terms of mass loading, thickness, and viscosity of slurry before making the electrodes due to the same NMP/NMC ratio application. Figure 6d indicated the large distance between the active material particles which are less covered by the carbon particles in using method B to prepare the cathode. Additionally, the agglomeration of active particles causes the discontinuity of the electric pathway and the cracks occurring on the cathode surface. Indeed, EDS dot images in Fig. 6c further confirmed the inhomogeneity of carbon dispersion on the cathode surface. Furthermore, in the so-called "drying" method B, NMP is added together with PVdF to be so viscous for obtaining the homogeneity between carbon and active powder. Hence, the carbons aggregation could be derived from the stronger affinity of the PVdF with the conductive carbons than with the active material. 37 Oppositely, in the so-called "wetting" method A, the NMP solvent is additionally added into the first stage helping to flexible dispersion of all compositions and deagglomeration of the carbons during the mixing process. Thus, well-dispersed carbons among NMC111 particles are seen and the difference in surface distribution is quite small (Figs. 6a, 6c). Moreover, it revealed the ingredients of the electrode surface are more compact and less empty spaces between them (Fig. 6a). It also leads to the higher surface area of NMC/carbons and the lower contact resistance. Therefore, these factors contribute to the smaller charge transfer resistance of cathode-based method A compared to the other method. Besides all, EDS mapping of Mn element shows its uniform distribution on the surface of the cathode.

Figure 6. SEM images of the electrode films prepared by method A (a) and method B (d). The EDS mapping of manganese element in NMC111 (b), (e) and carbons (c), (f).
Download figure:
Standard image High-resolution image
Conclusions
This work demonstrated two current procedures for preparing NMC111 cathode slurry. In "wetting" method A, the mixture of active material and conductive carbons were initially mixed along with the addition of the NMP solvent. For the other method "drying" B, NMP immediately is added after finishing the mixing step of active material and carbons. Half-cell with the electrode based-method A illustrated a higher capacity of 158.8 mAh g−1, good cyclability (over 100 cycles at 0.1 C rate), and retained 89.8% of the initial capacity. For method B, half-cell with the electrode results in 151.2 mAh g−1 and 81.3% capacity retention. Full-cell with graphite anode, cathode-based method A also exhibited better performance, typically a capacity of 155.5 mAh g−1 and remains 93.9% of initial capacity at the 100th cycle. The cell fabricated using method B illustrated 154.0 mAh g−1 and retains 80.3% of the initial value. In the rate capability test, both half and full-cells using the cathode-based method A results in superior performance up to 2 C rate. For cell fabricated using method B, the cell didn't work. The lower internal resistance at the OCV, 1st, and 100th cycles are in a good agreement with the electrochemical performance of the cells produced by the method A. SEM results evidently show a uniform dispersion of electrode ingredients including active material, binder, and carbons in method A when compared to method B. Besides, there is a decrease of empty spaces between the ingredients enlarging the surface area of NMC/carbons interface, thus the lower cathode polarization and contact resistance of the electrode was obtained. Eventually, it leads to outstanding rate capability and long cycling performance. In conclusion, the high-effectiveness preparation of method A should be deployed in producing NMC111 cathode slurry to catch up on the outstanding performance.
Acknowledgments
This research is funded by Viet Nam National University of Ho Chi Minh City (VNU-HCM) under grant code B2019-18-06.