
Abstract
In this work, a carboxylic acid-functionalized graphene (Gr-COOH)-modified glassy carbon electrode (GCE) (Gr-COOH/GCE) was developed and applied for the sensitive determination of hydroquinone in pharmaceutical products. Gr-COOH on a GCE was used as an adsorbent in adsorptive anodic stripping voltammetry (AdASV). Scanning electron microscopy (SEM), Fourier transform infrared spectroscopy (FT-IR), cyclic voltammetry (CV) and AdASV were employed to characterize the surface morphology and electrochemical behavior of the Gr-COOH/GCE. The sensitivity of the Gr-COOH/GCE was 3, 7, and 10 times higher than those of a Gr/GCE, GCE-COOH and bare GCE, respectively. Several operational parameters, including the amount of Gr-COOH, preconcentration potential and preconcentration time, were optimized. Under optimum conditions, the peak current response linearly increased with the hydroquinone concentration in the range of 0.1–40.0 μmol l−1 (r = 0.999) with a high sensitivity of 19.86 μA (μmol l−1)−1 cm−2 and a limit of detection of 0.04 μmol l−1. This proposed modified electrode exhibited good repeatability, accuracy and precision. It also showed good anti-interference properties. This method was successfully applied to detect hydroquinone in skin-lightening products.
Export citation and abstract BibTeX RIS

This is an open access article distributed under the terms of the Creative Commons Attribution 4.0 License (CC BY, http://creativecommons.org/licenses/by/4.0/), which permits unrestricted reuse of the work in any medium, provided the original work is properly cited.
The dangerous side effects from using skin-lightening products, which claim to eliminate freckles and make skin white, are an important problem that needs to be quickly corrected. Hydroquinone is added to these products because it can inhibit melanin production in the skin, leading to white skin. 1 The European Union (EU) and Environmental Protection Agency (EPA) have banned hydroquinone from cosmetic products 2 because its long-term application results in numerous adverse effects, such as severe dermatitis irritation, burning sensations, severe inflammation, skin peeling and harm to the fetus in pregnant women. 3,4 However, hydroquinone is still being illegally used in developing countries in skin-whitening cosmetics. 5 In the USA, the Food and Drug Administration has proposed concentrations between 1.5 and 2% in skin lighteners. In some countries, even higher concentrations may be found in skin lightening products. 6 Therefore, the development of a highly sensitive, simple, and rapid technique for the determination of hydroquinone in cosmetic products is highly urgent and necessary for consumer safety. Various techniques have been used for the detection of hydroquinone, including high-performance liquid chromatography (HPLC), 7,8 spectrophotometry, 9–11 chemiluminescence 12–14 and electroanalytical techniques. 15–22 Among the electroanalytical techniques, the adsorptive stripping voltammetry (AdSV) technique is widely used for the detection and quantification of a wide range of analytes and has important advantages, including simplicity, rapid analysis, high sensitivity, a low detection limit, and a low cost. 23,24 The procedure involves two steps: i) accumulation or preconcentration of the analyte at the electrode surface and ii) stripping of the accumulated analyte from the electrode surface by using a potential sweep. 19 In the past, conventional working electrodes, such as graphite electrodes, 25 porous carbon electrodes, 26 carbon cement electrodes, 27 carbon paste electrodes, 28 and boron-doped diamond electrodes, 29,30 have been used for hydroquinone determination. Although these electrodes are simple, they have low reproducibility and stability 31 for hydroquinone detection because the redox reaction that occurs at the surface of the electrode usually produces a polymer that adsorbs on the surface of the electrode, resulting in a fouling effect. 31
Hence, it is necessary to reduce the fouling effect and improve the efficiency of analyte adsorption on an electrode. To eliminate some of the drawbacks that are encountered with a conventional working electrode, modification of the working electrodes with polymers or carbon nanomaterials has been extensively investigated. Various polymers or carbon nanomaterials, including polyaminobenzoic acid, 32 polyglutamic acid, 33 polyglycine, 34 carbon nanotubes, 15 carbon nanofibers, 16 mesoporous carbon 17 and graphene, 18–20 have been used to modify electrodes. Graphene is an interesting material due to its good electrical conductivity and high surface area. Most importantly, graphene can be functionalized with carboxylic acid groups on its surface (Gr-COOH) by chemical methods. Gr-COOH acts as an adsorbent, resulting in hydroquinone being closely adsorbed on the electrode surface. As a result, the detection efficiency increases, leading to high sensitivity and a low limit of detection.
The aim of this research was to develop a simple electrochemical sensor for the determination of hydroquinone at trace levels using a carboxylic acid-functionalized graphene-modified glassy carbon electrode (Gr-COOH/GCE) for adsorptive anodic stripping voltammetry (AdASV). Gr-COOH acts as a hydroquinone adsorbent. The adsorption and electrochemical behavior of hydroquinone on a Gr-COOH/GCE were evaluated. This sensor provides high sensitivity, rapid response and good repeatability, and it successfully detects trace hydroquinone in cosmetic and skin-lightening products.
Experimental
Reagents and materials
Hydroquinone was purchased from VWR International Ltd. (Poole, England). Graphene was obtained from Cheap Tubes (Brattleboro, USA). Sulfuric acid (H2SO4), nitric acid (HNO3) and methanol were purchased from Merck (KGaA, Darmstadt, Germany). Deionized (DI) water was prepared using a deionized water system (18.2 MΩ·cm) (BarnsteadTM Easy PureTM II water purification system, Thermo ScientificTM, USA). All chemicals were of analytical grade. Hydroquinone stock solution was prepared by dissolving hydroquinone in a 60:40 mixture of methanol:water. An electrolyte solution composed of 0.05 mol l−1 H2SO4 in a 60:40 mixture of methanol:water was used to study the electrochemical behavior of hydroquinone on a Gr-COOH/GCE using cyclic voltammetry (CV), and this solution was also used for AdASV. An electrolyte solution composed of 5.0 mmol l−1 K3Fe(CN)6 containing 0.1 mol l−1 KCl was used as a redox marker to study the adsorption behavior of hydroquinone on the modified electrodes using CV.
Instrumentation
The surface morphologies of the GCE and Gr-COOH/GCE were characterized by scanning electron microscopy (SEM) (Quanta 400, FEI, USA). Fourier transform infrared spectroscopy (FT-IR) (Lumos, Bruker, UK) confirmed the functional groups on the surface of the functionalized graphene. All electrochemical measurements were carried out using an Autolab 910 PSTAT mini (Metrohm Autolab B.V., Netherlands) potentiostat with a conventional three-electrode system and a modified (Gr-COOH/GCE) or unmodified glassy carbon electrode (GCE, diameter 3 mm) as the working electrode, a Ag/AgCl electrode as the reference electrode, and a platinum wire as the auxiliary electrode.
Procedures
Preparation of Gr-COOH and electrode modification
Graphene was functionalized with carboxylic acid groups by a carboxylation process with a H2SO4/HNO3 mixture (3:1, 98% and 40%, respectively), filtered and left in a vacuum desiccator until use. 35 The GCE was prepared by polishing with 1.5, 0.5 and 0.05 μm alumina powders, washing via sonication with deionized water for 5 min and drying at 60 °C to obtain a mirror finish on the surface. To fabricate a carboxylic acid-functionalized graphene (Gr-COOH)-modified glassy carbon electrode (GCE) (Gr-COOH/GCE), the surface of a GCE was modified by drop casting 10 μl (20 μg) of Gr-COOH suspension (2.0 mg ml−1). The modified electrode was then allowed to dry in an air oven at 70 °C.
Electrochemical measurements
The electrochemical behavior of hydroquinone on the Gr-COOH/GCE was studied using CV in 0.05 mol l−1 H2SO4 in a 60:40 mixture of methanol:water at different scan rates. The adsorption behavior of hydroquinone on the Gr-COOH/GCE was determined by CV in 5.0 mmol l−1 K3Fe(CN)6 containing 0.1 mol l−1 KCl at a scan rate of 100 mV s−1.
The determination of hydroquinone on the Gr-COOH/GCE was studied by AdASV in 0.05 mol l−1 H2SO4 in a 60:40 mixture of methanol:water. In the preconcentration step, hydroquinone in the solution was adsorbed onto the Gr-COOH/GCE using an appropriate preconcentration potential and time while stirring. For the measuring step, stirring was stopped, and the detection procedure started 10 s later when the solution was motionless. Hydroquinone was stripped from the Gr-COOH/GCE into the solution by applying anodic scans between 0.0 and 1.0 V (vs Ag/AgCl) at a 100 mV s−1 scan rate. The anodic peak current response of hydroquinone was recorded. After each experiment, the Gr-COOH/GCE was cleaned in 0.05 mol l−1 H2SO4 in a 60:40 mixture of methanol:water at a potential of +1.0 V for 60 s to minimize electrode fouling and improve the electrochemical response. Supporting Material Fig. S1 (available online at stacks.iop.org/JES/167/155528/mmedia) shows typical adsorptive anodic stripping voltammograms of five hydroquinone sensor experiments. After cleaning the Gr-COOH/GCE surface with 0.05 mol l−1 H2SO4 in a 60:40 mixture of methanol:water at a potential of +1.0 V for 60 s, the background current returned, ready for a new analytical cycle. The anodic peak current response of hydroquinone of five cycles was recorded. It averages anodic peak current response of 5.0 ± 0.2 μA (%RSD = 3.4). This means that the Gr-COOH/GCE surface can be regenerated, and the interaction of hydroquinone can be removed.
Sample preparation
Skin-lightening products were purchased from different local markets (Hat Yai, Songkhla, Thailand). Then, 0.1 g of each skin-lightening sample was placed into a flask containing 8.0 ml of 0.05 mol l−1 H2SO4 in a 60:40 mixture of methanol:water. The mixture was shaken and left to stand. Then, the solution was filtered through filter paper. The filtered solution was analyzed using the proposed method and a standard UV-derivative spectrophotometry (UVDS) method. In the UV-derivative spectrophotometry (UVDS) method, the filtered solution was mixed with 0.05 mol l−1 H2SO4 and analyzed using an UV spectrophotometer at a wavelength of 290 nm using a quartz cuvette. The calibration curve was obtained from a hydroquinone standard by serial dilutions. The concentration of hydroquinone in each sample can be calculated using the linear regression equation of the standard calibration curve.
Results and Discussion
Characterization of the modified electrodes
The morphologies of the bare GCE, GCE-COOH, Gr/GCE and Gr-COOH/GCE were illustrated using SEM. Figures 1A–1D show SEM images of the bare GCE (A) and GCE-COOH (B), which both exhibited clear GCE surfaces. However, the GCE modified with Gr (C) and Gr-COOH (D) showed the distribution of both materials, which evenly form multiple layers of flakes on the GCE surface. However, these modified electrodes were not different in terms of their shape and size, which indicated that the carboxylation process on the graphene surface did not affect the size and shape of graphene. The functional groups in the structures of Gr and Gr-COOH were investigated by FT-IR spectroscopy. Figures 1E–1F display the FTIR spectra of Gr and Gr-COOH. In the case of Gr (Fig. 1E), the peaks were observed at 1558.55 to 1609.58 and 3030.93 cm−1, which can be attributed to the stretching vibrations of sp2-hybridized C=C (skeletal vibrations from unoxidized graphitic domains) and O–H stretching, respectively. After carboxylic acid functionalization of the surface of graphene with acid, functionalized graphene had abundant oxygen groups, as indicated by the C–O (epoxy) stretching vibrations at 868.90 and 1227 cm−1 and the C–O (alkoxy) stretching vibrations at 1093.55 cm−1, sp2-hybridized C=C at 1621.75 cm−1 and carboxyl groups, which were confirmed by the C–OH deformation at 1404 cm−1, and the clearly increasing O–H stretching vibrations at 3126.40 and 3218.74 cm−1, as shown in Fig. 1F. These results confirmed the successful preparation of graphene containing carboxylic acid groups.
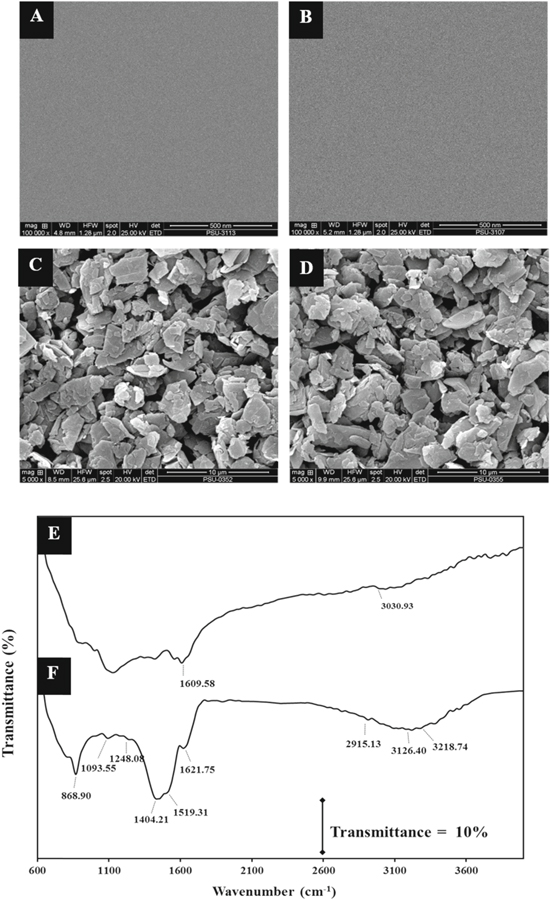
Figure 1. SEM images of the (A) bare GCE, (B) GCE-COOH, (C) Gr/GCE and (D) Gr-COOH/GCE and FT-IR spectra of the (E) Gr/GCE and (F) Gr-COOH/GCE.
Download figure:
Standard image High-resolution imageElectrochemical behavior of hydroquinone on the Gr-COOH/GCE
The electrochemical behavior can generally be determined from the relationship between the peak current and the square root of the scan rate. Therefore, the electrochemical response of 0.20 mmol l−1 hydroquinone in 0.05 mol l−1 H2SO4 in a 60:40 mixture of methanol:water at different scan rates (20–220 mV s−1) on the Gr-COOH/GCE was also studied using CV (Fig. 2A). It should be noted that 0.05 mol l−1 H2SO4 in a 60:40 mixture of methanol:water was used as an electrolyte in this work because it is less prone to surface fouling because polymerization products do not form on the surface due to the solubility of the reaction product during scanning. Another reason is that hydroquinone can be deposited and removed easily from the surface during measurements. 36 The cyclic voltammogram showed a pair of well-defined redox peaks of hydroquinone on the Gr-COOH/GCE at the anodic peak current of 0.48 V and cathodic peak current of 0.36 V (vs Ag/AgCl). The peak-to-peak separation between the anodic and cathodic peaks (ΔEp) is 0.12 V, indicating the reversibility of the electrochemical reaction of hydroquinone on the Gr-COOH/GCE. Moreover, the peak heights of the anodic and cathodic signals are not equal. The peak current of the anodic peaks was relatively higher than the cathodic peaks, implying that the electrochemical deposition rate on the surface of the electrode is much less than the stripping rate. 36 With an increase in the scan rate, the redox peak currents simultaneously increased without a significant change in the peak potential, and both the anodic and cathodic peak currents linearly increased with the square root of the scan rate (Fig. 2B). The regression equations can be expressed as follows:


Figure 2. (A) Cyclic voltammograms of 0.20 mmol l−1 hydroquinone at different scan rates in the range from 20 to 220 mV s−1 on the Gr-COOH/GCE. (B) Linear relationship between the peak current (Ipa and Ipc) and the square root of the scan rate. (C) Comparison of the sensitivities of the GCE, GCE-COOH, Gr/GCE, and Gr-COOH/GCE in the presence of 5.0 to 40.0 μmol l−1 hydroquinone in 0.05 mol l−1 H2SO4 in a 60:40 mixture of methanol:water. (D) EIS results for GCE, GCE-COOH, Gr/GCE, and Gr-COOH/GCE recorded in 5.0 mM [Fe (CN)6] 3−/[Fe(CN)6] containing 0.1 M KCl (EIS conditions; initial frequency: 100,000 Hz, final frequency: 0.05 Hz, amplitude: 10 mV and the number of frequency: 50).
Download figure:
Standard image High-resolution imageAccording to the above equations, the electrochemical behavior of hydroquinone on the Gr-COOH/GCE is a diffusion-controlled electrochemical process. This is in agreement with other reports. 37 The sensitivity (slope of the calibration plot of the oxidation peak current and hydroquinone concentration from 5.0 to 40.0 μmol l−1 by using adsorptive stripping voltammetry) was measured using different electrodes (Fig. 2C). As expected, the sensitivity of the Gr-COOH/GCE was 10, 7 and 3 times higher than those of the bare GCE, GCE-COOH, and Gr/GCE, respectively. These results suggested that the Gr-COOH/GCE exhibits good electrochemical oxidation behavior. Moreover, the electrochemical behaviors of bare GCE, GCE-COOH, Gr/GCE and Gr-COOH/GCE were studied using electrochemical impedance spectroscopy (EIS) in 5.0 mM [Fe (CN)6]3−/[Fe(CN)6]4− containing 0.1 M KCl (Fig. 2D). Charge-transfer resistance (Rct) is determined from the diameter of the semicircle in a Nyquist plot and is 425 Ω for GCE and 280 Ω for GCE-COOH. The results demonstrate that GCE-COOH has much higher conductivity that GCE. For Gr/GCE and Gr-COOH/GCE, no semicircle pattern, but rather a straight line is observed (Inset Fig. 2D), implying the smaller electron transfer resistance of Gr/GCE and Gr-COOH/GCE. However, the straight-line Gr-COOH/GCE is larger than Gr/GCE due to its higher conductivity. These results indicated that Gr-COOH/GCE leads to increasing the sensor's charge transfer rate ability. Moreover, hydroquinone can adsorb at the surface of the Gr-COOH/GCE resulting in an increased anodic peak current by adsorptive stripping voltammetry.
Adsorption behavior of hydroquinone on the modified electrodes
To examine the adsorption behavior of 40.0 μmol l−1 hydroquinone on the bare GCE and Gr-COOH/GCE, CV was used, and all electrodes were scanned in 5.0 mmol l−1 K3Fe(CN)6 containing 0.1 mol l−1 KCl as a redox marker at a scan rate of 100 mV s−1. Figure 3A shows the adsorption behavior of hydroquinone on the GCE. No change was observed after the accumulation of 40.0 μmol l−1 hydroquinone, which indicated that hydroquinone cannot be adsorbed by the bare electrode surface. However, the redox peak current of K3Fe(CN)6 sharply increased with the Gr-COOH/GCE compared to the bare GCE and demonstrated better electron transfer with the Gr-COOH-modified GCE surface (Fig. 3B). Moreover, after hydroquinone accumulated on the Gr-COOH/GCE, the redox peak current decreased (Fig. 3B). This may be caused by the adsorption of hydroquinone on the Gr-COOH/GCE surface (Fig. 3B). This result demonstrated that hydroquinone could be adsorbed onto the Gr-COOH/GCE surface. It should be noted that after the accumulation of 40.0 μmol l−1 hydroquinone on the bare GCE (Fig. 3A) and Gr-COOH/GCE (Fig. 3B), the redox peak current of K3Fe(CN)6 was obtained, while the redox peak current of hydroquinone was not observed. Since this study used 0.1 mol l−1 KCl as the supporting electrolyte in the electrochemical cell. The redox peak current of hydroquinone can be obtained after the accumulation of 40.0 mmol l−1 hydroquinone on the bare GCE (Supporting Material Fig. S2A) and Gr-COOH/GCE (Supporting Material Fig. S2B).

Figure 3. Cyclic voltammograms in 5.0 mmol l−1 K3Fe(CN)6 containing 0.1 mol l−1 KCl on bare GCE (A) and Gr-COOH/GCE (B).
Download figure:
Standard image High-resolution imageOptimization
To obtain good hydroquinone adsorption on the surface of the Gr-COOH/GCE, the fabrication and operational conditions for adsorptive anodic stripping voltammetry were optimized with standard hydroquinone solutions with concentrations in the range of 5.0–40.0 μmol l−1 in 0.05 mol l−1 H2SO4 in a 60:40 mixture of methanol:water. Each condition that resulted in the highest sensitivity was selected as the optimal condition.
Optimization of the sensor fabrication
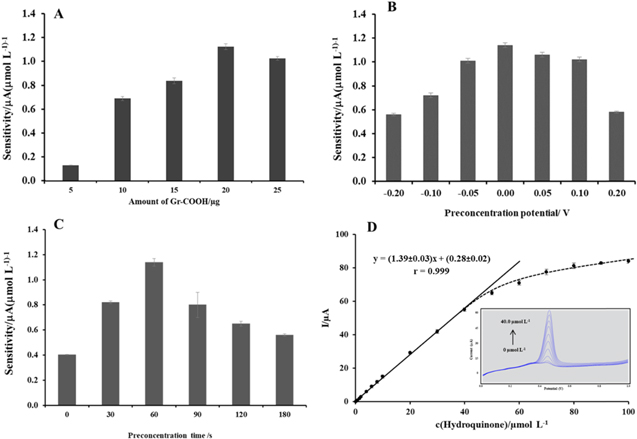
Effect of the amount of Gr-COOH on the GCE.—The hydroquinone detection sensitivity depends on the amount of Gr-COOH on the electrode surface. Hence, the effect of the amount of the Gr-COOH suspension used on the modified GCE was tested in the range of 5–25 μg (Fig. 4A). The results show that the sensitivity increased as the amount of Gr-COOH increased from 5 to 20 μg and then decreased for amounts greater than 20 μg. This increase in sensitivity with increasing amounts of Gr-COOH is likely due to the adsorptive area on the electrode surface increasing. However, with more Gr-COOH, the sensitivity decreases. This phenomenon can be explained by the thickness of the Gr-COOH coverage on the GCE. At an amount of Gr-COOH greater than 20 μg, the lower sensitivity could result from the reduction or blockage of hydroquinone spreading at the electrode surface due to the thicker layer of Gr-COOH on the GCE. 38 Therefore, 20 μg of Gr-COOH was used to modify the electrode surface.
Figure 4. Effect of the amount of Gr-COOH (A), preconcentration potential (B) and preconcentration time (C) on the sensitivity of the Gr-COOH/GCE in the presence of 5.0 to 40.0 μmol l−1 hydroquinone in 0.05 mol l−1 H2SO4 in a 60:40 mixture of methanol:water. Calibration curve of the current response and hydroquinone concentration in the range of 0.10 to 100 μmol l−1 (D). Inset: adsorptive stripping voltammograms were recorded for hydroquinone concentrations from 0 to 40.0 μmol l−1.
Download figure:
Standard image High-resolution image
Optimization of operational detection
A preconcentration step is needed for adsorption to occur between hydroquinone and the Gr-COOH/GCE and is crucial for adsorptive stripping voltammetry detection. Hence, the effects of the preconcentration potential and time on the sensitivity were investigated.
Effect of the preconcentration potential.—The effect of the preconcentration potential on the hydroquinone determination sensitivity was evaluated in the range of −0.20 V to 0.20 V using a preconcentration time of 60 s. As shown in Fig. 4B, the sensitivity linearly increased as the potential increased from −0.20 to 0.00 V, and above 0.00 V, the sensitivity gradually decreased. Thus, 0.00 V was chosen as the preconcentration potential that provided the highest sensitivity.
Effect of the preconcentration time.—The effect of the preconcentration time on the sensitivity was also examined. Figure 4C shows that the sensitivity linearly increased as the preconcentration time increased from 0 to 60 s, and for more than 60 s, the sensitivity gradually decreased. As expected for adsorption processes, the determination sensitivity was limited by the saturation of the electrode surface with hydroquinone. Thus, 60 s was used as the accumulation time due to this time offering good sensitivity and a short analysis time.
Analytical performance of the Gr-COOH/GCE
Linearity, limit of detection and limit of quantification
Under the optimum conditions, hydroquinone determination was performed by adsorptive stripping voltammetry. Figure 4D depicts the adsorptive stripping voltammograms for different concentrations of hydroquinone. The calibration plot of the current response and the hydroquinone concentration showed a good linear relationship in the range from 0.1 to 40.0 μmol l−1. The linear regression equation was Ipa (μA) = (1.39 ± 0.03)c (μmol l−1) + (0.28 ± 0.02) (r = 0.999) (Fig. 4D). It should be noted that at high concentrations (more than 40.0 μmol l−1), hydroquinone is adsorbed and forms a multilayer on the electrode surface. This phenomenon of electrode fouling can severely affect the analytical performance in terms of linearity. The limit of detection (LOD) and limit of quantification (LOQ) were 0.04 μmol l−1 and 0.1 μmol l−1. The LOD and LOQ were calculated using the following equations, respectively: LOD = 3Sa/b and LOQ = 10Sa/b, where Sa is the standard deviation of the intercept and b is the slope of the calibration curve. As shown in Table I, the analytical performance of the Gr-COOH/GCE was compared with those reported for modified electrodes based on other carbon materials, such as CNTs, graphene and metal nanoparticles, for the electrochemical determination and quantification of hydroquinone. The results indicated that the proposed sensor has a low detection limit, a wide linear range, and high sensitivity for the detection of hydroquinone.
Table I. Comparison of different electrochemical sensors for hydroquinone determination.
| Electrode | Technique | Sensitivity (μA/μmol l−1) | Linear range (μmol l−1) | Detection limit (μmol l−1) | Sample | References |
|---|---|---|---|---|---|---|
| a)NiO/MWCNT/GCE | n)DPV | — | 7.4–56 | 0.039 | — | 39 |
| b)Fe2O3/CNT/FTO | DPV | 1.24 | 1–260 | 0.5 | Tap water | 40 |
| c)Fe3O4-APTES-GO/GCE | o)Amp | 0.0018 | 3–137 | 1.1 | Tap water | 4 |
| d)MWCNT/PDA/AuNP/GCE | DPV | 3.625 | 0.1–10 | 0.04 | Tap water, Lake water | 41 |
| e)Au-PdNF/rGO/GCE | DPV | 0.0109 | 1.6–100 | 0.5 | Tap water, Lake water, River water | 42 |
| f)Meso-Co3O4/GCE | DPV | 0.05 | 1–500 | 0.1 | Tap water | 43 |
| g)P-rGO/GCE | DPV | — | 5–90 | 0.08 | Tap water | 44 |
| h)CNNS-CNT/GCE | DPV | 0.0386 | 1–250 | 0.13 | Tap water | 45 |
| i)RGO–MWNT/GCE | DPV | 0.19 | 8–391 | 2.6 | River water | 46 |
| j)BG/GCE | DPV | 1.3082 | 5–100 | 0.3 | Tap water | 47 |
| k)GMC/GCE | DPV | 1.091 | 2.0–50 | 0.37 | — | 48 |
| l)VOTPRu-GCE | DPV | 0.499 | 2–38 | 0.5 | — | 49 |
| Activated GCE | DPV | — | 0.5–200 | 0.16 | Tap water | 50 |
| Electrochemically pretreated GC | p)AdSV | — | 4.5–36.3 | 0.45 | Waste photographic developer and cream | 36 |
| m)NSC/CPE | AdSV | 0.03 | 0.01–700 | 0.01 | Cosmetic | 51 |
| Gr-COOH/GCE | AdSV | 1.39 | 0.1–40 | 0.04 | Whitening cosmetics | This work |
a)NiO/MWCNT/GCE: multiwalled carbon nanotube/nickel oxide nanoparticle-modified glassy carbon electrode, b)Fe2O3/CNT/FTO: Fe2O3 nanoparticles on a single walled carbon nanotube-modified FTO electrode, c)Fe3O4-APTES-GO/GCE: Fe3O4 functionalized graphene oxide-gold nanoparticle-modified glassy carbon electrode, d)MWCNT/PDA/AuNP/GCE: multiwalled carbon nanotube/polydopamine/gold nanoparticle-modified glassy carbon electrode, e)Au-PdNF/rGO/GCE: gold-palladium nanoflower/reduced graphene oxide-modified glassy carbon electrode, f)Meso-Co3O4/GCE: mesoporous cobalto-cobaltic oxide-modified glassy carbon electrode, g)P-rGO/GCE: porous reduced graphene oxide-modified glassy carbon electrode, h)CNNS-CNT/GCE: carbon nitride nanosheets–carbon nanotube-modified glassy carbon electrode, i)RGO–MWNT/GCE: reduced graphene oxide and multiwalled carbon nanotube hybrid material-modified glassy carbon electrode, j)BG/GCE: boron-doped graphene-modified glassy carbon electrode, k)GMC/GCE: graphitic mesoporous carbon-modified glassy carbon electrode, l)VOTPRu-GCE: tetraruthenated oxovanadium porphyrin-modified glassy carbon electrode, m)NSC/CPE: nano-sepiolite clay modified on carbon paste electrode, n)DPV: differential pulse voltammetry, o)Amp; amperometry, p)AdSV: adsorptive stripping voltammetry.
Repeatability
The repeatability of the Gr-COOH/GCE preparation was examined by comparing the sensitivities of six electrodes prepared at different times. With each electrode, three repeated measurements of each concentration (standard hydroquinone solutions with concentrations between 5.0 and 40.0 μmol l−1, (n = 3)) were performed. The sensitivities of the six electrodes were 1.36, 1.30, 1.36, 1.37, 1.33 and 1.28. The results showed that the six electrodes had no significant differences in sensitivity (P > 0.05), which confirms that the electrode preparation method has good repeatability.
Interferences
To evaluate the selectivity of the proposed sensor, the influence of several organic and inorganic compounds was investigated. The effects of different concentrations of phenol, 2-nitrophenol, glucose, Ca2+, Mg2+, Zn2+, Fe2+, K+, Na+, Cl−, SO4 2−, CO3 2− and NO3− on the anodic peak current response of 40.0 μmol l−1 hydroquinone were evaluated (Supporting Material Table SI). It should be noted that at low pH (electrolyte solution; 0.05 mol l−1 H2SO4 in a 60:40 mixture of methanol:water), the forms of SO4 2−, CO3 2−, and NO3 − should be H2SO4 and SO4 2−, H2CO3 and CO3 2−, and HNO3 and NO3 −, respectively. The tolerance limit of the interfering species was evaluated from the highest concentration of each species that affected the current response of hydroquinone detection and produced a %RSD in excess of ±5.0%. The results showed that 100-fold concentrations of glucose, Ca2+, Mg2+, Zn2+, Fe2+, K+, Na+, Cl−, SO4 2−, CO3 2− and NO3− as well as 50-fold concentrations of phenol and 2-nitrophenol caused variations in the anodic peak current response of less than ±5.0%. These results indicated that these interfering species do not interfere with the determination of hydroquinone in the mixture solution.
Accuracy and precision
To evaluate the accuracy and precision of the developed method, the intraday and interday accuracy and precision were determined. The precision and accuracy were expressed as the percentage of the relative standard deviation (%RSD, n = 5) and percentage of the recovery (n = 5), respectively. For determining the accuracy and precision, four concentrations of hydroquinone were added to samples and analyzed by AdASV. The intraday and interday accuracy and precision of the five electrodes tests are shown in Table II. The accuracy of the intraday and interday tests and the % recovery ranged from 97 ± 3 to 103 ± 3% and from 96 ± 5 to 105 ± 7%, respectively. The %RSDs of the intraday and interday tests were found to be within the ranges of 2.6%–4.0% and 4.3%–6.4%, respectively. These values were also acceptable according to AOAC guidelines. The RSDs for all concentrations were less than 6.4%; 7.3% is acceptable for 10.0 mg l−1. The recovery values were all acceptable for analysis in the concentration range of 80%–110% with spiked concentrations of 0.5, 1.0, 5.0 and 10.0 μmol l−1. 52 Thus, this proposed method can be used to accurately and precisely detect hydroquinone in skin-lightening products.
Table II. Intraday and interday measurements of hydroquinone in skin-lightening products.
| Intraday | Interday | |||
|---|---|---|---|---|
| Added hydroquinone (μmol l−1) | % Recovery (mean ± SD, n = 5) | RSD (%) | % Recovery (mean ± SD, n = 5) | RSD (%) |
| 0.5 | 98 ± 4 | 4.0 | 105 ± 7 | 6.4 |
| 1.0 | 103 ± 4 | 3.4 | 98 ± 6 | 5.8 |
| 5.0 | 97 ± 3 | 3.3 | 96 ± 5 | 4.8 |
| 10.0 | 103 ± 3 | 2.6 | 103 ± 4 | 4.3 |
Real sample analysis
To test the performance in practical application, the proposed sensor was applied for the determination of hydroquinone in pharmaceutical products. The matrix effect of the skin-lightening sample was first studied under optimized conditions by comparing the slopes of the calibration curves obtained for the standard hydroquinone and spiked samples. There was no significant difference between the two slopes (P > 0.05), indicating no matrix effect. This implied that the concentration of hydroquinone in skin-lightening samples could be calculated using the linear regression equation of the standard calibration curve. The hydroquinone concentrations detected in fifteen samples using fifteen electrodes by AdASV were compared to the values detected by UV-derivative spectrophotometry (Table III). UV spectrums of skin-lightening samples 1, 2, 3, and 4 are shown in Supporting Material Fig. S3. Using the Wilcoxon Singed-Rank test, the concentrations of hydroquinone detected by the proposed sensor and by UV-derivative spectrophotometry showed no significant differences (P > 0.05), indicating that the developed method can be successfully applied for the determination of hydroquinone in skin-lightening products.
Table III. Determination of hydroquinone in skin-lightening products by Gr-COOH/GCE and UV-derivative spectrophotometry (n = 5).
| Concentration of hydroquinone (%w/w) | ||
|---|---|---|
| Sample | Proposed method | UV-derivative spectrophotometry |
| S1 | ND | ND |
| S2 | ND | ND |
| S3 | ND | ND |
| S4 | 1.24 ± 0.03 | 1.27 ± 0.05 |
| S5 | ND | ND |
| S6 | 1.88 ± 0.04 | 1.84 ± 0.06 |
| S7 | 1.34 ± 0.02 | 1.31 ± 0.05 |
| S8 | 0.84 ± 0.03 | 0.87 ± 0.04 |
| S9 | 1.47 ± 0.04 | 1.49 ± 0.04 |
| S10 | 0.46 ± 0.03 | 0.43 ± 0.04 |
| S11 | ND | ND |
| S12 | ND | ND |
| S13 | ND | ND |
| S14 | ND | ND |
| S15 | ND | ND |
N.D. = Not detected.
Conclusions
In summary, a simple electrochemical sensor was developed for the determination of hydroquinone in skin-lightening products using AdASV with a glassy carbon electrode modified with Gr-COOH. The Gr-COOH/GCE exhibited good electrochemical oxidation behavior of hydroquinone with sensitivities 10, 7, and 3 times higher than those of the bare GCE, GCE-COOH, and Gr/GCE, respectively. Under the optimum conditions, the analytical performance of the proposed method was validated and exhibited a wide linear range (0.1–40.0 μmol l−1), high sensitivity (19.86 μA (μmol l−1)−1 cm−2), low limit of detection (0.04 μmol l−1), good selectivity, high accuracy and high precision. This proposed sensor was successfully applied for the determination of hydroquinone in skin-lightening products. In further applications, this proposed sensor can be applied to detect hydroquinone in other pharmaceutical products.
Acknowledgments
This research was supported by the Higher Education Research Promotion and National Research University Project of Thailand (HERP-NRU, Contract No. SCI570584S) and the Center of Excellence for Innovation in Chemistry (PERCH-CIC). Partial support was also provided by the Center of Excellence for Trace Analysis and Biosensor (TAB-CoE), Graduate School and Faculty of Science, Prince of Songkla University, Hat Yai, Thailand. Financial support for Kiattisak Promsuwan from the Royal Golden Jubilee PhD program (RGJ) was provided by the Thailand Research Fund (TRF) (grant no. PHD/0212/2559).