

Abstract
Electrodeposited conductive copolymer films with predictable relative properties (quantities of functional groups for further modification and capacitance) are of interest in sensors, organic electronic materials and energy applications. Potentiodynamic copolymerization of films in aqueous solutions of two different thiophene derivatives, (2,3-dihydrothieno[3,4-b]dioxin-2-yl)methanol (1) and 4-((2,3-dihydrothieno[3,4-b][1,4]dioxin-2-yl)-methoxy)-4-oxobutanoic acid (2), containing 0.02 M total monomer (0, 25, 34, 50, 66, 75, 100 mol% 2), 0.05 M sodium dodecyl sulfate, and 0.1 M LiClO4, on gold microelectrodes in an array was investigated. Decreasing monomer deposited (m) from 0 to 100 mol% 2 is attributed to a decreasing pH that inhibits electropolymerization. Molar ratios of 1 and 2 in the films, determined by micro-attenuated total reflectance Fourier transform infrared spectroscopy and X-ray photoelectron spectroscopy, tracks closely with the ratio in the deposition solutions. Capacitances measured from cyclic voltammetry in aqueous buffer and electron transfer of ferrocyanide at the films are unaffected by copolymer composition, except for the 100 mol% 2 case. Ratios of reverse-to-forward faradaic peak currents suggest that films with high content of 1 expand in the anodic form and contract in the cathodic form and vice versa for films with high content of 2, where anions and cations dominate counterion transport from solution, respectively.
Export citation and abstract BibTeX RIS
The original driving force behind the development of conducting polymers (CPs) was the need by the electronics industry to have a transparent, thermally stable, vacuum moldable, and intrinsically conductive material as an antistatic coating. 1 Since then their development has grown to many applications including energy storage and environmental remediation, 2 biomedical, 3–10 electrochromic materials, 11 molecular electronics, 12 chemical sensors, 13–16 and electrochemical biosensors. 17–20 This diversity of applications is possible because by changing substituents on the monomers and polymers through organic synthesis, the properties can be altered.
Polythiophenes (PTs) are a unique subset of intrinsic CPs due to their ability to be electrochemically generated, stable in undoped states, mechanically stable, and structurally modifiable giving way to new and advantageous chemical characteristics. 21,22 The electrochemical generation of PTs is strongly dependent upon solvent, electrolyte, electrochemical technique used, electrode material and geometry, and local environment (temperature and atmosphere). 23 PTs have been applied most extensively in amperometric sensing, 24–26 optoelectronics, 27,28 and energy storage. 29
To maintain linear polymerization, high conductivity, and stability, researchers at Bayer AG in the mid to late 1980s developed the monomer 3,4-ethylenedioxythiophene (EDOT), (Fig. 1) to form poly(3,4-ethylenedioxythiophene) (PEDOT) upon chemical or electrochemical oxidation. Initial insolubility in aqueous conditions was overcome by pairing with the polyelectrolyte poly(styrenesulfonate) (PSS) as the counterion. This resulted in very stable and conductive films in an aqueous environment. The stable and transparent (in the oxidized state) polymer was initially used as an antistatic coating for photographic film. Aqueous polymerization of PEDOT can be accomplished using a microemulsion technique by adding a solubilizer, such as sodium dodecyl sulfate (SDS) or beta-cyclodextrin, sulfated sodium (β-CDSS), to aqueous solutions to dissolve the insoluble monomer. 1,30–32
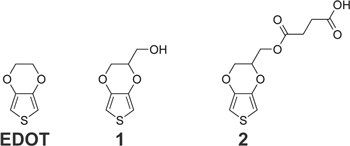
Figure 1. Molecular structures of monomers relevant to this work. EDOT, widely reported in the literature, shares the same base structure as 1 and 2. Monomer 1 is commercially available. Monomer 2 was synthesized from 1.
Download figure:
Standard image High-resolution imageTo expand the chemical properties of PEDOT, new monomers were synthesized, 1,33 one of which includes a hydroxymethyl group on the base structure of EDOT, (2,3-dihydrothieno[3,4-b]dioxin-2-yl)methanol (1) (Fig. 1) and is commercially available. 34,35 The addition of the hydroxymethyl group improves solubility in aqueous solutions, does not interfere with the conductivity along the polymer backbone, and does not shift the oxidation potential much from that of EDOT. It also allows for further functionalization, change of wettability, 36 and alteration of non-specific adsorption. 37–39
Carboxylic acid functional groups tethered to EDOT are desirable because of their known reactivity, established conjugation protocols and have been synthesized. 40 These derivatives have been used in DNA detection, 41 cell engineering and capturing, 9,42 glucose sensing, 43 nanomaterial synthesis, 44 surface engineering, 45,46 and chemical sensing. 47 A spacer group is needed between the π-conjugated backbone of the CP and the desired functional group. Any functional group used should not oxidize at potentials lower than the monomer itself. These rules serve to avoid disruptions in conductivity, steric effects that could inhibit successful polymerization, and undesired oxidation of the functional group. 35
An EDOT carboxylic acid derivative, used in the studies here, is 4-((2,3-dihydrothieno[3,4-b][1,4]dioxin-2-yl)-methoxy)-4-oxobutanoic acid (2) (Fig. 1). 48 This specific derivative is easy to synthesize from available reagents and stable when kept refrigerated and dry. The carboxylic acid group does not affect the overall conductivity of the polymer backbone and the additional ester carbonyl can be used for its detection (e.g. by infrared spectroscopy and X-ray photoelectron spectroscopy (XPS)) in a copolymer film. It has been used in a range of applications, including oligonucleotide detection, 48 biocompatible nanointerfaces, 10 bactericide detection, 49 and catechol and bisphenol A detection. 50,51 The listed applications mostly involve copolymerization of monomer 2 with EDOT or film formation from monomer 2 alone. However, monomer 2 can be copolymerized with other EDOT derivatives to produce copolymer films with even greater functionality.
Although monomers 1 and 2 have been copolymerized with other monomers, they have not been copolymerized together. Monomer 1 has been copolymerized with other carboxylic acid derivatives by a microemulsion technique using a 0.1 M SDS aqueous solution. Electrochemical and chemical oxidative polymerizations were performed to generate ultra-smooth copolymers with low cytotoxicity as a platform for biosensors. 52 Adjusting the pH and applied voltage to copolymerizations of monomer 1 derivatives, containing carboxylic acid and dodecyl groups, allowed for surfaces with switchable wettability. 53,54 Immediately after electropolymerization, all copolymers were found to be superhydrophobic, but upon electrochemical reduction, the copolymers with molar ratios between 25–75 mol% of a carboxylic acid monomer in the deposition solution, were found to have switched to being hydrophilic (contact angle < 90°). Despite these two examples, and many others not discussed here, demonstrating an effective change of copolymers' overall properties by varying substituent functional groups, there has been less consideration given to quantifying and comparing the relative amount of each respective monomer in the copolymer film compared to that in the deposition solution.
There are only a few systematic studies that attempt to quantify the molar ratio between monomers in the resulting CP compared to that in the deposition solution. An understanding of the relationship would allow a controlled synthesis of CP films for a variety of applications. Doherty et al. used spectroelectrochemistry to determine relative reactivity ratios of the copolymers of EDOT and monomer 1 based on their concentration in the deposition solution and their measured molar absorptivity. 55 They were able to calculate significantly different reactivity ratios for the monomers and thus demonstrate that monomer 1 was preferentially incorporated in the copolymer despite the solution ratio being 50:50 between the two monomers. 55,56 A following paper by researchers of the same group found that for copolymers of monomer 1 and 6-(2,3-dihydrothieno[3,4-b]-1,4-dioxin-2-yl methoxy)hexanoic acid (a derivative of monomer 1 with a 5 carbon chain terminated by a carboxylic acid) deposited in acetonitrile at a 50:50 molar ratio incorporated more of the acidic derivative into the copolymer. 57 They followed monomer concentrations in solution both before and after copolymerization. They also used XPS and Fourier transform infrared (FTIR) spectroscopy of the films for further characterization. 57 There are some details to note regarding their reported interactions of monomers during electrochemical copolymerization and how the resulting copolymer compositions compare to the monomer compositions in solution. The first is that the electropolymerization was carried out in polar solvents (acetonitrile and a 10% v/v aqueous methanol) without the addition of surfactants. The second is that the depletion studies involved solutions of low concentrations of monomers (1 × 10⁻³–5 × 10⁻⁵ M) for deposition onto large electrodes (12.9–0.78 cm2).
Mixed hydroxyl and carboxylic acid groups on surfaces of other types of materials (e.g., self-assembled monolayers) have demonstrated unique properties for tethering molecules of interest, as well as controlling wettability and non-specific adsorption for different applications. Here we report a systematic study of the co-electropolymerization of hydroxyl and carboxylic acid-modified monomers 1 and 2 to determine how solution composition of the two monomers correlates to the film composition and resulting electrochemical behavior. Unlike prior studies of co-electropolymerization of EDOT and its derivatives, ours were performed in aqueous solutions with SDS as a solubilizer. Also, the microelectrodes allow for deposition without affecting the bulk concentration significantly. The overall electropolymerization strategy is shown in Fig. 2. Microelectrodes were characterized electrochemically before and after electropolymerization in supporting electrolyte and solutions containing an electroactive model compound to measure their charging and electron transfer responses. Measurements including the Eonset , total charge passed during deposition, total amount of monomer deposited, and film densities are presented. The techniques of XPS and micro-attenuated total reflectance FTIR (μATR-FTIR) spectroscopy were used to determine the amount of each monomer incorporated into the copolymer films for comparison to the molar ratios of the monomers in the deposition solutions.

Figure 2. Strategy for electropolymerization of monomers 1 and 2 to form copolymer blends. The deposition solutions studied contained the following monomer 2 compositions: 0, 25, 34, 50, 66, 75, and 100 mol% 2, where mol% 2 = [mol 2/(mol 1 + mol 2)] × 100%. The total monomer concentration in the deposition solutions was maintained constant at 0.02 M.
Download figure:
Standard image High-resolution imageExperimental
Chemicals and materials
All chemicals were reagent grade and used as received unless otherwise specified. The microelectrode arrays were fabricated by standard photolithographic methods on silicon wafers (125 mm diameter, 600–650 μm thick, with a 2 μm layer of thermally grown oxide on the surface) acquired from Silicon Quest International (Santa Clara, CA, USA). A chromium-plated tungsten rod, gold coin (Canadian Maple Leaf, 99.99%), and molybdenum boat (Kurt J. Leskar Company, Clairton, PA, USA) were used for thermal vapor deposition of metals using an Auto 306 (BOC Edwards, West Sussex, UK). Positive photoresist (AZ 4330) and developer (AZ 400K) were procured from EMD Performance Materials (Somerville, NJ, USA). Gold etchant (GE8148) was purchased from Transene (Danvers, MA, USA) and chromium etchant CEP-200 was obtained from Microchrome Technology (San Jose, CA, USA). Cyclotene 4024-40 (benzenecyclobutene, BCB), adhesion promoter (AP3000), and developer (DS2100) were used to insulate the chip-based electrode leads and were obtained from Dow Corning Company (Midland, MI, USA). Photoplot masks for metal and insulating layers were purchased from Fine Line Imaging (Colorado Springs, CO, USA). Electrical connection between the chip and potentiostat was made using an edge connector (solder contact, 20/40 position, 0.5 in pitch) from Sullins Electronics Corporation (San Marcos, CA, USA). The chip was kept in contact with the edge connector using a 0.99 mm thick folded plastic shim. Aqueous solutions were prepared using ACS reagent grade water, ASTM Type I, ASTM Type II (H2O) from RICCA Chemical Company (Arlington, TX, USA). Succinic anhydride (SA), 4-(dimethylamino)pyridine (DMAP), triethylamine (Et3N), sodium phosphate dibasic anhydrous, sodium phosphate monobasic anhydrous, and monomer 1 were purchased from Sigma-Aldrich (St. Louis, MO, USA). Sodium dodecyl sulfate (SDS), potassium ferrocyanide trihydrate (K4Fe(CN)6 · 3H2O), and lithium perchlorate (LiClO4) were obtained from Amresco (Solon, OH, USA), J.T. Baker (Phillipsburg, NJ, USA), and Alfa Aesar (Tewksbury, MA, USA), respectively. Concentrated hydrochloric acid (HCl), dichloromethane (DCM), and alumina (Neutral, Brockman Activity I) were purchased from Fisher Scientific (Pittsburg, PA, USA). Sodium chloride (NaCl), magnesium sulfate (MgSO4), and acetonitrile (MeCN) were acquired from EMD Chemicals (Billerica, MA, USA). Deuterated chloroform (CDCl3) was purchased from Cambridge Isotopes Labs (Tewksbury, MA, USA).
Chip design and microelectrode array fabrication
Figure 3 shows design schematics and a fabricated example of the electrode array chip. It is 2.54 cm × 2.54 cm in outer dimensions and has 20 individually-addressable electrodes, 16 of which are microband electrodes within an array. The nominal geometric area of each microelectrode is 2 × 10⁻³ cm2 (2000 μm × 100 μm), and each one is separated from its neighboring electrode(s) by a 100 μm gap. The length of each microelectrode is defined by the edges of the insulating BCB layer. A detailed description of the microelectrode array fabrication can be found in section 1 of the Supporting Information (available online at stacks.iop.org/JES/167/166511/mmedia).
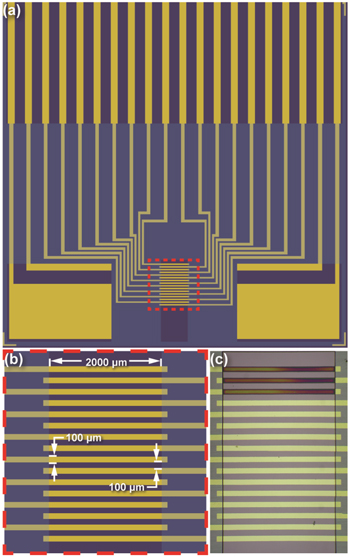
Figure 3. The electrode chip. (a) Design schematic of the entire 2.54 cm × 2.54 cm chip, showing individually-addressable electrodes and their corresponding contact pads (yellow-gold), exposed silicon wafer (deep purple) and the overlying BCB insulating layer (light blue-purple shading). (b) Expanded view of the schematic showing the individually addressable microband electrodes within the array and their corresponding dimensions. The electroactive regions of the microelectrodes are 0.200 cm long as defined by the edges of the BCB, 0.010 cm wide, and separated by 0.010 cm gaps. (c) A micrograph of the fabricated electrode array with polymer films on three of the microelectrodes, deposited from a 50 mol% 2 solution.
Download figure:
Standard image High-resolution imageSynthesis and characterization of monomer 2
SA was used to derivatize monomer 1 with the desired terminal carboxylic acid group to form monomer 2 based on a modified procedure previously reported. 58 DCM was dried over alumina before use. Briefly, 452.7 mg of monomer 1 was dissolved in 25 mL DCM by stirring in a three-neck round-bottom reaction flask under N2. A mixture of 562.7 mg SA, 28.6 mg DMAP, and 0.527 mL Et3N was prepared in 10 mL DCM and stirred for 1 h at room temperature to dissolve, then added dropwise to the reaction flask. The reaction was stirred under N2 overnight. The product was extracted with 10% HCl and rinsed with a saturated NaCl solution until the discarded rinse was the same pH as the saturated NaCl solution. The product was dried over MgSO4 and remaining solvent evaporated under vacuum to yield monomer 2 (669.9 mg, 93.6% yield). To ensure the reaction was successful, characterization of the product, as well as the starting materials, by proton nuclear magnetic resonance spectrometry (1H NMR), attenuated total reflectance Fourier transform infrared spectrometry (ATR-FTIR), and liquid chromatography coupled to electrospray ionization and mass spectrometry (LC-ESI-MS) was completed.
1H NMR (400 MHz, CDCl3): δ 6.37 (2 H, dd, J = 3.6, 3.6 Hz), 4.06 (1 H, dd, J = 11.7, 6.9 Hz), 4.24 (2 H, dd, J = 11.7, 1.9 Hz), 4.30–4.44 (3 H, m), 2.66–2.78 (4 H, m). ATR-FTIR (cm−1): 1735 (νC=Oester), 1699 (νC=Ocarboxylic acid), 1483 (combination of stretching and bending modes of the C=C, C–C, and C–H bonds of thiophene ring), 1174 (νC-O-Cring, νC=Cthiophene), 913 (νC-S-Cthiophene), 750 (δ C-Hthiophene). LC-ESI-MS (m/z): [M + H]+ calcd for C11H12O6S, 273.043, found 273.1. The 1H NMR, ATR-FTIR, and LC-ESI-MS results of the starting materials and products can be found in sections 2, 3, and 4 of the Supporting Information (Figs. S1–S7).
Electrochemical studies
A three-electrode electrochemical cell, platinum flag or wire counter electrode, Ag/AgCl (saturated KCl) reference electrode, CHI 650 A with a picoamp booster and faraday cage (CH Instruments, Austin, TX, USA) were used for all electrochemical procedures. Before the chips were used for any electrochemistry (initial characterization and electropolymerization of films) they were rinsed with H2O, dried with Ar, and cleaned of residual trace organics by oxygen plasma (6.8 W applied to RF coil for 15 min at 60 mtorr, PDC-32G, Harrick Plasma, Ithaca, NY, USA) and stored in H2O until use.
A 0.2 M sodium phosphate buffer, pH 6.5, was prepared by first dissolving 14.24 g sodium phosphate dibasic anhydrous in a 0.5 L H2O volumetric flask. Then 12.04 g sodium phosphate monobasic anhydrous was dissolved in 0.5 L H2O in another volumetric flask. The pH of the sodium phosphate dibasic solution was continuously monitored while enough of the sodium phosphate monobasic solution was added to adjust the pH to 6.5. Electrodes were characterized before (designated as bare gold) and after electropolymerization by CV in two solutions: a 0.2 M sodium phosphate buffer, pH 6.5, and the buffer containing 0.001 M K4Fe(CN)6. Area-normalized capacitance, C, of each electrode was determined from the charging current, ic , measured from the CV response both before and after film modification, using Eq. 1,

where v is the scan rate of the cycle and A is the geometric area of the electrode (metal thickness was assumed to be a negligible contribution to A). The ic of the CV response in the buffer alone was obtained by dividing the current difference between the forward and reverse sweeps at +0.400 V by two. The ic for the buffer containing Fe(CN)6 4− was measured directly from the forward sweep current at 0.000 V to avoid contributions from faradaic current in the return sweep.
To ensure that enough monomer 2 was available for the full set of depositions, a cell (Fig. 4) was designed such that only 0.7 mL was needed and placement of the reference and counter electrodes could be controlled for each deposition. The cell was machined from Delrin® and has two main parts: the bottom bulk of the cell, where mounts for the edge connector and the solution well are located, and the top of the cell, which holds the counter and reference electrodes in place. The top is fixed to the bottom by machine screws. For all electrochemical procedures other than polymer depositions, a small 15 mL glass cell was used.
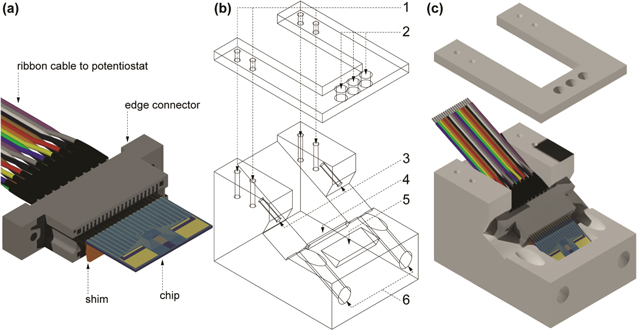
Figure 4. Chip/edge connector assembly and deposition cell schematic. (a) 3D rendering of the edge connector assembly. (b) 2D wireframe projection of deposition cell. (c) 3D rendering of the lid and body of the deposition cell. The edge connector assembly consists of three main parts: the edge connector, chip, and shim. The 20-wire ribbon cable is soldered to contact posts at the rear of the edge connector using a plastic shim (thickness: 0.99 mm). The cell consists of two main parts: the lid (on top) and the body (on bottom). The lid is fixed to the body by four machine screws through the inserts labeled by 1. Three holes, 2, provide options for counter and reference electrode placement. The edge connector is fastened to the body of the cell by screws tightened in two holes, 3. The shim sits in a channel, 4, so that the chip/edge connector assembly lies flat against the cell body. The free end of the chip is immersed into the solution contained in the sample well, 5. Paths, 6, for a screwdriver to fasten the edge connector to the cell body.
Download figure:
Standard image High-resolution imageElectropolymerization
Films were electropolymerized from aqueous solutions containing 0.1 M LiClO4, 0.05 M SDS and a total monomer concentration of 0.02 M. For electropolymerization by CV, the working electrode was cycled from −0.100 to +1.200 V at a scan rate of 0.1 V s−1 for a total of three cycles, with a 2 s quiet time at −0.100 V between each cycle. Each polymer was generated in triplicate by modifying three microband electrodes within the same array on a given chip; each chip was dedicated to a specific mol% 2 of the two monomers. In cases of inadequate polymer adhesion, the surfaces of the working electrodes were refreshed by swabbing the array first with 1 M sodium hydroxide, followed by rinses of ethanol and H2O, and finally dried with Ar. Once the depositions were concluded for a given chip, it was carefully removed from the cell and placed in another cell containing the sodium phosphate buffer and allowed to soak for 5 min. Five sequential CV cycles were then performed from −0.100 to +0.700 V at a scan rate of 0.050 V s−1 to equilibrate the film with the characterization electrolyte and reach a reproducible response, one modified electrode at a time. 59 The chips were subsequently stored under H2O overnight before further characterization. The capacitance of each film was measured and characterized with an electroactive model compound in the same manner as described for electrodes before modification.
Films formed from deposition solutions of high mol% 2 (100, 75, 66) exhibited inconsistent polymer adhesion, which was especially regular for the 100 mol% 2 case. Delamination of the films was sometimes observed during the emersion of the chip from the deposition solution and immersion of the chip into characterization solutions. We addressed this complication to achieve the most reliable understanding of these films by repeating electropolymerization as needed, and in the case of 100 and 66 mol% 2, fresh films were produced for the surface analyses (μATR-FTIR, XPS, and profilometry), separate from films used for electrochemical characterizations. For the case of 100 mol% 2, fresh films were also used for both electrochemical characterizations: in buffer solution with ferrocyanide and buffer alone.
Determination of Eonset
Because there are no resolved oxidation peaks during the electrodeposition cycles, a reproducible method was developed to determine Eonset when monomer oxidation becomes visibly significant over the charging current during the electropolymerization cycles. The average background current, between 0.000 and +0.500 V, was determined and subtracted for each electrodeposition cycle. Then the first derivative was approximated using the software accompanying the CHI 650 A. The local minimum of the first derivative plot corresponding to the inflection point was used to extrapolate a tangent line, with proper slope and position, to locate the potential value at zero current of the deposition voltammogram. The process was only performed for the anodic sweep of each deposition cycle and average values with standard deviation are listed in Table I. Further detail can be found in section 5 of the Supporting Information and a schematic of this process is shown in Fig. S-8.
Table I. Measured pH values of deposition solutions and electropolymerization results.
| Mol% 2 | pH a) | QT (μC) b) | m (nmol) | Eonset b) | ||
|---|---|---|---|---|---|---|
| Cycle 1 (V) | Cycle 2 (V) | Cycle 3 (V) | ||||
| 0 | 5.42 | 310 ± 5 | 1.38 ± 0.02 | 0.946 ± 0.003 | 0.8836 ± 0.0007 | 0.8685 ± 0.0009 |
| 25 | 3.29 | 270 ± 8 | 1.22 ± 0.04 | 0.958 ± 0.001 | 0.8951 ± 0.0003 | 0.886 ± 0.001 |
| 34 | 3.23 | 250 ± 3 | 1.12 ± 0.01 | 0.982 ± 0.003 | 0.9066 ± 0.0004 | 0.8952 ± 0.0008 |
| 50 | 3.14 | 230 ± 3 | 1.04 ± 0.01 | 0.971 ± 0.002 | 0.9121 ± 0.0003 | 0.9063 ± 0.0006 |
| 66 | 3.05 | 210 ± 7 | 0.94 ± 0.03 | 0.983 ± 0.001 | 0.930 ± 0.001 | 0.926 ± 0.002 |
| 75 | 3.01 | 180 ± 16 | 0.82 ± 0.07 | 0.955 ± 0.003 | 0.899 ± 0.001 | 0.889 ± 0.003 |
| 100 | 2.96 | 130 ± 11 c) | 0.60 ± 0.05 c) | 1.03 ± 0.02 c) | 0.97 ± 0.01 c) | 0.969 ± 0.004 c) |
a)pH of solution without monomer was 5.31 (aqueous solution containing 0.05 M SDS and 0.1 M LiClO4). b)Averages ± standard deviation obtained from the different electrodes on the same chip, except for the 100 mol% 2 case. c)Averages ± standard deviation obtained from six different electrodes on the same chip for the 100 mol% 2.
Determination of QT and m for electrodeposited films
The total charge passed (QT ) and total monomer deposited (m) were determined from the electrodeposition voltammograms. Each deposition cycle was separated into forward and reverse sweeps and the average background current, for each sweep, was determined and subtracted as described earlier. The area of the curve to background-subtracted zero current was integrated for both segments of each cycle and added. Because the anodic current is defined as negative in this work, the absolute value was the amount of charge passed for that cycle. The process was repeated for the subsequent cycles and the sum of the charge passed for each of the cycles is QT , and given by Eq. 2,

where Q1 , Q2 , and Q3 are the average charge passed for the first, second, and third deposition cycles, respectively, across the modified electrodes of a given mol% 2. The values of QT , with standard deviation, for each of the seven different films, are listed in Table I. The total number of moles that were electrodeposited, m, was calculated directly from QT , using Eq. 3,

where n is the number of electrons per monomer deposited, assumed to be 2.3, 40 and F is the Faraday constant. These values are reported in Table I.
Profilometry
Profilometry of each film was carried out on a Dektak 3030 surface profiling measuring system (Sloan Technology Corporation, Santa Barbra, CA, USA). Each array was scanned with a medium speed and stylus force setting of 20 mg, which correlates to a force of 0.2 mN. To ensure a representative average of the films' profile, each electrode was scanned across its width three times: once near each of the two ends of the microband and once in the middle, about halfway between the two ends. The printout of each measurement was scanned as digital images and digitized with GetData Graph Digitizer software (www.getdata-graph-digitizer.com) to generate tabulated data for analysis. A line was drawn from the base of one side to the base on the other side of each electrode profile, above which the cross-sectional area was determined. To obtain the average cross-sectional area of a given type of film, the average cross-sectional area of the unmodified electrodes on the same chip was subtracted from the average cross-sectional area of the modified electrodes. For the chip with the 0 mol% 2 films, the measurement was completed using six scans, instead of three, because of larger distances between modified electrodes. Also, difficulty obtaining a suitable background resulted in only two 0 mol% 2 modified electrodes were used in the final calculation of the average cross-sectional area. A schematic showing the order and direction of measurements is shown in Fig. S-9 of section 6 of the Supporting Information.
Characterization by μATR-FTIR
The composition of the modified microelectrodes was analyzed by μATR-FTIR sampling using a Vertex 70 v FTIR spectrometer equipped with a HYPERION 2000 infrared microscope (Bruker Optics, Billerica, MA, USA). The spectrometer bench was maintained under vacuum, and radiation from the interferometer was passed to the microscope through a KBr window. The microscope was kept under a dry N2 gas purge and secured to the spectrometer bench through a purge tube. All samples were allowed to dry under ambient conditions before analysis. Electrodeposited polymer on the 100 μm wide microelectrodes was analyzed using the diamond ATR probe (32 μm diameter) on the microscope objective (20×, 0.6 NA). The probe sampled within the center region of each electrode. The knife-edge apertures on the microscope were set to isolate the electrode and ensure against sampling regions on the chip beyond the electrode of interest. The probe-electrode force was adjusted as recommended for polymers (∼0.5 N). The microscope was operated with a mid-range liquid nitrogen cooled mercury-cadmium-telluride (MCT) detector. Immediately prior to measurements on the modified electrodes, the ATR crystal was cleaned by gently passing ethanol-soaked lens tissue over the probe surface, and a background spectrum was collected with the probe suspended in air. All interferograms were recorded at 4 cm−1 resolution with 64 scans averaged and processed using the Blackman-Harris three-term apodization function before Fourier transformation. Spectra are displayed in units of pATR,

where Isample and Ibackground represent the sample and background single beam spectra, respectively.
Characterization by XPS
XPS measurements were carried out on a Kratos Axis Ultra DLD spectrometer (Kratos Analytical Ltd., Manchester, UK) using a monochromated aluminum source (Al Kα 1486.6 eV). An X-ray gun with an emission current of 0.01 A, anode voltage of 15 kV, and a bias voltage of 125 V was used. The aperture size and iris position were both 110 μm centered on the 100 μm wide modified microelectrodes. High-resolution scans of the C(1s) core electrons were obtained using a pass energy of 40 eV and step size of 0.1 eV. Copper tape was used to short the contact pads of the chip and ground it to the sample stage. A charge neutralizer gun was used to compensate for any charge accumulation during the measurement. All XPS data were analyzed, deconvoluted, and fitted using CasaXPS software (Casa Software, Ltd., Teignmouth, UK). A linear background and line shapes of a Gaussian-Lorentzian sum form were used. Constraints were forced on the peak area, full-width at half maximum (FWHM), and binding energy position of the synthetic components. A more detailed explanation of the deconvolution and fitting process can be found in section 7 of the Supporting Information.
Results and Discussion
Electropolymerization of monomers
Electrodeposition was performed from aqueous solutions containing 0.05 M SDS, 0.1 M LiClO4, and monomer 1 and (or) 2 at a total concentration of 0.02 M. The mol% 2 represents the molar ratio of monomer 2 to all monomers in the deposition solution, given by Eq. 5.

Figures 5a through 5g present the electropolymerization voltammograms obtained at 0.1 V s−1 for each mol% 2. Each of the three consecutive cycles (1st, 2nd, 3rd) in the figures is the average current response for that cycle number from three electrodes. Error bars that represent one standard deviation are reported at ten selected potentials in both the forward and reverse sweeps. In all but one case (100 mol% 2), the average voltammograms were from a single set of electrodes (N = 3). The 100 mol% 2 results are from two sets of electrodes (N = 6). Figure 3c shows a micrograph of an array with polymer films on three electrodes, after the three cycles of deposition from the 50 mol% 2 solution. The films change color from dark blue or purple to colorless, as they transition from reduced to oxidized states. Additional color is caused by the diffraction of white light that varies with film thickness. All deposition voltammograms are shown in Fig. S-10, and micrographs for all films are shown in Fig. S-11 in sections 8 and 9 of the Supporting Information, respectively. The general shapes of the CV responses for electrodeposition from pure and comonomer solutions are similar to each other and consistent with those reported previously for EDOT and other derivatives. 48,50,58,60,61 They exhibit a characteristic, relatively constant, charging current between −0.100 V and 0.850 V and a significant increase in anodic current at potentials more positive than 0.850 V where polymer formation occurs.

Figure 5. Deposition voltammograms for (a) 0, (b) 25, (c) 34, (d) 50, (e) 66, (f) 75, and (g) 100 mol% 2. For each deposition solution, three electrodes on a single chip were modified by cycling a total of three times. The current for each cycle was averaged for the three modified electrodes. The first cycle is shown in red, the second green, and the third black. The standard deviation from the average is reported for ten potential values on both forward and reverse sweeps of each cycle. For all mol% 2, N = 3, except for 100 mol% 2, N = 6.
Download figure:
Standard image High-resolution imageA more detailed analysis of each CV cycle is given here to investigate possible differences induced by the two monomers and their mixtures. During the first, forward anodic sweep (red) for all monomer solution compositions, the current remains relatively constant due to double-layer charging at the bare gold surface until the potential nears +0.9 V. Beyond +0.9 V, the anodic current increases dramatically due to the oxidation of the monomers in solution that subsequently form polymer films on the electrode. Monomer oxidation and polymer deposition continue during the reverse sweep past +0.9 V because of the lower oxidation potentials of longer oligomers that were not present in solution during the initial anodic sweep. This hysteresis in the first electrodeposition voltammogram is characteristic in solutions of all monomer compositions studied herein. Figure S-12 in section 10 of the Supporting Information can be used to explain this behavior for monomers 1 and 2. It shows an electropolymerization mechanism modeled from the "oligomer approach" described in the literature for thiophene and pyrrole. 62 The mechanism highlights the difference between initial monomer oxidation and deposition of larger chain, insoluble oligomers, on the electrode surface. The first step is the oxidation of two monomers at the electrode surface resulting in monomeric radical cations. These remain in solution and react with each other forming a dimer in the diffusion layer. The first dimerization between two monomers, during the first anodic sweep, occurs at a larger Eonset than subsequent dimerization steps throughout the mechanism. The following steps include successive dimerization reactions at decreasing overpotentials leading to the formation of an octamer. The decreasing solubility of increased oligomer length leads to the deposition of the polymers on the electrode surface through instantaneous nucleation and 3D polymer growth.
Although the shapes of the deposition voltammograms in Fig. 5 are similar, a comparison of the anodic sweeps for each mol% 2 reveal different Eonset values of monomer oxidation and are listed in Table I. For all three deposition cycles, the 100 mol% 2 Eonset values are greater than those for the 0 mol% 2. The values for the first cycle differ by 0.08 ± 0.02 V. The lowest Eonset value for the 100 mol% 2 (Cycle 3, 0.969 ± 0.004 V) is greater than the highest Eonset value for the 0 mol% 2 (Cycle 1, 0.946 ± 0.003 V). These results suggest that monomer 1 is easier to oxidize than monomer 2 at the electrode. Because the anodic sweep of the first cycle is primarily the oxidation of the monomers to their radical cations at a bare gold electrode, the difference in oxidation potentials is most likely due to steric effects. The side chain of monomer 2 introduces a conformational barrier to the electrode surface for oxidation. A similar effect was observed between monomers differing in structure by even just a single hydroxymethyl group, as is the case for EDOT and monomer 1 reported in the literature, albeit at a much smaller difference. 55 The Eonset values for the first deposition cycle of the different mixed monomer solutions are different from each other. Still, they do not follow a consistent trend with the relative monomer composition in solution. However, the Eonset value does decrease consistently for a given solution composition from cycle 1 to cycle 3.
Evidence for growth of the polymer, layer by layer, from one cycle to the next can be seen in the increasing charging current with each cycle for all monomer solutions. The anodic current due to oxidative electropolymerization of the monomer also increases by a similar amount due to this. This behavior has been observed previously with EDOT and EDOT derivatives. 48,58,60 However, for a larger mol% 2 in the deposition solutions, the magnitude of both the maximum anodic and background currents are smaller, suggesting less electropolymerization occurs when monomer 2 is present.
To quantify this observation, integration of the background-subtracted current with respect to time during the oxidative deposition portion of the voltammograms was performed. This yields a charge, Q, that is proportional to the amount of monomer deposited. Figure 6a shows how the dependence of the total charge, QT , added over the three cycles, and averaged from multiple electrodes, varies with the composition of the solution. Figures 6b–6c illustrate how and where the integration of each voltammogram was performed. As seen in Fig. 6a QT decreases with increasing mol% 2 in the deposition solution. These values can be directly converted to the amount of monomer deposited, m, assuming 2.3 moles of electrons per mole of monomer deposited 40 using Eq. 2. Each deposition solution resulted in films with unique values of m. Although the trend exhibits a relatively weak fit to a linear model (R2 = 0.9889), there is a distinctive dependence of m on the mol% 2. This dependence is most likely a consequence of the decreasing pH of the deposition solution caused by the increasing concentration of monomer 2. The pH of the deposition solution affects proton elimination, which is the overall rate limiting step of the electropolymerization mechanism, as the nucleation and growth happen simultaneously (Fig. S-12). Therefore, the rate of proton elimination and thus the amount of oligomer formation from solutions comprised mostly of the acid, monomer 2, are expected to be lower than in solutions comprised mostly of monomer 1.

Figure 6. (a) Total charge passed, QT , during electrodeposition as a function of mol% 2 in deposition solution. As the mol% 2 increases from 0 to 100, QT decreases. The amount of monomer deposited, m, was calculated using a conversion factor of n = 2.3 moles of electrons per mole of monomer electropolymerized. QT was calculated by integrating and adding the three deposition voltammograms. The integration procedure involves converting the potential axis to time of the entire deposition cycle as shown in (b) and (c). A least squares linear fit produces the following equations: for points from 0 to 75 mol% 2, QT = (−1.58 ± 0.08 μC mol% 2−1) xmol% 2 + 307 ± 4 μC (R2 = 0.9889); for all points 0 to 100 mol% 2, QT = (−1.69 ± 0.08 μC mol% 2−1) xmol% 2 + 310 ± 5 μC (R2 = 0.9889).
Download figure:
Standard image High-resolution imageTable I shows the measured pH values of each deposition solution, along with a monomer-less solution containing only 0.1 M LiClO4 and 0.05 M SDS. The pH of the solutions decreases from 5.42 to 2.96 as the mol% 2 increases from 0 to 100 mol% 2. Although a pKa value for monomer 2 could not be found in the literature, it is likely to be similar to the pKa value of succinic acid, 4.16. 63 This is because succinic acid is nearly identical to the side chain of monomer 2. The pH of all deposition solutions containing monomer 2 are below this estimated pKa value. Applying the Henderson-Hasselbach equation and the known total concentrations of monomer 2 estimates the amount of protonated carboxylic acid moieties to range from 94% for the 100 mol% 2 deposition solution (pH 2.96) to 88% for the 25 mol% 2 deposition solution (pH 3.29). The higher pH value of the 0 mol% 2 solution (5.42) compared to that of the monomer-less solution (5.31) suggests that the presence of monomer 1 also affects the pH. The presence of SDS does not affect the pH of the solutions. Although the pH of the deposition solution can predict the extent of the electropolymerization, and thus m, it does not provide information regarding the relative amounts of monomer incorporated into the film.
In addition to pH, there is another possible explanation for the trend observed for mixed monomer deposition solutions in Fig. 6a. Previously reported co-electropolymerizations of EDOT and monomer 1 in aqueous solutions, for example, show a preference for the deposition of EDOT, over monomer 1, up to equimolar ratios of the monomers in the deposition solution. 55 Thus, one could argue that in our case, the decreasing m with increasing mol% 2 suggests that monomer 1 is the one that is predominately deposited. Note, however, that our solution conditions are substantially different (an aqueous solution of 0.1 M LiClO4 and use of a solubilizer) than in the other report (methanol, diluted with aqueous 0.1 M LiClO4). Consequently, the ratio of monomers in our deposited films could also be different. Therefore, an analysis of the ratio of monomers incorporated into the films was performed using μATR-FTIR and XPS, and is described in a subsequent section below.
Thickness and monomer density in polymer films
The packing of oligomers on the electrode surface could affect the electrochemical behavior of the films, including access to counter ions migrating in and out of the polymer network, as well as the path that the electrons travel from one oligomer to the next. Given the proposed mechanism of Fig. S-12 of the Supporting Information, we do not expect the side chain of monomer 2 to play a major role in the polymerization mechanism. Like EDOT, polymerization of the monomers 1 and 2 is linear through α-α' coupling of the thiophene rings, and the ethylenedioxy ring blocks coupling at the 3 and 4 positions. However, due to steric effects, monomers with a bulkier side chain, as is the case for monomer 2, should affect the packing of the deposited oligomers and produce a less dense polymer film.
To investigate the extent of packing, profilometry was used to measure the average cross-sectional areas of the polymer films. Representative height profiles from which the cross-sectional areas were obtained are shown in Fig. S-9 in section 6 of the Supporting Information. The profiles give information about how the polymers were deposited on the electrodes. As expected, there is a build-up of polymer along the edges of the electrodes, for all films, due to enhanced mass transport there from radial diffusion during the electrodeposition. Figure S-13 in section 11 of the Supporting Information shows that the average cross-sectional areas for the polymer films from the mixed monomer solutions do not exhibit a consistent trend. The two extreme cases of the pristine polymers, 0 and 100 mol% 2, yielded areas of 60 ± 19 μm2 and 30 ± 13 μm2, respectively. Assuming a uniform distribution of polymer along the entire 2000 μm length of the microbands, the molar concentrations of monomer units within the space occupied by the polymer are 12 ± 4 mol L−1 and 9 ± 4 mol L−1, respectively. Figure S-14 in section 11 of the Supporting Information compares these molar concentrations for all of the films as a function of mol% 2. There does not appear to be a definitve trend in this quantity, because of the substantial amount of error (as much as ∼36% orginating from the cross-sectional area measurements). Although there is some inherent error in the use of the profilometry instrument (±0.05 μm) and in digitizing the results, a greater error is likely due to inaccurate profiling of the polymer edges given the speed and size of the profilometer probe. Consistent with this hypothesis is that the average cross-sectional area of the bare gold electrodes (29 ± 5 μm2), which are flat, is within the error of the expected value of 26 um2 based on the amount of gold and chromium deposited during thermal evaporation.
Another way to evaluate the profilometry data is to avoid the edges and simply compare the thicknesses for the different films based on the height in center portion of the profiles. These results are also reported in Fig. S-13. The heights also vary, where films deposited from solutions of 0 and 100 mol% 2 measured 0.27 ± 0.05 and 0.15 ± 0.13 μm, respectively. There is no discernable trend among the films formed from the mixed monomer solutions.
Relative composition of monomers 1 and 2 in the polymer films determined from μATR-FTIR and XPS analyses
Determining the relative amounts of the two monomers incorporated into the polymer films from the mixed solutions addresses the questions regarding factors affecting the deposition and provides guidance about conditions for preparing films with desired properties. Quantitative analysis was performed using μATR-FTIR sampling, which can measure spectra from within the 100-μm wide microbands without overlapping with the gaps or other adjacent structures on the chip.
Figure 7a shows μATR-FTIR spectra plotted over the 1900–750 cm−1 range for polymer films electrodeposited from solutions of 100, 66, 50, 25, and 0 mol% 2. These films had been electrochemically characterized after film formation, thoroughly rinsed and soaked in water and allowed to dry in the air under ambient conditions. Peaks for the films are much broader and some are slightly shifted compared to those for the individual monomers (Figs. S-3a and S-3b in the Supporting Information). The polymer spectra are also similar to those previously reported for poly(2) and related polymers and monomers. Table III summarizes the proposed assignments of vibrational modes of the main peaks highlighted in Fig. 7a based on spectra reported in the literature. Absorbance bands at 836 and 976 cm−1 have been assigned to the stretching of the C–S bond of the thiophene ring. 49,64–69 Stretching vibrations within the ethyelenedioxy ring absorb at 1062, 1104, 1220 cm−1. 64,66–74 Several IR peaks can be traced to the stretching of the C=C and C–C bonds within the thiophene ring at 1169, 1370, 1477, and 1525 cm−1. 49,67,68,70–73,75 The bending vibration of H2O molecules retained within the film and the stretching of the C=O bond within the ester of monomer 2 absorb at 1642 and 1739 cm−1, respectively. 50,76
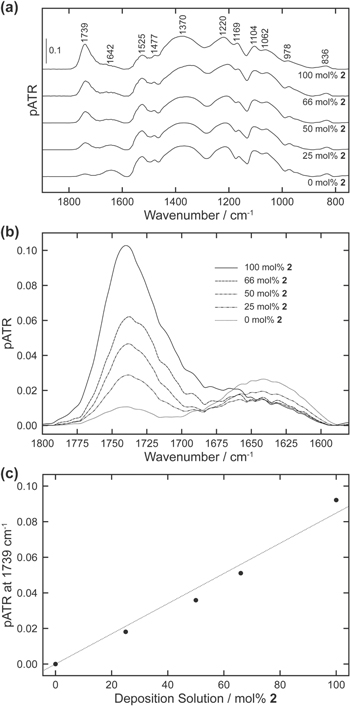
Figure 7. (a) μATR-FTIR spectra of polymer films on gold microelectrodes following electrodeposition from solutions containing a total monomer concentration of 0.02 M in a solution containing 0.1 M LiClO4 and 0.05 M SDS. The mol% 2 in the deposition solution is indicated directly below each spectrum. (b) Segments between 1800–1580 cm−1 from the spectra shown in (a) are overlaid to highlight the relative intensity changes in the ester C=O stretching (1739 cm−1) and water H–O–H bending (1642 cm−1) peaks. The solid and dashed lines indicate the mol% 2 present in the deposition solution during film preparation. (c) Plot of background corrected pATR1739 vs the deposition solution mol% 2. A least squares fit forced through the origin yielded (dotted line): pATR1739 = (8.5 × 10⁻⁴ ± 0.4 × 10⁻⁴ mol% 2−1) xmol% 2 (R2 = 0.9898).
Download figure:
Standard image High-resolution imageCarbonyl group stretching modes within esters exhibit some of the more distinct absorbances in IR spectroscopy, and in the present studies, provide a unique marker for monomer 2. Figure 7b shows an overlay of spectra in the expanded region of 1800–1580 cm−1 to enable comparison of changes in the ester carbonyl band for polymers formed from varying compositions of deposition solutions and in the bending vibration for the retained H2O. Although two carbonyl groups are present on the side chain of monomer 2, each with distinct vibrational bands in IR spectroscopy, only the C=O stretching vibration of the ester group is evident in spectra of the electropolymerized films. Because the carboxylic acid groups neutralize during the electrochemical characterization of the films in the sodium phosphate buffer, the characteristic band for the carboxylic acid stretch is replaced by lower wavenumber carboxylate group vibrations near 1400 cm−1. Figure 7b shows the expected increase in pATR1739 for films formed from deposition solutions with increasing mol% 2. Interestingly, pATR1649 displays the opposite trend, decreasing with increasing deposition mol% 2. The response indicates the electropolymerized films become more resistant to wetting with increasing monomer 2 content, possibly a result of the side-chain hydrophobicity.
A plot of the pATR1739 vs the mol% 2 of the deposition solution is shown in Fig. 7c. The background pATR1739 derived from the 0 mol% 2 sample has been removed by subtraction. The near linear calibration relationship (R2 = 0.9898) demonstrates the content of monomer 2 in the electropolymerized films can be closely estimated from the deposition solution composition. These data also support the notion that the decreased quantity of electropolymerized monomer that occurs with increasing mol% 2 in solution is due to a change in pH and not the idea that the deposition is dominated by monomer 1. The fact that the ratio of the two monomers in the polymers closely tracks their ratio in the deposition solutions, regardless of the total quantity of polymer electrodeposited, suggests that our conditions involve a factor that normalizes the monomer deposition behavior. This factor is SDS, and its effect is described in more detail in the next section.
Further confirmation of the chemical composition of the films was obtained by XPS. Because the spot size (110 μm) was slightly larger than the microelectrode width (100 μm), some of the survey spectra (not shown) measured peaks for silicon from the SiO2-coated silicon substrate. Thus, the analysis of the XPS data here focuses on the C(1s) peaks and does not include the O(1s) peaks. Figure 8 shows C(1s) narrow scans of the 0, 25, 34, 50, 66, and 100 mol% 2 films. Deconvolution and fitting of the spectra were performed to confirm contributions of the different carbons and, therefore, the relative amounts of the two monomers toward the spectra. A careful balance between mathematical overfitting and reasonable assessment of the spectra considering the expected chemistry was the overall goal. Because the samples were prepared and stored under ambient conditions, there is adventitious carbon on the surfaces. Adventitious carbon is often used as a calibration reference for binding energy values (284.6–285 eV). For our measurements, however, we are interested in the different carbonaceous species within the films. Thus, we focused on the intensity of the XPS signals of carbonyl carbons at higher binding energies than the adventitious carbon, as this is an indication of the relative amount of monomer 2 present in the film.
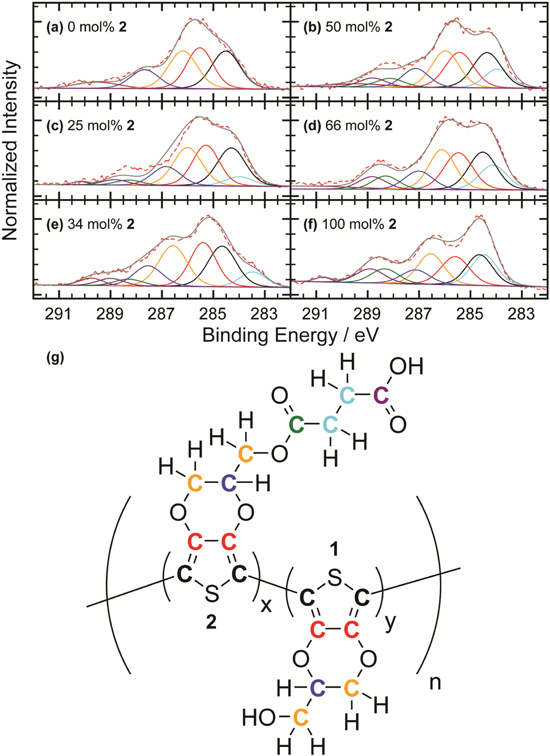
Figure 8. Deconvoluted and fitted C(1s) XPS spectra for (a) 0, (b) 50, (c) 25, (d) 66, (e) 34, and (f) 100 mol% 2films. The raw XPS data is the red dotted line, the overall fit is the solid gray line, and each of the components in the deconvolution corresponds to the color coded carbons shown in (g) for both monomers 1 and 2. All spectra are calibrated to 284.6 eV and additional peaks not attributed to carbon content of the monomers is due to π-π* shake-up. As the carbonyl content of the deposition solution increases the cps around 289 eV increases, which is directly related to the ester and carbonyl content of the films.
Download figure:
Standard image High-resolution imageFigure 8a is the deconvolution and fit of the 0 mol% 2 film to four synthetic components, one for each type of carbon and one for the contribution from π-π* shake-up within the thiophene; for Figs. 8b–8f there are eight total synthetic components. See the color-coded carbons in the structure shown in Fig. 8g as a guide. The first and second components (cyan and black, respectively) are from the carbons that are in-between the ester and carboxylic acid and present only in monomer 2 (284.1 ± 0.4 eV) and the carbons adjacent to the sulfur in the thiophene ring that are present in both monomers (284.62 ± 0.11 eV). The third component (red) is attributed to the other two carbons in the thiophene ring at 285.44 ± 0.08 eV. One carbon in the ethylenedioxy bridge and the methylene carbon have been designated as equivalent and contribute to the fourth component (orange) at 286.3 ± 0.3 eV. The other carbon in the ethylenedioxy bridge is accounted for in the fifth component (blue) at 287.4 ± 0.3 eV. The sixth and seventh components are only present in films containing monomer 2 and are due to the carbons of the ester (green) and carboxylic acid (purple). They give rise to peaks at 288.6 ± 0.3 and 289.0 ± 0.4 eV, respectively. Despite the synthetic components and their specific position, there is an increase in signal corresponding to carbons with a higher binding energy as the films were produced from deposition solutions with increasing mol% 2. Therefore, the XPS C(1s) spectra support the μATR-FTIR data and show an increase in the ester content of the films as the mol% 2 in the deposition solution increases. Because XPS is a surface analysis technique (depth of ∼10 nm), these results also suggest there is not a major difference between the surface and the bulk composition of the films.
The role of SDS in film formation
Models have been developed to describe how SDS enhances the solubility of other thiophenes and pyrrole in aqueous solutions and has a catalytic effect on their electropolymerization. 32,77,78 These can be used to explain how copolymer film compositions closely reflect those of solution mixtures of monomers 1 and 2. It has been proposed that the hydrophobic tails of SDS molecules associate with pyrrole monomers to solubilize them in aqueous solutions and that a sufficient amount of SDS is needed to efficiently supply monomer to the electrode surface, which is achieved when the SDS is in micellar form. 77 This is the case for our experiments, where the concentration of SDS (0.05 M) is above the critical micelle concentration (CMC), 0.0082 M at 25 °C. 79 Although monomer 1 is water-soluble, it is likely to interact with SDS in a similar way as monomer 2 due to the hydrophobic thiophene region. It is also possible that more than one monomer is associated with each micelle. 77 The resulting, multi-molecular assemblies could then experience mass-transport to the electrode surface that does not depend on the individual monomer shape, size and hydration sphere. SDS micelles also form a bilayer at the electrode, which is stabilized with increased SDS concentration. The bilayer could further facilitate presentation of the micelle/monomer assemblies to the surface and host monomers within it. 77
It has been shown that the oxidation potential of EDOT for electropolymerization decreases with increasing concentration of SDS until an effective CMC for the electrochemical system is reached, at which point the oxidation potential plateaus. 78 In a 0.1 M LiClO4 aqueous solution, that concentration is ∼0.005 M. This behavior is ascribed to the formation of a 1:1 pseudocomplex between EDOT+• and the anionic head group DS− that has a relatively large equilibrium constant of formation, 5.4 × 10³ M−1, and which attains a steady concentration once the CMC is achieved and all the EDOT is incorporated in the micellar phase. In our studies with aqueous 0.1 M LiClO4 and 0.05 M SDS, well above the effective CMC, Eonset for monomer 1 is indeed more negative (by 73 mV) than that reported by Doherty et al. 55 for this monomer in aqueous (10% v/v methanol) 0.1 M LiClO4 solutions without SDS.
The role of SDS can be revealed by comparing the behavior of Eonset for increasing amounts of one monomer in the presence of another. We found no particular trend in Eonset for deposition mixtures containing all combinations of monomers 1 and 2, even though the difference in Eonset between 0 mol% 2 and 100 mol% 2 is 85 mV. The Eonset for mixtures remained within 37 mV of that of monomer 1 alone (0 mol% 2). However, Doherty et al. report a more consistent trend in Eonset for mixtures without SDS and with a narrower 30 mV difference of Eonset for monomer 1 alone to Eonset for EDOT alone.
The effect of SDS micelles on normalizing the electrodeposition of 1 and 2 is especially dramatic when evaluating Fig. 7(c) in light of the copolymer composition curves of Doherty et al. 55 For a better comparison, the figure was rescaled from 0 to 1 on the ordinate and abscissa and is shown in Fig. S-15 in section 12 of the Supporting Information. At a depletion of only 0.007% of the monomers during electropolymerization from an equimolar solution, the mole fraction of monomer 2 (higher Eonset ) in the copolymer film is 0.41. In contrast, a depletion of 50% of the monomers from an equimolar ratio of 1 and EDOT in an aqueous deposition solution without SDS was required to achieve a similar mole fraction in the film for the monomer with the higher Eonset,. 55
Another way to quantify the reactivity of the two monomers in this SDS solution is to determine the reactivity ratios, r, for a two-monomer system, 55,80

where k11 and k22 are the homogeneous rate constants of the reaction of the cation radical of a monomer with another monomer of the same kind for monomer 1 and monomer 2, respectively. The k12 and k21 are the rate constants for the cation radical of monomer 1 reacting with monomer 2 and for cation radical of monomer 2 reacting with monomer 1, respectively. The relative mole ratio of the monomers in the copolymer, m1 /m2 , can be predicted with Eq. 7 and using these reactivity ratios and the initial concentrations of the two monomers, [M1] and [M2], under the assumption of steady-state conditions (low depletion of monomers from solution, which is the case here).

From m1 /m2 ratios obtained from pATR of the copolymer films for the different combination of points at 25, 50 and 66 mol% 2, r1 = 1.4 ± 0.2 and r2 = 0.5 ± 0.1. This suggests that the propagating cation radical of monomer 1 reacts preferentially with itself (r > 1) and the propagating cation radical of monomer 2 also reacts preferentially with monomer 1 (r < 1). It is consistent with a slightly higher dominance of monomer 1 in the film. For comparison, Doherty et al. report reactivity ratios that deviate even more from unity for a two-monomer system without SDS at low depletion (monomer 1 (r = 0.15) and EDOT (r = 1.65)), but closer to unity for high depletion (monomer 1 (r = 0.71) and EDOT (r = 1.58)). This further confirms the role of SDS micelles at low depletion to produce a copolymer film that is more representative of monomer concentrations in solution. Interestingly, the product, r1 r2 , can provide information about the relative arrangement of monomer units along the copolymer backbone. When r1 r2 = 0, an alternating sequence of monomer units is predicted; when r1 r2 = 1, a random arrangement is expected, and when r1 r2 > 1, a block copolymer is formed. 55,80 For the conditions reported here, r1 r2 = 0.7 ± 0.3, so that the arrangement of monomer units is more random than it is alternating.
Electrochemical characterization of the polymer films
Figure S-16 in section 13 of the Supporting Information shows CV responses of polymer films obtained in two different solutions: 0.2 M sodium phosphate buffer and 0.2 M of the buffer containing 0.001 M K4Fe(CN)6. The shapes of the voltammograms in buffer alone are similar to those observed for PEDOT in aqueous supporting electrolytes, where the current is relatively flat across the entire voltage range of −0.100 to +0.700 V. 60 This behavior is similar to the charging of a capacitor. Such behavior is also observed for CV in buffer containing ferrocyanide during the forward sweep at potentials negative of the E° value and before the faradaic current becomes pronounced. The capacitances (C) obtained from CV in both of these characterization solutions are shown in Fig. 9 and listed in Table II for the polymer films as a function of the mol% 2 of their deposition solutions. The C values obtained from the redox solution are within error of or slightly larger than those obtained in solutions of buffer alone. The small increase in C could be due to the increased ionic strength from the additional K4Fe(CN)6.

Figure 9. Capacitance, C, of films calculated using Eq. 1 from the background charging current determined by CV in two sets of studies: (●) at 0.4 V in 0.2 M sodium phosphate buffer, pH 6.5, and ( ) at 0.0 V in a solution containing both 0.001 M K4Fe(CN)6 and 0.2 M sodium phosphate buffer, pH 6.5. The dotted line is shown for bare electrodes as a reference of the capacitance before electrodeposition in the 0.2 M sodium phosphate buffer, pH 6.5. A least squares linear fit produces the following equation for points from 0 to 75 mol% 2, C = (−1.9 × 10⁻² ± 2 × 10⁻³ mF cm−2 mol% 2−1) xmol% 2
+ 3.67 ± 0.10 mF cm−2 (R2 = 0.9007).
) at 0.0 V in a solution containing both 0.001 M K4Fe(CN)6 and 0.2 M sodium phosphate buffer, pH 6.5. The dotted line is shown for bare electrodes as a reference of the capacitance before electrodeposition in the 0.2 M sodium phosphate buffer, pH 6.5. A least squares linear fit produces the following equation for points from 0 to 75 mol% 2, C = (−1.9 × 10⁻² ± 2 × 10⁻³ mF cm−2 mol% 2−1) xmol% 2
+ 3.67 ± 0.10 mF cm−2 (R2 = 0.9007).
Download figure:
Standard image High-resolution image
Table II. Electrochemical and infrared spectroscopy characterization of polymer films.
| Mol% 2 | Electrochemical Characterization | μATR-FTIR | |||||
|---|---|---|---|---|---|---|---|
| C (mF cm−2) | Faradaic Response | pATR | |||||
| Sodium Phosphate a) | Ferrocyanide a) | ΔEp (V) a) | ipa (μA) a) | ipc (μA) a) | ipc /ipa a) |
 = 1739 cm−1 (au) = 1739 cm−1 (au) | |
| Bare Au | 0.0650 ± 0.0004 | d) | 0.14 ± 0.03 | −0.44 ± 0.05 | 0.37 ± 0.06 | 1.0 ± 0.2 | e) |
| 0 | 3.58 ± 0.02 | 3.71 ± 0.05 | 0.064 ± 0.007 | −0.63 ± 0.02 | 0.83 ± 0.01 | 1.32 ± 0.03 | 0.0 |
| 25 | 3.20 ± 0.01 | 3.5 ± 0.2 | 0.075 ± 0.003 | −0.567 ± 0.009 | 0.615 ± 0.007 | 1.08 ± 0.02 | 0.0181 |
| 34 | 2.79 ± 0.02 | 2.80 ± 0.06 | 0.074 ± 0.003 | −0.57 ± 0.01 | 0.571 ± 0.006 | 1.01 ± 0.01 | e) |
| 50 | 2.70 ± 0.02 | 2.97 ± 0.06 | 0.075 ± 0.003 | −0.57 ± 0.02 | 0.628 ± 0.006 | 1.10 ± 0.01 | 0.0358 |
| 66 | c) | 2.5 ± 0.1 | 0.073 ± 0.003 | −0.84 ± 0.04 | 0.83 ± 0.03 | 1.00 ± 0.05 | 0.0511 |
| 75 | 2.17 ± 0.01 | 2.1 ± 0.1 | 0.073 ± 0.003 | −0.622 ± 0.008 | 0.58 ± 0.01 | 0.93 ± 0.03 | f) |
| 100 | 0.065 ± 0.004 b) | d) | 0.17 ± 0.03 b) | −0.53 ± 0.09 b) | 0.47 ± 0.06 b) | 1.0 ± 0.2 b) | 0.0922 |
a)Averages ± standard deviation obtained from the different electrodes on the same chip, except for the 100 mol% 2 case. b)Averages ± standard deviation obtained from six different electrodes on the same chip for the 100 mol% 2. c)Inconsistencies in CV responses resolved in later experiments but on older films and therefore not reported here but shown in Fig. S-16 of the Supporting Information. d)Offset made measurement of charging current not possible. e)Spectra not obtained. f)Inconsistencies in spectra due to lack of film homogeneity.
The average C of the bare gold microelectrodes (0.0650 ± 0.0004 mF cm−2, N = 17) before modification has the expected magnitude for these conditions. Interestingly, it is indistinguishable from that for the films resulting from the 100 mol% 2 deposition solution (0.065 ± 0.004 mF cm−2, N = 3). Yet, a purple color, a substantial amount of charge passed during electrodeposition, and the micrographs of the arrays after electrodeposition (Fig. S-11) confirm the presence of a 100 mol% 2 film. Although the electropolymerization in the 100 mol% 2 solution deposited as much as half of the number of monomers that were deposited from the 0 mol% 2 solution (Fig. 6a), it is as if those sites are inaccessible in the polymer for oxidation and re-reduction and therefore the only contribution to the background current is the charging of the double layer at the polymer/solution interface. It is possible that the 100 mol% 2 films have lost some electrical connectivity with the electrode during the electrochemical characterizations, and thus we are careful not to overinterpret the low C value.
The incorporation of increasing amounts of monomer 2, however, does not adversely affect the measured capacitances for the mixed polymers. For the range of 0 to 75 mol% 2, the decrease in capacitance (Fig. 9, slope = −5.1 × 10⁻³ ± 6 × 10⁻⁴ mol% 2−1, normalized to the 0 mol% 2 value) is the same as the decrease in the quantity of monomers deposited (Fig. 6, slope = −5.2 × 10⁻³ ± 3 × 10⁻⁴ mol% 2−1, normalized to the 0 mol% 2 value). Another way to illustrate this point is by plotting Cnormalized
vs. mnormalized
as shown in Fig. S-17 in section 13 of the Supporting Information. This comparison assesses whether changes in capacitance are simply proportional to the quantity of polymer (expecting a linear relationship and slope of unity) or influenced more by the relative composition of 2:1 in the polymer (expecting a nonlinear relationship and a slope not equal to one). Least squares analysis for points 0 to 75 mol% 2 in Fig. S-17 yields: yCnormalized
= (1.01 ± 0.09 Cnormalized
(mnormalized
)−1)  – 0.01 ± 0.07 Cnormalized
(R2 = 0.9672). The R2 value suggests that a linear relationship is not strong. However, the slope is indeed unity, confirming that it is the quantity of monomer deposited that determines the capacitance and not the relative composition of monomers 2 and 1 in the polymer films. The y-intercept of the linear regression ideally represents the double layer capacitance when there is no film (a bare electrode). Its error brackets the measured (and normalized) double layer capacitance of the bare electrodes (0.0650 ± 0.0004 mF cm−2/3.65 ± 0.06 mF cm−2 = 0.0178 ± 0.0003).
– 0.01 ± 0.07 Cnormalized
(R2 = 0.9672). The R2 value suggests that a linear relationship is not strong. However, the slope is indeed unity, confirming that it is the quantity of monomer deposited that determines the capacitance and not the relative composition of monomers 2 and 1 in the polymer films. The y-intercept of the linear regression ideally represents the double layer capacitance when there is no film (a bare electrode). Its error brackets the measured (and normalized) double layer capacitance of the bare electrodes (0.0650 ± 0.0004 mF cm−2/3.65 ± 0.06 mF cm−2 = 0.0178 ± 0.0003).
This retained electrochemical activity suggests that the bulkier side group of monomer 2 does not disrupt the conductivity between neighboring oligomer groups within the polymer network. In addition, it appears that the negative charge of monomer 2 due to deprotonation of the carboxylic acid groups, as is supported by the μATR-FTIR data, does not impede counter ion compensation that is needed for the polymer to oxidize and reduce. The presence of carboxylate anions within the polymer likely contribute toward ion compensation themselves, requiring cations to enter the films because the carboxylates are tethered, transferring the role of charge compensation from anions to cations, as is known to occur in polymers of PEDOT formed with polystyrenesulfonate (PSS). 81 It should also be noted that the rinsing, electrochemical cycling in the buffer, and storage in water after the electropolymerization step remove residual SDS. This is supported by the lack of absorption bands specific to SDS in the μATR-FTIR data. Thus, the normalizing effect that SDS has on the different side chains of the monomers during electropolymerization no longer applies to the monomer units within the polymer after the films are formed.
Investigation of the faradaic electrochemistry of [Fe(CN)6]4− in buffer using CV at electrodes modified with the conducting polymer films was intended to establish the facility to electron transfer across the polymer/solution interface. The shapes of the resulting CV responses (see Fig. S-16 in section 13 Supporting Information) for all films at 0.100 V s−1 are consistent with mass transport that is dominated by planar, diffusion-limited behavior. The diffusion length is estimated to be approximately 80 μm by the Einstein equation, which is on the same order of magnitude as the width of the electrodes and suggests that there may be some minor contribution from hemicylindrical diffusion as well. The background-subtracted forward peak currents, ipa , reverse peak currents, ipc , their ratio, ipc /ipa , and peak separations, ∆Ep are listed in Table II.
The faradaic peak currents (background-subtracted) from the CV responses at the different polymer films can be compared. The Randles-Sevcik equation predicts the forward peak current to be 0.43 μA at a planar electrode with dimensions of the microband electrodes (100 μm × 2000 μm, assuming the height 0.025 μm provides a negligible contribution), at 23 °C, and for [Fe(CN)6]4− (n = 1 mole of electrons/mole of molecules) using a diffusion coefficient of 0.65 × 10⁻⁶ cm2 s−1. 82 This predicted value is within the error of the ipa obtained for the bare gold electrodes. The ipa values for the polymer films range from 22 to 93% larger than this, with a median of 31%, and do not appear to follow any particular trend with the mol% 2. The higher current could result from the higher surface area of the polymer films. The variation in ipa could derive from polymer growth that is affected by a combination of planar and hemicylindrical diffusion during each deposition sweep that builds on the morphology of the previous deposition, producing nonuniform films. This is consistent with cross sectional areas and nonuniform profiles measured by profilometry (Fig. S-9 in section 6 of the Supporting Information).
Table III. Absorption bands of μATR-FTIR of co-electropolymerized films.
| Wavenumber (cm−1) | Assignment | References |
|---|---|---|
| 836, 976 | ν(C-S)thiophene | 49, 64–69 |
| 1062, 1104, 1220 | v(C-C), v(-COROC-)ethylenedioxy ring | 64, 66–74 |
| 1169, 1370 | ν(C-C)thiophene | 67, 73, 75 |
| 1477, 1525 | v(C=C), ν(C-C)thiophene | 49, 68, 70–72 |
| 1642 | δ(H2O) | 76 |
| 1739 | ν(C=O)ester | 50 |
ν = stretching and δ = bending.
The ratio of the reverse peak current to that of the forward peak (ipc /ipa ) is expected to be unity for a reversible electron transfer with a stable anodic product. This ratio also allows comparisons of electrochemical behavior between different films by normalizing out the varying ipa values. The ratio appears to follow a trend from the largest of 1.32 ± 0.04 for the 0 mol% 2 film to the smallest of 0.89 ± 0.02 for the 100 mol% 2 film. A ratio greater than unity is consistent with films that exhibit an expansion during oxidative excursions to accommodate the incorporation of anions to compensate charge. The film is most expanded in its anodic state, as has been observed for thick films of PEDOT as described previously. 60 A growing film can oxidize increasingly more ferrocyanide in the forward sweep past the anodic peak and possibly push through the diffusion layer to access fresh solution. As the potential passes E° in the return sweep, a larger peak occurs because of a higher ferricyanide concentration, than would have been produced had the film not increased size. Ratios less than unity for films with high mol% 2 suggest that the least expanded film is in its anodic state, when tethered carboxylate anions internally compensate for the positive charge along the backbone. The oxidation peak of ferrocyanide appears with diminishing oxidation in the forward sweep as the film contracts. It is during the reductive excursions that the film expands, when cations must enter the polymer to compensate for the immobilized negative charges of the carboxylates, but there is less ferricyanide available to reduce than if the film had not changed size. A smaller faradaic peak in the return sweep of films of high mol% 2 could also be partially explained by more repulsion of the anionic redox species, whereas in the forward anodic sweep, [Fe(CN)6]4− can also serve as a counter ion for the polymer oxidation. However, the high concentration of supporting electrolyte should shield most of the migration of the redox species in solution.
The separation of the forward and reverse peaks, ΔEp, is near the ideal value of +0.059 V for n = 1, 25 °C, and fast heterogeneous electron transfer kinetics on the time scale of the experiment, 83 for all films containing monomer 1 (0–75 mol% 2). However, the ∆Ep for films from the 100 mol% 2 solution. is + 0.17 ± 0.03 V. This valueis within a standard deviation of that for the bare gold electrodes, ΔEp = + 0.14 ± 0.03 V. The larger ∆Ep could be due to two reasons. One is that the electron transfer kinetics are slower than at films containing monomer 1, because of different electrode surface composition to which ferrocyanide (an inner-sphere redox species) is known to be sensitive. 84 The other is that there is substantial uncompensated resistance within the electrode or polymer. Because the 100 mol% 2 films behave like the bare gold electrodes in buffer alone for the proposed reasons described above, the large ΔEp is most likely due to slower heterogeneous kinetics.
Conclusions
Co-electropolymerization on gold microband electrodes was performed from solutions of varying ratios of monomers 1 and 2 (two derivatives of EDOT) and the properties of the resulting films were investigated by electrochemical methods, profilometry, μATR-FTIR, and XPS. Deposition volumes were conserved and a chip-based, multi-electrode array could be exploited for these studies by using a specialized electrochemical cell designed and built for this purpose.
The more acidic pH of the deposition solutions containing higher mol% 2 decreases the total quantity of monomers deposited. The presence of SDS above its CMC affects the solubility and reactivity of both monomers and facilitates their incorporation into the films close to the same ratio as in the deposition solutions. Polymer films containing increasing amounts of monomer 2 relative to monomer 1 do not exhibit significantly different packing densities. They demonstrate similar charging capacities and electron transfer facility with redox species in solution for a given total number of monomers deposited. It is likely for high mol% 2 polymer films that the carboxylate groups of 2 play a role in the internal charge compensation during oxidative and reductive excursions, reversing the expansion and contraction of films. This is because cation transport from the aqueous solution dominates the charge compensation in those polymers. Additional studies would be needed to further investigate this idea. Although for the 100 mol% 2 films, charging of the polymer, beyond the double layer charging, appears to be completely shut down. Future studies involving a quartz crystal microbalance could shed light on ion transport, inhibition of electropolymerization by acidic pH, and composition of copolymer based on the different molar masses of the monomers.
These studies have demonstrated tunable formation of electropolymerized films with predictable numbers of carboxylic acid and hydroxyl functional groups, without affecting the charging capacity of the films relative to the total monomer deposited. One can take advantage of the COOH and OH moieties to implement subsequent functionalization, selective to one or the other of these groups, and thereby further tailor the films' physical and chemical properties for applications in energy and sensing. The films containing any ratio of monomer 2 to monomer 1, except 100 mol% 2, would retain similar charge storage in supercapacitors and fast electron transfer kinetics for mediators, reporters, and analytes in chemical sensing.
Acknowledgments
We are grateful for financial support from the National Science Foundation (CBET-1336853 and CMI-1808286), the Arkansas Biosciences Institute, the major research component of the Arkansas Tobacco Settlement Proceeds Act of 2000, as well as Grant Number P30 GM103450 from the National Institutes of General Medicine Sciences of the National Institutes of Health (NIH). We recognize the support of the Arkansas Statewide MS facility staff and their help in obtaining the LC-ESI-MS data of the monomers. We also thank Joel M. Harris for use of the μATR-FTIR instrumentation. We acknowledge the use of the High Density Electronics Center (HiDEC) for microfabrication. This work also made use of the University of Utah Surface Analysis Lab shared facility of the Micron Technology Foundation Inc. Microscopy Suite sponsored by the College of Engineering, Health Sciences Center, Office of the Vice President for Research, and the Utah Science Technology and Research (USTAR) initiative of the State of Utah.