

Abstract
The Intermittent Microwave Heating (IMH) assisted polyol method was used to disperse Pt nanoparticles on Vulcan XC-72 (C) and reduced Graphene Oxide (rGO) functionalized with [(η6-C6H5OCH2CH2OH)RuCl2]2 (Ru-dim) and [(η6-C6H4(CHMe2)Me)RuCl2]2 (Ru-cym). The nanocatalysts were labeled as Pt/CRu-dim, Pt/CRu-cym, Pt/rGORu-dim and Pt/rGORu-cym. Their catalytic activity was evaluated for the Methanol (MOR) and Ethanol Oxidation Reactions (EOR). 1H and APT 13C NMR characterization showed the coordination of arene ligands with ruthenium atoms, supporting the formation of Ru-dim and Ru-cym. Raman spectroscopy indicated that C and rGO preserve their graphitic band structure after functionalization. Functionalization of the supports resulted in the development of several surface chemical groups. The electrochemical characterization showed that: i) Pt/CRu-dim was the nanocatalyst with the highest catalytic activity for the MOR, demonstrating also a high performance for the EOR; ii) Pt/rGORu-cym showed a good electrocatalytic behavior for both reactions at more negative potentials, nevertheless delivering lower current densities (j). In terms of the organic molecule, higher j values have been obtained from the MOR, compared to the EOR. The results showed that these nanocatalysts can be considered as anode materials in Direct Alcohol Fuel Cells applications.
Export citation and abstract BibTeX RIS
Direct Alcohol Fuel Cells (DAFCs) are energy generating electrochemical devices that have strongly attracted the attention of research groups over the past years. 1 The use of liquid organic molecules (e.g., methanol and ethanol) avoids the problems typically found in the production and handling of hydrogen. 2 Their electrochemical oxidation is, however, rather complex and the production of reaction intermediates drastically affects the performance of nanocatalysts containing only Pt atoms. 3 One of the most effective strategies to reduce the negative impact of species such as adsorbed carbon monoxide (COads) on Pt nanoparticles has been the development of Pt-alloys. 2,4,5
Conventionally, Pt-alloys for fuel cell applications are obtained by the simultaneous reduction of the metal precursors. 6–8 Among the Pt-alloys widely used for the oxidation of organic molecules, Pt-Ru has shown a significantly enhanced catalytic activity for the MOR and the EOR, along with high tolerance to CO-poisoning. 9–11 Pastor et al. have reported that the synthesis method has a relevant effect on the catalytic behavior and that the presence of Ru oxides promotes the generation of higher current densities from Pt-Ru/CNF catalysts. 10 Sarma et al. developed a small-size Pt-Ru/RGO nanocatalyst via a surfactant-free synthesis, with higher catalytic activity for the MOR than Pt/RGO. 12 Rodríguez-Varela et al. evaluated the performance of Pt-Ru/C alloys for the EOR in acid media, demonstrating a higher catalytic activity than a Pt/C nanocatalyst. 11
In a novel approach by our group, the formation of Pt-Ru alloyed phases has been achieved by functionalizing commercially available C and rGO supports with the [(η6-C6H5OCH2CH2OH)RuCl2]2 (Ru-dim) and [(η6-C6H4(CHMe2)Me)RuCl2]2 (Ru-cym) compounds. In those works, Pt nanoparticles have been dispersed by the conventional polyol method. 13,14 The Pt/CRu-dim and Pt/rGORu-dim nanocatalysts have shown a higher catalytic activity than Pt/C and Pt/rGO for the MOR. As in the case of a previous report, 10 the presence of RuO2 had a positive effect in the catalytic activity of Pt/CRu-dim and Pt/rGORu-dim. Moreover, the formation of alloyed Pt-Ru phases enhanced their performance as a positive consequence of the bifunctional mechanism and the ligand effect.
On this issue, several research groups have reported the use of different organometallic compounds to catalyze electrochemical reactions. 15–17 As pointed out recently by Vizza et al., the intrinsic characteristics of organometallic compounds make them a new class of electrocatalysts for fuel cell applications. 18 Thus, this novel approach is gaining relevance in the field of electrochemical energy generation.
This work aims to further explore the application of arene-Ru organometallic complexes in the electrocatalysis of fuel cell reactions using nanosized Pt catalysts. Commercial C and rGO supports have been functionalized with the above-mentioned Ru-dim and Ru-cym compounds. Outspreading the works reported before, 13,14 here the Pt nanocatalysts have been synthesized by the IMH-assisted polyol method rather than the conventional one, as an initiative to shorten the time of synthesis and to evaluate the chemical stability of the functionalized supports. Particularly, the permanency of Ru species (Ru and RuO2) is of interest since the fundamental proposal is to form Pt-Ru alloys. Their catalytic activity is evaluated by cyclic voltammetry not only for the MOR as in our previous works, but also for the EOR, as a way to propose high-performance nanocatalysts for two types of DAFCs. Organometallic Ru-arene compounds, functionalized supports and nanocatalysts are physicochemically characterized by 1H and APT 13C NMR, XRD, SEM-EDS, HR-TEM and XPS.
Experimental
Chemicals and materials
The following reactants were used: C4H8O (THF, 99.0%), C2H5OH (99.7%), CH3OH (99.6%), C8H18O (anhydrous, 99.3%), 1,2-ethanediol (99.0%), C3H8O (99.5%), CHCl3 (99.2%), C6H14 (anhydrous, 99.6%), H2PtCl6·6H2O (99.9%), RuCl3·3H2O, 1-metoxy-1,4-cyclohexadiene (85%), α-terpinene (85%), Nafion (5 wt.%), hexadeuterodimethyl sulfoxide (DMSO-d6, 99.9%), deuterated chloroform (CDCl3, 99.96%) from Sigma-Aldrich; Vulcan XC-72 from Cabot Corp.; rGO from ID-Nano; H2SO4 (96.3%) from Fermion; NaOH from Jalmek; liquid nitrogen, gaseous N2 and Ar (UHP) from Infra. The dimeric ruthenium (II) Ru-dim and Ru-cym were prepared (with some modifications that are mentioned below) according to previously reported methods using a vacuum-line and standard Schlenk techniques. 19,20
Synthesis of [(η6-C6H5OCH2CH2OH)RuCl2]2 (Ru-dim) and [(η6-C6H4(CHMe2)Me)RuCl2]2 (Ru-cym)
Ru-dim was obtained from a mixture of RuCl3·3H2O (1 g, 3.82 mmol) and metoxy-1,4-cyclohexadiene (2.25 ml, 19.2 mmol) in 1,2-ethanediol (15 ml) which was heated under magnetic stirring and reflux at 120 °C for 45 min. The red-brown solution was standing 12 h to 3 °C, a red orange precipitated that was filtered off, washed with ethanol, and dried in vacuo. Ru-dim was obtained as an orange-red solid (1.35 mg, 90.5% yield).
Ru-cym was synthesized from a mixture of dry C2H5OH (40 ml) and RuCl3·3H2O (2 g, 9.64 mmol) under Ar atmosphere, to which α-terpinene (10 ml, 61.47 mmol) was added. 14 Then, C2H5OH (60 ml) was adjusted followed by magnetic heating under refluxing conditions at 80 °C for 4 h. An orange powder was obtained (1.92 mg, 65.14% yield).
Synthesis of CRu-dim, CRu-cym, rGORu-dim and rGORu-cym
The functionalized supports were obtained by preparing a mixture of carbon:organometallic compound with molar ratio of 10:1, i.e., 40 mg (1.68 mmol) carbon support and 0.168 mmol Ru-complex (208.32 mg Ru-dim and 205.76 mg Ru-cym). 21 The mixture was dispersed by magnetic stirring in 8 mL of THF under Ar atmosphere at 80 °C for 48 h. The resulting powders were transferred to a Schlenk tube, filtered via a cannula, washed with THF and dried under vacuum conditions for 6 h. Black/reddish powders were obtained from the Ru-dim compound, while in the case of Ru-cym the color was rather orange-like. For comparative purposes, non-functionalized C and rGO were also evaluated.
Synthesis of 20 wt.% supported Pt nanocatalysts
The nanocatalysts were synthesized by the IMH-assisted polyol method. Separately, 53 mg of H2PtCl6·6H2O in 2 ml C2H6O2 and 80 mg of each support in 48 ml of C2H6O2 were dispersed by ultrasound for 30 min. Then, the Pt-containing solution was adjusted to the carbon mixture drop by drop, keeping sonication for 5 min. The pH was adjusted to 11 by adding 1 mol l−1 NaOH under magnetic stirring for 15 min, the mixture was placed in a home-modified microwave oven and intermittently heated during 10 min (60 s on/off pulses) under agitation and refluxing conditions. After cooling, the pH was modified to 2 by adding 1 mol l−1 H2SO4 under stirring for 30 min. The black powders were filtered and washed with deionized water. The nanocatalysts were labeled as Pt/CRu-dim, Pt/CRu-cym, Pt/rGORu-dim, Pt/rGORu-cym, Pt/C and Pt/rGO.
Physicochemical characterization
For 1H and APT 13C-NMR analyses, two Bruker Advance III apparatus operating at 500 and 400 MHz were used. Ru-dim and Ru-cym were dissolved in DMSO-d6 and CDCl3, respectively. δ shifts were given in ppm downfield from tetramethylsilane, coupling J constants in Hz. Morphology and chemical composition were characterized in a Philips XL30 SEM device equipped with an EDS detector operating at 20 kV. A Bruker FT-IR Tensor II with ATR accessory was used for infrared analysis by obtaining scans in the 4000–400 cm−1 interval, with a resolution of 4 cm−1. Raman spectra in the 3500–200 cm−1 range were obtained in a Thermo-Scientific DXR spectrometer with a 633 nm laser. An Empyrean diffractometer (Cu-Kα radiation source, λ = 1.544 Å) was used for XRD characterization between 10° and 100° in the 2θ scale. Crystallite size was determined with the aid of the Scherrer equation. 13
It must be emphasized that due to limitations in the use of the apparatus, only some nanocatalysts were characterized by HR-TEM in a JEOL JEM-2200FS+Cs microscope with spherical aberration corrector for STEM mode, working at 200 kV. The images were acquired with bright field (BF) and high angle annular dark field (HAADF) detectors. Also, by XPS in a K-Alpha Thermo-Scientific device having a monochromatic Al X-ray source operating at 12 kV.
Electrochemical characterization
A Pine Inst. WaveDriver 20 bipotentiostat with the AfterMath software was used. The reference electrode was of the Ag/AgCl (saturated KCl) type, placed in a Luggin capillary with a membrane at the tip, although potentials have been reported in the Standard Hydrogen Electrode (SHE) scale. The counter electrode was a Pt coil submerged in a separate compartment with a membrane at the tip as well. Catalytic inks containing 10 mg nanocatalyst, 1 ml 2-propanol and 10 μl Nafion solution were sonicated for 30 min 10 μl aliquots were dispersed onto a 0.196 cm2 geometric area glassy carbon, forming the working electrode.
During cyclic voltammetry characterizations, the electrolyte was 0.5 mol l−1 H2SO4 under N2 atmosphere. Cyclic voltammograms (CV) were obtained in the 0.05–1.2 V/SHE interval at a scan rate = 20 mV s−1. For evaluation of catalytic activity for the MOR and the EOR, polarization curves were obtained in 0.5 mol l−1 H2SO4 + 0.5 mol l−1 methanol or ethanol solutions in the same potential interval and scan rate. Mass catalytic activity polarization curves were built considering: i) the Pt loading on the electrodes from the EDS experimental chemical composition of the nanocatalysts; ii) the Pt + Ru loading also from EDS.
Results and Discussion
The Ru-dim and Ru-cym ruthenium compounds have been synthesized in excellent yield. The 1H-NMR spectrum of Ru-dim in Fig. 1a displays signals due to the coordinated arene ring: i) the methylene protons from resonances attributed to the hydroxyethoxy group (H1 and H2, in δ 3.72 and 4.21); ii) two triplets at δ 6.15 and 5.37, assigned to the H4 and H5 aromatic protons, respectively; and iii) the ortho proton (H3) appearing as a doublet at δ 5.55. Moreover, the APT 13C-NMR spectrum in Fig. 1b exhibits the chemical shifts corresponding to the carbon atoms of the aromatic ring, which agree with those previously reported. 19 Nevertheless, it is worth mentioning that the Cipso signal appears at δ 140.11.

Figure 1. (a) 1H (500 MHz) and (b) APT 13C-NMR (127.5 MHz) spectra of Ru-dim in DMSO-d6. Notes: *[(η6-C6H6)RuCl2]2, **unknown compounds.
Download figure:
Standard image High-resolution imageFigure S1 (available online at stacks.iop.org/JES/167/164502/mmedia) shows the 1H-NMR spectrum of the Ru-cym dimer. The aromatic protons of the arene group appear in two AB patterns at δ 5.49 and 5.37, for H4 and H3, respectively. The isopropylic proton occurs as one septet at δ 2.93 (H2) and one doublet at δ 1.29 (H1). The methyl group (H5), coordinated to the arene ring, appears at δ 2.19. 22 In the APT 13C-NMR spectrum (Fig. S2), the peaks due to aromatic carbons at Ru-cym can be observed at δ 101.4 and 96.9, corresponding to C3ipso and C6ipso, respectively. The C4 and C5 resonances in δ 81.5 and 80.9, respectively, confirm that the p-cymene is coordinated. Methine (C2) and methyl (C1) groups are displayed at δ 30.9 and 22.2, respectively. Meanwhile, the peak corresponding to resonances of the methyl group (C7) emerges in δ 19.1. 23 Thus, the spectra in Figs. 1, S1 and S2 confirm the obtention of Ru-dim and Ru-cym.
Figures S3a–S3b show the FTIR spectra of the C and rGO-based supports. Prior to functionalization, both carbon structures basically show only signals due to the ATR (highlighted region between 1800 and 2450 cm−1). After chemical modification with the organometallics, several signals attributed to a number of surface functional groups can be clearly identified. It is worth noticing that high-intensity bands associated to –OH vibrations emerge at the carbon structures functionalized with Ru-dim, which differs from those modified by Ru-cym, most probably due to the hydroxyl group in the aromatic ring within the structure of the former. As can be observed, CRu-dim and rGORu-dim have similar characteristics of groups formed and their intensities. Opposite to such behavior, the intensity of the bands at CRu-cym is lower compared to those of rGORu-cym, indicating variations in the degree of coordination between the two organometallic compounds and the carbon structures.
The Raman spectra of the carbon structures are shown in Figs. 2a–2b. The ID/IG intensities ratio (i.e., the relationship between sp3 and sp2 nanodomains) demonstrate that overall, the graphitic band structure of C and rGO is preserved after functionalization with Ru-dim and Ru-cym. Only in the case of CRu-dim, the 1.68 ID/IG ratio is slightly higher than the 1.41 value of C. Nevertheless, the results in Fig. 2 suggest a constructive rehybridization from the bonding between the Ru compounds and the graphitized structure of C and rGO. 24 It can be mentioned that there are differences between the ID/IG values of this work and those in our previous reports. 13,14 Such variations can be attributed to the laser used during characterization. Spectra in Figs. 2a–2b have been obtained using a 633 nm laser, compared to 532 nm in those references. It has been reported that the excitation due to laser energy has a relevant effect on the ID/IG ratio of nanographite, with the D band becoming more intense as the wavelength is higher. 25 Therefore, the higher ID/IG ratio of the carbon structures in this work can be attributed to an effect of the laser used.
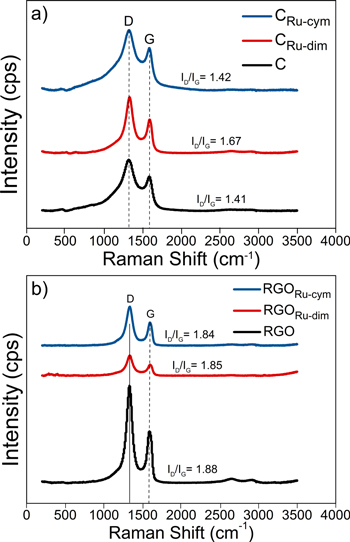
Figure 2. Raman spectra of non-functionalized and functionalized carbon supports: (a) C and (b) rGO-based.
Download figure:
Standard image High-resolution imageThe morphology of Ru-dim and Ru-cym is predominantly that of large irregularly shaped crystals, as reported in recent communications. 13,14 Figures S4a–S4d show a morphology of semi-spherical particles and large crystals at CRu-dim, rGORu-dim, CRu-cym and rGORu-cym due to the carbon nanostructures and the ruthenium organometallic compounds. The chemical composition of the functionalized supports in Table SI shows that a significant amount of Ru (∼13 to 21 wt.%) is contained on the different carbon structures. Contrary to CRu-cym, there is O at rGORu-cym (4.55 wt.%), attributed to the carbon support rather than to the organometallic, which contains no oxygen in its structure.
The XRD patterns of the nanocatalysts supported on C are shown in Fig. 3a. The (002) reflection due to graphitic structures is observed at ca. 26.5° (2θ) at Pt/C, while the (111) and (200) planes of fcc Pt form a broad peak. Moreover, the (220) reflection is of very low intensity, while the (311) peak is more clearly detected. A low intensity peak assigned to a contribution of the (111) and (200) planes can be observed at ca. 10° (2θ). 13 Pt/CRu-dim and Pt/CRu-cym show clear differences in their patterns compared to Pt/C. The (002) peak at Pt/CRu-dim is slightly shifted towards higher 2θ angles and overlaps with a broad shoulder which expands in the 30°–50° 2θ interval. This shoulder is attributed to the merging of the Pt (111) and (200) reflections, along with an overlapping with hcp and fcc Ru planes ascribed to structural interactions with fcc Pt. 14 Such characteristics suggest the formation of Pt-Ru alloyed phases at Pt/CRu-dim. The (220) and (311) peaks are not clearly developed at this nanocatalyst.

Figure 3. XRD patterns of the Pt nanocatalysts supported on non-functionalized and functionalized carbons: (a) C and (b) rGO-based.
Download figure:
Standard image High-resolution imagePt/CRu-cym has similar structural characteristics, with the (311) Pt reflection showing a slightly higher intensity compared to Pt/CRu-dim. Its pattern also indicates the formation of an alloy. Low intensity peaks in the 7°–14° range (2θ) at the patterns of Pt/CRu-dim and Pt/CRu-cym can be ascribed to hcp Ru 26 in good agreement with the observations elsewhere. 13,14
In Fig. 3b, the pattern of the Pt/rGO nanocatalyst also has the (002) reflection of the graphitic structure, as well as the (111), (200), (220), and (311) peaks of fcc Pt. Pt/rGORu-dim shows structural characteristics that resemble those of Pt/CRu-dim, with a broad shoulder between ca. 28° and 48.5° (2θ) also attributed to the formation of a Pt-Ru alloy. Meanwhile, the pattern of Pt/rGORu-cym shows a low intensity (002) peak, which may have been hindered by the interaction with the Ru-cym compound. In the 28°–48.5° interval, several peaks are observed, also suggesting the presence of Pt-Ru alloyed phases, as in the case of the other nanocatalysts.
In order to analyze in more detail the broad peaks between 28° and 48.5° (2θ) at the nanocatalysts supported on functionalized C and rGO, Fig. S5 shows the results of their deconvolution and the effect of support and organometallic compound. At Pt/CRu-dim in Fig. S5a, the contribution of peaks ascribed to (100), (002) and (101) hcp Ru, (111) fcc Ru, as well as (111) fcc Pt have been identified. 27 Figure S5b shows that the peak at Pt/CRu-cym has contributions of (100), (002), and (101) hcp Ru, and (111) fcc Ru. On the other hand, the broad peak at Pt/rGORu-dim is composed of (101) hcp Ru and (111) fcc Ru. Meanwhile, that of Pt/rGORu-cym is formed by (002) hcp Ru, (111) fcc Ru and (111) fcc Pt. Such results provide more evidence of the formation of Pt-Ru alloyed phases at these nanocatalysts.
Therefore, it is clear that the organometallic molecules on the one hand decompose into their elements during the IMH-polyol synthesis process in such a way that Ru is alloyed with Pt atoms being deposited, while at the same time there is an organometallic-support interaction leading to a constructive rehybridization. Data from the Pt (311) reflection of Pt/C, Pt/CRu-cym, Pt/rGO and Pt/rGORu-cym has been used to determine their crystallite size (d). In all cases, the d value falls below 2 nm (Table I). This analysis is not performed on the other nanocatalysts due to the features of their XRD pattern in Fig. 4.
Table I. Physicochemical characteristics of the Pt nanocatalysts.
| Nanocatalyst | d, XRD | d, TEM | C | Pt | Ru | O | Cl |
|---|---|---|---|---|---|---|---|
| (nm) | (wt.%) | ||||||
| Pt/C | 1.23 | — | 65.91 | 32.31 | — | 1.78 | — |
| Pt/CRu-dim | — | 1.9 | 52.89 | 20.62 | 22.24 | 2.89 | 1.36 |
| Pt/CRu-cym | 1.69 | — | 59.71 | 21.12 | 18.06 | — | 1.11 |
| Pt/rGO | 1.35 | — | 72.67 | 24.07 | — | 3.26 | — |
| Pt/rGORu-dim | — | — | 53.17 | 22.22 | 20.15 | 3.35 | 1.11 |
| Pt/rGORu-cym | 1.66 | 1.9 | 65.15 | 13.97 | 17.12 | 3.02 | 0.74 |
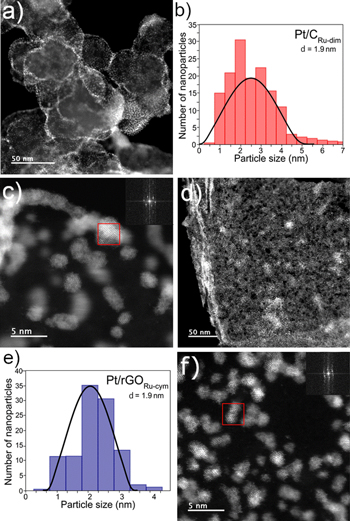
Figure 4. (a)–(c) TEM image, particle size distribution and HR-TEM image of Pt/CRu-dim. The SAED pattern (inset) in (c) shows interplanar distances due to Pt (111) and Ru (101). (d)–(f) TEM image, particle size distribution and HR-TEM image of Pt/rGORu-cym. The SAED pattern (inset) in (f) also shows interplanar distances due to Pt (111) and Ru (101).
Download figure:
Standard image High-resolution imageThe chemical composition (by EDS analysis) of the nanocatalysts is shown in Table I. In Pt/C, the C content is above the nominally expected, with a Pt concentration of 32.31 wt.%. Pt/rGORu-cym has also a Pt concentration that differs from the theoretic value. At the rest of the nanocatalyst, the Pt content is fairly close to 20 wt.%. Pt/CRu-dim, Pt/CRu-cym, Pt/rGORu-dim and Pt/rGORu-cym have Ru concentrations between 17 and 22 wt.%, due to the functionalization of the supports with the compounds. These values have the same tendency as those in Table SI, with more Ru formed from Ru-dim compared to Ru-cym at both carbons, at least from EDS characterization.
It can be mentioned that the relative concentration of Ru at the Pt/CRu-dim and Pt/CRu-cym nanocatalysts in Table I is higher than that of the corresponding supports in Table SI. In the case of Pt/rGORu-dim and Pt/rGORu-cym the concentration is about the same in both Tables. Even more, the Ru content in Table I is slightly higher than those of the equivalent nanocatalysts obtained by the conventional polyol method. 13,14 Such chemical composition demonstrates that Ru is stable after microwave heating has been applied, indicating that time can be significantly shortened if nanocatalysts supported on carbon functionalized with organometallic compounds are synthesized using the IMH-assisted polyol method.
Representative TEM images of two of the nanocatalysts are shown in Fig. 4. The homogeneous dispersion of nanoparticles at Pt/CRu-dim is shown in Fig. 4a. Its average particle size is of 1.9 nm (Table I) as indicated by the histogram in Fig. 4b, providing information about its nanostructured nature not obtained by XRD. Figure 4c is a HR-TEM image of this nanocatalyst and from the area highlighted by the red square the SAED pattern shown as inset has been obtained. The pattern allows for the determination of 0.23 and 0.20 nm interplanar distances which correspond to the Pt (111) and Ru (101) planes, respectively. 13 Meanwhile, the TEM image in Fig. 4d shows the highly homogenous Pt dispersion at Pt/rGORu-cym, resulting in an average particle size of 1.9 nm (histogram in Fig. 4e and Table I). The HR-TEM in Fig. 4f and the SAED pattern (inset) also resulted in 0.23 and 0.20 nm interplanar distances due to Pt (111) and Ru (101), respectively. The characteristics shown by Pt/CRu-dim and Pt/rGORu-cym agree well with the expected formation of Pt-Ru alloys.
The excellent dispersion of Pt nanoparticles at Pt/CRu-dim can also be observed in the HR-TEM image in Fig. S6a. Moreover, the chemical mapping of the nanocatalyst (Fig. S6b) shows an excellent match between Pt and Ru sites. The same analysis can be made for Pt/rGORu-cym in Figs. S7a and S7b. These characteristics further suggest the formation of Pt-Ru alloyed phases.
The XPS spectra of Pt/CRu-dim and Pt/rGORu-cym are shown in Fig. 5. The doublet in the Pt 4f binding energy (BE) region at the nanocatalysts has been deconvoluted for contributions of metallic Pt (Pt0) and PtO (Pt2+) in the 4f7/2 and 4f5/2 states. The spin–orbit splittings are similar at both nanocatalysts (Table SII). In our previous works with similar nanocatalysts, in the 4f7/2 state the BE of Pt0 have been determined as 71.31 and 71.58 eV for Pt/C and Pt/rGO (i.e., non-functionalized supports), respectively. 13,14 In Figs. 5a and 5b), the BE is 72.27 and 72.01 eV in Pt/CRu-dim and Pt/rGORu-cym, respectively. This shift in BE of 0.96 and 0.43 eV compared to non-functionalized supports elsewhere, respectively, can be ascribed to a change in the d-valence band of Pt following an electron transfer from Ru atoms, i.e., an electronic effect. This outcome confirms the formation of Pt-Ru alloys, with Ru centers originated from the organometallic compounds at the functionalized CRu-dim and rGORu-cym.

Figure 5. XPS spectra of Pt/CRu-dim and Pt/rGORu-cym.
Download figure:
Standard image High-resolution imageIn the 280–295 eV region, the Ru 3d and C 1s states overlap. At Pt/CRu-dim (Fig. 5c) the C sp2 hybridization is more intense than the C sp3. The Ru 3d5/d and Ru 3d3/2 states show spin-orbits corresponding to Ru and RuO2 (Ru0 and Ru4+). 13,14,28,29 In the spectrum of Pt/rGORu-cym (Fig. 5d), the deconvolution shows the C sp2 and C sp3 nanodomains, along with several other C-species. Two doublets due to Ru and RuO2 species are also identified. The O1 s region shows the presence of the C=O, C–O, O–C=O, PtO 30 and RuO2 species at Pt/CRu-dim and Pt/rGORu-cym (Figs. 5e and 5f, respectively). The relative concentration (at.%, Table SII) of Pt at Pt/CRu-dim and Pt/rGORu-cym is 10.39 (6.22 PtO) and 11.50 (9.47 PtO), respectively.
Furthermore, the 3p3/2 and 3p1/2 states in the Ru 3p region show spin-orbits assigned to Ru and RuO2 species at the nanocatalysts (Figs. 5g and 5h). The BE of Ru0 in the Ru 3p3/2 state is close in the nanocatalysts (Table SII), indicating a similar metal-carbon interaction during the deposition of Ru atoms. In the same fashion as Pt above, the relative concentration of Ru at the Pt/CRu-dim and Pt/rGORu-cym nanocatalysts is 12.53 (6.63 RuO2) and 25.98 (10.14 RuO2) at.%, respectively. The XPS results thus confirm the presence of Ru0 and Ru4+ after functionalization of the supports. From such surface composition, Pt-Ru alloyed phases are formed. Moreover, when comparing the surface chemical composition of Pt/CRu-dim and Pt/rGORu-cym, two observations can be made regarding the latter: i) it forms more PtO, and ii) its total Ru concentration is higher, with a larger amount of RuO2 developed.
Figure 6 shows the CVs of the nanocatalysts. Overall, the typical regions of Pt-based materials can be distinguished. 14 Pt/CRu-dim and Pt/rGORu-cym have a current density (j) slope in the positive scan starting at about 0.25 V/SHE, with a larger double layer region than the other catalysts (both features more clearly seen at the latter). This behavior has been observed at supported Pt-Ru alloys and is attributed to the formation of Ru oxides, 31,32 which correlates well with the surface chemical composition of these nanocatalysts in Table SII.
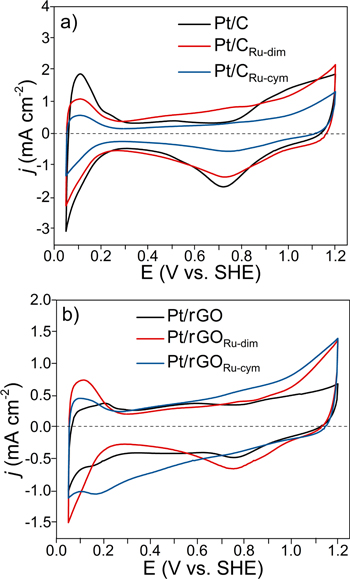
Figure 6. CVs of the Pt nanocatalysts supported on non-functionalized and functionalized (a) C and (b) rGO. Electrolyte: 0.5 mol l−1 H2SO4. Atmosphere: N2. Scan rate: 20 mV s−1.
Download figure:
Standard image High-resolution imageNow, regarding the catalytic activity of the nanocatalysts for the oxidation of the organic fuels, the polarization curves of the MOR in Fig. 7a demonstrates that the mass catalytic activity (considering the Pt loading on the nanocatalysts) of Pt/CRu-dim is clearly higher compared to Pt/C and Pt/CRu-cym. At Pt/CRu-dim, Eonset = 0.43 V/SHE (90 mV more negative than Pt/C), with a peak j in the forward scan jf = 1882.9 mA mgPt −1 (Table II) at a potential shifted to more negative values compared to Pt/C and Pt/CRu-cym. Even more, its ratio of jf to the current density in the backward scan jb (jf/jb) is 2 (Table II), which further demonstrates its excellent behavior for the MOR.
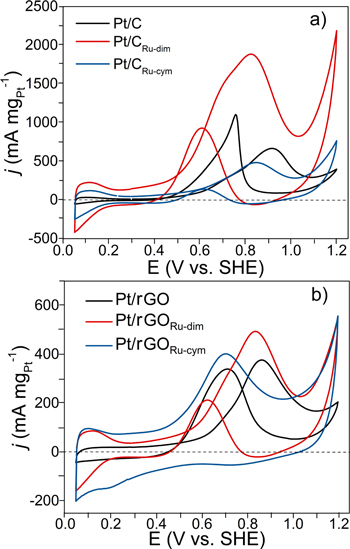
Figure 7. Polarization curves of the MOR considering the Pt loading at (a) Pt/C, Pt/CRu-dim and Pt/CRu-cym; and (b) Pt/rGO, Pt/rGORu-dim and Pt/rGORu-cym. Electrolyte: N2-saturated 0.5 mol l−1 H2SO4 + 0.5 mol l−1 CH3OH. Scan rate: 20 mV s−1.
Download figure:
Standard image High-resolution imageTable II. Electrochemical parameters of the Pt nanocatalysts supported on C and rGO.
| MOR | EOR | |||||
|---|---|---|---|---|---|---|
| Nanocatalyst | Eonset (V) | jf (mA mgPt −1) | jf/jb ratio | Eonset (V) | jf (mA mgPt −1) | jf/jb ratio |
| Pt/C | 0.52 | 665.3 | 0.6 | 0.73 | 129.0 | 1.1 |
| Pt/CRu-dim | 0.43 | 1882.9 | 2.0 | 0.64 | 410.3 | 1.7 |
| Pt/CRu-cym | 0.50 | 483.5 | 3.4 | 0.68 | 152.5 | 1.7 |
| Pt/rGO | 0.62 | 375.6 | 1.7 | 0.70 | 394.9 | 1.5 |
| Pt/rGORu-dim | 0.54 | 494.4 | 2.6 | 0.64 | 449.4 | 1.4 |
| Pt/rGORu-cym | 0.44 | 401.5 | — | 0.50 | 295.6 | 2.0 |
The broad peak at Pt/CRu-dim indicates the oxidation of surface adsorbed species starting at negative potentials, in addition to generating a high jf value also at a more negative methanol oxidation peak potential. This behavior indicates that the combination of ligand/strain and bifunctional mechanism (due to the presence of Ru and RuO2 species) effects plays a relevant role in the catalytic activity of Pt/CRu-dim, with a relatively weak methanol adsorption. 13,33,34 In contrast, even though Pt/CRu-cym catalyzes the reaction at Eonset 20 mV more negative than Pt/C (Table II), it delivers a lower jf also at a more negative methanol oxidation peak potential, a behavior attributed to the bifunctional mechanism, with the ligand/strain effects being rather minor.
On the other hand, over the 0.3–0.7 V/SHE potential interval, i.e., in the region of interest for Direct Methanol Fuel Cells anodes, Pt/rGORu-cym outperforms Pt/rGORu-dim and Pt/rGO (Fig. 7b. At Pt/rGORu-cym Eonset = 0.44 V/SHE, while its jf/jb ratio is very high since jb is close to zero (Table II). Even though its jf is lower than that of Pt/rGORu-dim, the methanol oxidation peak potential is at about 0.71 V/SHE, indicating its improved performance for the MOR among the nanocatalysts supported on rGO. For instance, at 0.6 V/SHE jf is 280 and 140 mA mgPt −1 at Pt/rGORu-cym and Pt/rGORu-dim, respectively, which is a two-fold increase at the former.
Considering that the peak potential of the MOR at Pt/rGORu-cym is the more negative in Fig. 7, but also taking into account its jf value, the performance of this nanocatalyst for the MOR is influenced by a combination of the ligand, strain and bifunctional mechanism effects, with the latter being the most influential. By contrast, the behavior of Pt/rGORu-dim (higher jf, slight shift in MOR peak potential related to Pt/rGO) is rather due to the ligand/strain effects, with less impact of the bifunctional mechanism. 33,34
As mentioned above, the nanocatalysts in this work have been synthesized by the IMH-assisted polyol method, i.e., by heating the samples for only 10 min. This approach brings advantages because less energy is invested to obtain fuel cell nanocatalysts. However, a benefit in terms of their electrocatalytic response must also be achieved. As a comparison, the development of similar nanocatalysts by the conventional polyol method and their evaluation for the MOR has been reported previously. 13,14 At least from the standpoint of these studies, the IMH-assisted polyol method has shown to be advantageous. For instance, the performance for the MOR is enhanced at Pt/CRu-dim by delivering the highest jf among the most performing nanocatalysts here and in those references, at competitive Eonset and jf/jb values. Furthermore, Pt/rGORu-dim performs well compared to the analogous nanocatalyst in Ref. 14, although it is acknowledged that with a more positive Eonset. From the EDS results, the relative concentration of Ru-species is higher in this work than in those references, and this feature is relevant in the electrocatalytic performance of the nanocatalysts obtained by the IMH-assisted polyol method, particularly Pt/CRu-dim.
Figure 8a shows the polarization curves of the EOR at Pt/C, Pt/CRu-dim, and Pt/CRu-cym. In this case, Pt/CRu-dim also shows the highest mass catalytic activity, with Eonset = 0.64 V/SHE and jf = 410.3 mA mgPt −1, giving jf/jb = 1.7 (Table II), which confirms its enhanced catalytic activity for the reaction. The peak potential at Pt/CRu-dim shows no shift towards more negative potentials compared to the two other nanocatalysts, which indicates that its behavior is influenced by the ligand/strain effects, with a negligible bifunctional outcome.

Figure 8. Polarization curves of the EOR considering the Pt loading at (a) Pt/C, Pt/CRu-dim and Pt/CRu-cym; and (b) Pt/rGO, Pt/rGORu-dim and Pt/rGORu-cym. Electrolyte: N2-saturated 0.5 mol l−1 H2SO4 + 0.5 mol l−1 C2H5OH. Scan rate: 20 mV s−1.
Download figure:
Standard image High-resolution imageIn Fig. 8b, Pt/rGORu-cym catalyzes the EOR at Eonset 140 and 200 mV more negative than Pt/rGORu-dim and Pt/rGO, respectively (Table II). The performance of Pt/rGORu-cym for the EOR is the highest in the 0.3–0.75 V/SHE range. At 0.6 V/SHE, jf = 145 mA mgPt −1 at this nanocatalyst, about a three-fold increase compared to Pt/rGORu-dim. As in the case of the MOR, the performance of Pt/rGORu-cym can be correlated to a significant bifunctional effect, with a small contribution of ligand/strain changes.
In this study, higher jf values are obtained from the MOR, with more negative Eonset and oxidation peak potentials, compared to the EOR (Table II). This may not be a surprising outcome since it is well known that Pt-Ru/C alloys are highly active for the MOR, 35–37 as opposed to Pt-Sn/C for the EOR. 38–40 The differences in behavior of the nanocatalysts for both reactions reflects the dissimilarity in adsorption strength of methanol and ethanol at their catalytic surface.
In contrast to the analysis shown thus far, some workers have reported the mass catalytic activity of Ru-containing Pt nanocatalysts taking into account the loading of both noble metals. 41 Even more, the participation of Ru atoms in the CO oxidation reaction has been reported elsewhere. 42,43 Thus, mass catalytic activity plots considering the (Pt + Ru) loading on the electrodes (from the EDS results) are shown in Fig. 9.

Figure 9. Polarization curves considering the (Pt + Ru) loading. (a)–(b) MOR; (c)–(d) EOR. Electrolyte: N2-saturated 0.5 mol l−1 H2SO4 + 0.5 mol l−1 methanol or ethanol. Scan rate: 20 mV s−1.
Download figure:
Standard image High-resolution image
In this approach, Pt/CRu-dim continues to show the highest catalytic activity for the MOR. Pt/CRu-cym, which already has a low performance in the analysis with Pt mass only, this time has an even poorer performance than Pt/C (Fig. 9a). In the case of the nanocatalysts supported on rGO (Fig. 9b), Pt/rGORu-cym activates the reaction at more negative potentials, but evidently its jf value is lower than those of Pt/rGO and Pt/rGORu-dim. It is to be noted that, even though Pt/rGORu-dim has a slightly better performance for the reaction at potentials of ca. 0.7 V/SHE and below, Pt/rGO generates a higher jf.
These plots confirm that: i) Ru-dim functionalizes C in such a fashion that the Ru-species formed promote the MOR at Pt/CRu-dim by a combination of ligand/strain, and bifunctional effects sustaining the generation of a high (Pt + Ru) mass of jf = 903 mA mgPtRu −1, a 1.3-fold increase compared to Pt/C, as shown in Table SIII; ii) Ru-cym modifies rGO, having a clear bifunctional mechanism effect due to the Ru-species at Pt/rGORu-cym, even though its jf is lower than that of the two other nanocatalysts; and iii) the trend of (Pt) or (Pt+Ru) mass catalytic activity is basically the same, Pt/CRu-dim being the most performing nanocatalysts for the MOR in both measurements.
Regarding the EOR, Pt/CRu-dim remains the one with the highest catalytic activity (Fig. 9c), but under this methodology Pt/CRu-cym becomes less active than Pt/C (the same as in the case of the MOR). The jf value of Pt/CRu-dim for the EOR is 200 mA mgPtRu −1, a 1.4-fold increase compared to Pt/C (Table SIII). Meanwhile, regardless of the fact that the Eonset for the EOR is more negative at Pt/rGORu-cym, its jf is lower, while Pt/rGORu-dim and Pt/rGO have a somehow similar behavior over some potential interval, then the latter generates a higher mass current density (Fig. 9d). Thus, similar conclusions can be reached regarding the effect of the organometallic compound on C and rGO for this reaction as those for the MOR in the discussion of the previous paragraph. Overall, Pt/CRu-dim is also the most performing nanocatalysts for the EOR in terms of (Pt + Ru) loading.
After such analysis of (Pt) and (Pt + Ru) mass catalytic activity, the behavior of Pt/CRu-dim for the MOR shows advantageous characteristics for fuel cells applications, surpassing those of the other nanocatalysts. Moreover, the electrocatalytic parameters obtained from the MOR are more relevant than those from the EOR at Pt/CRu-dim. When considering its jf/jb ratio for the MOR in Table II, it is a high value. This is important, considering that this parameter is an indication of an enhanced oxidation of the organic molecule in the forward scan, forming less COads species to react in the backward scan, thus demonstrating a high tolerance to poisoning species. 44,45 Being the nanocatalysts with the highest catalytic activity, Table III shows a comparison of the performance of Pt/CRu-dim for the MOR in acid media with previous reports in the literature, in terms of (Pt) mass activity, in acid electrolyte. The nanocatalyst in this work performs very well, generating a higher jf value with a scan rate of 20 mV s−1.
Table III. Performance for the MOR of several nanocatalysts in acid media.
| Nanocatalyst | Electrolyte/MeOH Concentration | jf (mA mgPt −1) | Scan Rate (mV s−1) | References |
|---|---|---|---|---|
| PtRu/CB@C3N4 | 0.5 mol l−1 H2SO4/4 mol l−1 | ∼1300.0 | Not found | 46 |
| Pt nanobars on Vulcan | 0.1 mol l−1 HClO4/0.5 mol l−1 | ∼510.0 | 50 | 47 |
| Pt–Ru/c-MWNTs | 0.5 mol l−1 H2SO4/0.5 mol l−1 | 1236.0 | 50 | 48 |
| np-PtRuCuW | 0.5 mol l−1 H2SO4/not found | 467.1 | 50 | 49 |
| Pt-Ru nanowires | 0.1 mol l−1 HClO4/0.5 mol l−1 | ∼820.0 | 50 | 50 |
| PtSn/C | 0.5 mol l−1H2SO4/1 mol l−1 | ∼130.0 | 10 | 51 |
| Pt/(RGO)3−(Ti3C2Tx)7 | 0.5 mol l−1 H2SO4/0.5 mol l−1 | 1102.0 | 50 | 52 |
| Pt/CRu-dim | 0.5 mol l−1 H2SO4/0.5 mol l−1 | 1882.9 | 20 | This work |
Conclusions
The ruthenium organometallic compounds with arene ligands proved to be excellent functionalizing agents. The presence of polar groups in their aromatic rings provided the functionalized supports with a significant amount of ruthenium atoms.
The Ru sites formed after functionalization of Vulcan and rGO were stable after synthesis of the Pt nanocatalysts by the IMH-assisted polyol method. Such outcome demonstrated that it is feasible to obtain this type of nanocatalysts in short periods of time with two supports of very different characteristics, indicating that this method can be extensive to a wide range of carbon materials.
The presence of Ru centers originated significant structural modifications of Pt nanoparticles because of alloying, with the development of hcp and fcc Ru reflections, along with the characteristic peaks of fcc Pt, in a feature that contributed to the strain effect.
Ru0 and Ru4+ species were identified at Pt/CRu-dim and Pt/rGORu-cym, along with an important shift in BE of the Pt0 in the Pt 4f7/2 state. Such characteristics promoted the bifunctional mechanism and the ligand effect, respectively.
The nanocatalysts supported on functionalized supports showed higher catalytic activity for the MOR and the EOR compared to those on non-functionalized carbons. A combination of ligand/strain and bifunctional mechanism effects, originated from the surface chemistry modification with the organometallics, was identified as the main factor enhancing their performance. More specifically, Pt/CRu-dim and Pt/rGORu-cym demonstrated a significant promotion in catalytic activity compared to the rest of the nanocatalysts in terms of Pt loading. At the former, the three effects played a relevant role, while at the latter the bifunctional was the most significant, nevertheless delivering lower j values.
The surface chemical analysis identified a higher concentration of Ru and RuO2 at Pt/rGORu-cym compared to Pt/CRu-dim. Nevertheless, the former showed an enhanced performance for the MOR and the EOR. Therefore, the presence of Ru-species plays a significant role in promoting the catalytic activity of the nanocatalysts for the reactions, but larger amounts did not necessarily lead to a better electrocatalytic behavior. The Pt/CRu-dim nanocatalyst was identified as promising material for anodes, specially of Direct Methanol Fuel Cells.
Acknowledgments
The authors thank the Mexican National Council for Science and Technology (CONACyT) for financial support through grant 241526.