

Abstract
A primary barrier preventing repetitive fast charging of Li-ion batteries is lithium metal plating at the graphite anode. One approach toward mitigating Li metal deposition is the deliberate modification of the graphite anode surface with materials demonstrating high overpotentials unfavorable for Li metal nucleation, such as Ni or Cu nanoscale films. This research explores Ni and Cu surface coatings at different areal loadings (3 or 11 μg cm−2) on the electrochemistry of graphite/LiNi0.6Mn0.2Co0.2O2 (NMC622) type Li-ion batteries. Extended galvanostatic cycling of control and metal-coated electrodes in graphite/NMC622 pouch cells are conducted under high rate conditions. Based on the overpotential of Li deposition on metal foil, both Ni and Cu treatments were anticipated to result in reduced lithium deposition. The higher metal film loadings of 11 μg cm−2 Ni- or Cu-coated electrodes exhibit the highest capacity retention after 500 cycles, with mean improvements of 8% and 9%, respectively, over uncoated graphite electrodes. Li plating quantified by X-ray diffraction indicates that the metal films effectively reduce the quantity of plated Li compared to untreated electrodes, with 11 μg cm−2 Cu providing the greatest benefit.
Export citation and abstract BibTeX RIS
The availability of clean and efficient energy storage technologies has become vital for maintaining the environment, advancing societal progress, and establishing energy security. 1 Electric vehicles (EVs) present a large market for energy storage systems, with continued growth predicted. Projections indicate that the number of EVs in the US will reach 18.7 million by 2030, representing a >1,800% increase from the 1 million EVs on the road in 2018. 2 However, a market barrier for EVs continues to be long charging time, which creates a disadvantage compared to vehicles powered by internal combustion engines. Thus, the need to develop Li-ion batteries that can be charged in 10–15 min without sacrificing range, cost, or cycle life is highly desirable for increased consumer adoption and the widespread proliferation of EVs. 3
State-of-the-art Li-ion batteries for powering EVs utilize metal oxide cathodes, graphite anodes, and organic liquid electrolytes. Currently, these battery systems cannot be charged repeatedly under high current densities without compromising delivered energy or lifetime. 1 High current densities can result in excess heat generation, which can accelerate battery side reactions and cause thermal runaway of the system. 1,4 Mass transport limitations hinder full electrode utilization. 5 Most significantly, polarization of the graphite anode results in Li metal plating on the graphite surface when the potential is driven below the Li+/Li0 equilibrium threshold. 6 Electrode charge transfer, electrolyte mass transfer limitations, and Li+ ion solid state diffusion all contribute to the polarization, 7 which is exacerbated at low temperatures and high charge rates. 8
The occurrence of Li plating is problematic for several reasons. Li can react with the electrolyte or become physically isolated, both resulting in the loss of active Li. 8,9 The finite Li inventory can be severely depleted through these mechanisms, resulting in poor capacity retention and limited cycle life. Moreover, Li nucleation and growth occurs via non-uniform formation of dendritic structures. 10,11 Localized areas of deposited Li metal on the electrode surface impede reversible intercalation of Li+ ions in these areas, and extensive growth of dendrites can puncture the separator and short the cell leading to catastrophic failure. 3,12
As Li plating has been identified as the most significant barrier to effective fast charging of Li-ion batteries, efforts toward overcoming this degradation mode have been explored through a diverse set of mitigation approaches. Electrolyte additives to increase low temperature ionic conductivity as well as perpendicularly aligned graphite to reduce Li+ ion tortuosity have been investigated. 1,13 Charging protocols that use optimized current and/or voltage limits to reduce conditions for Li plating are under development using experimental data and/or optimization modeling. 6,14 Patterned laser ablation of a graphite electrode has also been pursued to improve ionic transport by increasing electrolyte access within the anodes. 15 Intermittent, internal heating of the battery to improve the kinetics of mass transport and limit Li plating has been recently demonstrated. 16 Additionally, the use of a small surface acoustic wave applied during charge to limit non-uniform and dendritic Li deposition has been explored. 17
Many of the aforementioned approaches to limit Li plating have shown either limited improvement in capacity retention and cycle life or require significant redesign of the electrochemical cell or its components. In contrast, a recently published work based on interfacial modification of the graphite anode offers the potential for facile incorporation into the manufacturing processes of technologically mature Li-ion batteries. 18 The novel approach suppresses Li plating during fast charge by coating the graphite anode with nanoscale metal surface films of Ni or Cu, with high overpotentials unfavorable for Li metal nucleation. 10,19 Neither Ni nor Cu form an alloy phase with Li at room temperature, 20 and the structural mismatch between Ni or Cu (face centered cubic) and Li (body centered cubic) causes a thermodynamic barrier for Li nucleation. 10,19 Thus, a high overpotential is needed to drive the metal nucleation process on these substrates. The graphite surface modification strategy has several advantages with respect to current and emerging technologies. It utilizes DC magnetron sputtering to deposit the metal films, which is a standard industrial method for producing high quality, reproducible surface films and can be integrated with continuous roll to roll technology for large area electrode fabrication. 21 The surface films contribute insignificant mass to the electrode and thus do not reduce cell energy density. 18 The approach does not require redesign of the graphite anode, new expensive and potentially unstable electrolytes, or the need for high operating temperatures, which can accelerate aging processes. Instead, the surface modification can be integrated with current state-of-the-art anode technology. Results from the previous work demonstrated that the metal surface treatments effectively reduce the quantity of plated Li metal by up to 50% compared to untreated electrodes. 18 Furthermore, fast charging tests were performed using graphite/NMC622 pouch cells. The cells containing Ni-coated graphite electrodes demonstrated improved capacity retention vs control cells using uncoated graphite or those with the Cu-coated graphite electrodes.
In this study, two questions are probed. The first is the benefit of Cu over Ni surface treatments where the overpotential of Li deposition on Cu foil would predict a greater enhancement compared to Ni. 19 The second is the impact of the metal coating loading on the function of the graphite anode within the cell. Graphite anodes with metal film loadings of 3 and 11 μg cm−2 of Cu or Ni were prepared and their physical properties were characterized using scanning electron microscopy (SEM), transmission electron microscopy (TEM), and energy dispersive spectroscopy (EDS). Extended galvanostatic cycling behavior of graphite/NMC622 pouch cells was used to evaluate the capacity retention under fast charge conditions of the various metal coating types. The results provide insight into the metal film type and loading impact on the suppression of Li plating and resulting electrochemical properties under rates consistent with 10 min charge.
Results
Electrode characterization
Energy dispersive spectroscopy mapping
Graphite electrodes were surface coated with Ni or Cu metal with calculated metal film areal loadings of 3 and 11 μg cm−2 of Cu and Ni. The deposited films were characterized using energy dispersive X-ray spectroscopy mapping (EDS) as well as SEM backscatter imaging (SEM-BSE). EDS maps of the electrodes, top-down, (Fig. 1) verified good uniformity of the metal films. EDS maps of the electrode cross sections (Fig. 2) clearly revealed that the deposited Ni and Cu are located at the upper surfaces of the graphite electrodes.

Figure 1. Top-down EDS maps of metal-coated graphite electrodes. (a)–(d) Ni deposited and (e)–(h) Cu deposited on graphite, 3,000× magnification.
Download figure:
Standard image High-resolution image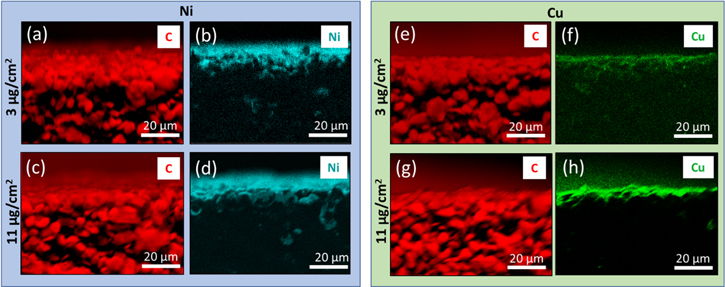
Figure 2. Cross section EDS maps of Ni and Cu deposited on graphite. (a)–(d) Ni deposited and (e)–(f) Cu deposited on graphite, 1,500× magnification.
Download figure:
Standard image High-resolution imageScanning electron microscopy
Scanning electron microscopy (SEM) was used to further characterize the films. Top-down SEM-BSE images of pristine and metal-coated graphite electrodes are shown in Figs. S1 and S2 (available online at stacks.iop.org/JES/167/160503/mmedia) for Ni- and Cu-sputtered films, respectively. The BSE yield dependence on Z enabled clear contrast between pristine graphite and metal-coated graphite. As observed in the images of the electrodes collected from the top-down, the upper surfaces of the electrodes appeared to be uniformly coated with Ni or Cu across the entire electrode surface for each of the film loadings prepared. SEM-BSE images of the electrode cross sections were also collected to determine the uniformity of the sputter deposited metal layers. The cross-sectional SEM-BSE images of pristine graphite and metal-coated graphite are shown in Figs. S3 and S4 for Ni- and Cu-sputtered films, respectively. As shown in the figures, the sputtered films were limited to the electrode surface, and crevices between adjacent graphite particles were not completely covered with the deposited Ni or Cu.
High resolution SEM
The sputter deposited graphite films were characterized using high resolution scanning electron microscopy (HRSEM) at 300kx and 800kx. Top-down HRSEM images and nanoparticle size distributions of metal-coated graphite electrodes are shown in Fig. 3. As observed in the electrode images, there were some cracks in the sputtered films. Qualitatively, the size of these cracks increased with increasing film loading. The size of the sputter deposited nanoparticles also increased with the coated film loading, as summarized in Fig. S5. The images were analyzed using ImageJ software to obtain quantitative values. Ni-sputtered films on graphite were comprised of particle sizes of 4.7 ± 1.1 nm and 6.5 ± 1.5 nm for film loadings of 3 and 11 μg cm−2, respectively. The Cu-sputtered films displayed slightly larger nanoparticle sizes of 5.5 ± 0.9 nm, and 9.9 ± 1.2 nm for the film loadings of 3 and 11 μg cm−2, respectively.
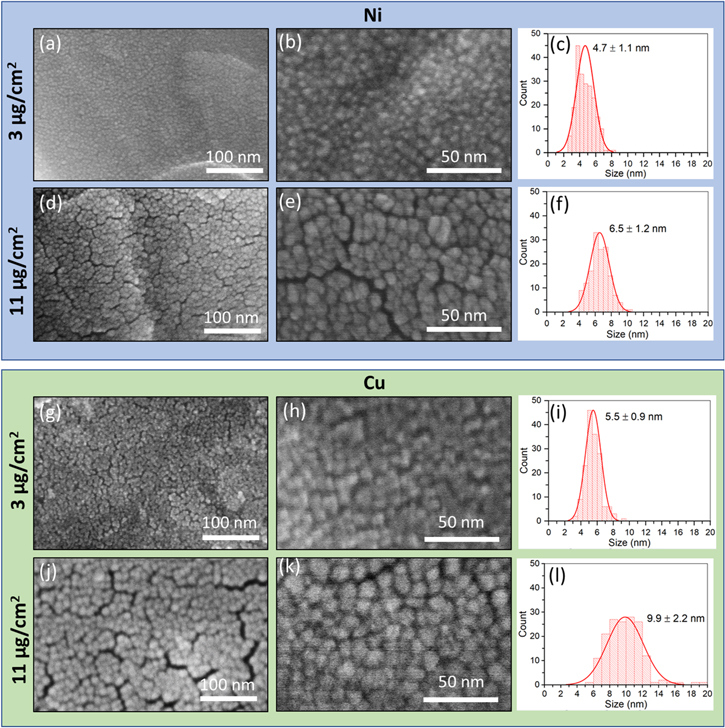
Figure 3. High resolution SEM images and particle size distributions of Ni and Cu deposited on graphite. (a)–(f) Ni deposited on graphite with areal loading of (a)–(c) 3 and (d)–(f) 11 μg cm−2. (g)–(l) Cu deposited on graphite with areal loading of (g)–(i) 3 and (j)–(l) 11 μg cm−2. Magnifications are 300kx and 800kx.
Download figure:
Standard image High-resolution imageFrom the EDS and SEM characterization it is noted that the metal films are confined to the surface of the graphite electrode. Li primarily deposits at the interface between the electrode and separator during battery charging, due to the maximum electrode overpotential in this region, 22,23 and thus the surface films target the region where Li plating is most likely to occur. Furthermore, the depth into the electrode where Li deposition occurs has been shown to depend on the magnitude of the overpotential. Experimentally, cross section SEM images of electrodes have revealed that plated Li is constrained to the upper layers of the graphite electrode, extending ∼10 μm beneath the upper surface. 18 Glow-discharge optical emission spectroscopy depth profiling (GD-OES) experiments also show that the majority of plated Li occurs near the anode/separator interface. 24,25
Selected area electron diffraction
Ni and Cu films were sputtered on graphene covered TEM grids at loadings of 5 μg cm−2 for Ni or Cu for measurement by TEM and SAED. The SAED patterns indicate the polycrystalline feature of both Ni and Cu films and suggest that the surface of Ni- or Cu-sputtered films are partially oxidized to NiO or Cu2O/CuO, respectively, when the films were exposed to air, as shown in Fig. S6. As marked therein, the diffraction rings from the Ni film are attributed to reflections from (111), (200), (220), (222) and (400) planes of NiO (PDF 47-1049), and the (200) plane of Ni metal (PDF 04-0850) also confirmed by the lattice analyses from HRTEM images (Fig. S7). 26 The diffraction rings of the Cu film are attributed to reflections from (111), (200), (220), and (311) planes of Cu2O (PDF 34-1354), the (11-1) plane of CuO (PDF 48-1548), and (111), (200) and (220) planes of Cu metal (04–0836). 26 As shown in previous X-ray absorption spectroscopy and X-ray photoelectron spectroscopy characterizations of the metal-coated graphite films, the metal oxides are reduced to Ni and Cu metal during lithiation and do not reoxidize under the negative electrode voltages. 18
Electrochemical characterization
Galvanostatic cycling
The electrochemistry of the Li-ion pouch cells containing the metal-coated electrodes was tested using galvanostatic cycling. Post formation cycling, the cells were fully discharged at C/10, and charged under a 10 min charge protocol consisting of a 6C constant current step to 4.3 V followed by a constant voltage hold at 4.3 V for the remainder of the 10 min segment. The cells were then discharged at C/3 rate to 3.0 V to determine the initial discharge capacity after the 10 min charge. Further cycling was then performed under a regime of 10 min charge/1C discharge, where every 50 cycles the cells underwent the fast charge protocol followed by discharge at C/3 rate. Areal capacity, capacity retention, and coulombic efficiency plots over 500 cycles for all electrode conditions are shown in Fig. 4. Representative voltage profiles as a function of cycling are shown in Figs. 5 and S8. During the initial cycles the metal-coated electrodes did not increase electrode polarization relative to the uncoated graphite electrode. These findings are in good agreement with the electrochemical impedance spectroscopy (EIS) results which show no evidence of increased resistance. The cells containing graphite electrodes with the lowest metal loadings (3 μg cm−2 Ni or Cu) showed delivered capacities and capacity retention within error of the control group (uncoated graphite anodes). For the cells containing the higher metal film loadings (11 μg cm−2), improved capacity retention was achieved compared to cells with the uncoated electrodes. A comparison of the capacity retention at various cycle numbers for all anode conditions tested is shown in Fig. 6. Further, the Ni- and Cu-coated electrodes with 11 μg cm−2 loadings exhibited mean improvement of 8% and 9% relative to the control group, respectively. The improvement in capacity retention suggests that the metal films with higher loading were able to effectively inhibit Li deposition under the fast charging conditions and thus conserve the supply of cyclable Li in the cell. Notably, variation in the effectiveness of the films was observable at relatively low cycle numbers. At cycle 10 all cell groups exhibited similar capacity retention values of 92%–95%, while by cycle 50 more significant differentiation among groups was evident, with the 11 μg cm−2 conditions exhibiting ∼89% retention compared to ∼85% retention for the other electrode types. At cycle 200, a difference of ∼8% retention was apparent between the higher loading metal films and the other conditions, with this difference maintained through 500 cycles.
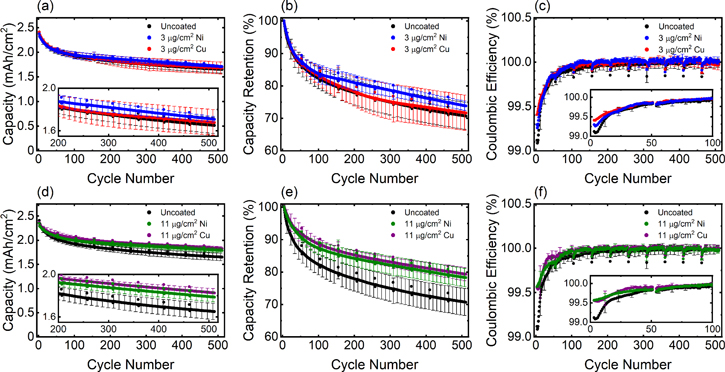
Figure 4. (a), (d) Areal discharge capacities, (b), (e) capacity retention and (c), (f) coulombic efficiencies for cells with NMC622 cathodes and uncoated graphite electrodes or graphite electrodes sputtered with Ni or Cu at different film loadings: (a)–(c) 3 μg cm−2 Ni and 3 μg cm−2 Cu, (d)–(f) 11 μg cm−2 Ni and 11 μg cm−2 Cu. Cells were cycled under 10 min charge/1C discharge protocol with a C/3 discharge every 50 cycles. Error bars represent one standard deviation from the mean (n = 3 cells per electrode type).
Download figure:
Standard image High-resolution image
Figure 5. Representative voltage profiles under 10 min time limited CC CV charge (6C, 4.3 V limit), 1C discharge for graphite/NMC622 cells with (a) 3 μg cm−2 Ni and 3 μg cm−2 Cu films and (b) 11 μg cm−2 Ni and 11 μg cm−2 Cu films,overlaid with uncoated graphite electrodes. Plots show cycle 1 (solid lines), cycle 100 (dashed lines), and cycle 500 (dotted lines).
Download figure:
Standard image High-resolution image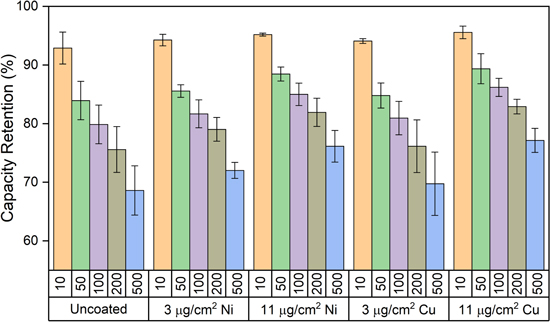
Figure 6. Capacity retention at 10, 50, 100, 200 and 500 cycles under 10 min time limited CC CV charge (6C, 4.3 V limit), 1C discharge protocol for graphite/NMC622 pouch cells with uncoated graphite and metal-coated graphite anodes. Error bars represent one standard deviation from the mean (n = 3 cells per electrode type).
Download figure:
Standard image High-resolution imageInspection of the coulombic efficiency plots within the first ∼50 cycles, as indicated in the insets in Figs. 4c and 4f, reveal higher efficiency for the metal-coated electrodes, particularly for the 11 μg cm−2 Ni or Cu film loadings that exhibit improvement in capacity retention. Beyond 50 cycles, efficiencies increase to approach ∼99.8%–100.0% and are within error for the various electrode groups.
The constant current (CC) and constant voltage (CV) charge contributions to the total charge capacity as a function of cycle number were also examined, using the CC/CV ratio (Fig. 7). For the control, 3 μg cm−2 Ni, and 3 μg cm−2 Cu metal electrode cell groups, the CC step delivered the majority of the charge capacity for the initial 50 cycles, indicated by a ratio >1. After 50 cycles, greater capacity was delivered during the CV step. There were no statistical differences in the CC/CV capacity ratio among cells with uncoated graphite electrodes and cells containing the lower loadings of Ni- and Cu-coated electrodes at any point during cycling. In stark contrast, the CC/CV ratio for 11 μg cm−2 Ni- and Cu-coated anode conditions did not drop below 1 until 100–200 cycles. Notably, these cells exhibited statistically higher CC/CV capacity ratios compared to the other groups, consistent with the capacity retention results.
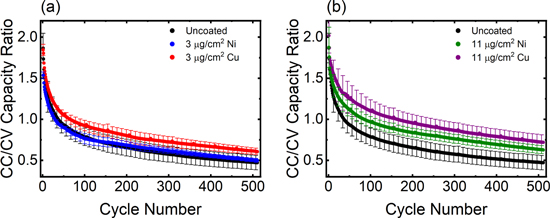
Figure 7. (a), (b) CC/CV charge capacity ratios during the 10 min fast charge protocol for pouch cells containing (a) 3 μg cm−2 Ni- and 3 μg cm−2 Cu-coated anodes and (b) 11 μg cm−2 Ni- and 11 μg cm−2 Cu-coated anodes, overlaid with uncoated anode data.
Download figure:
Standard image High-resolution imageGalvanostatic cycling of cells at lower rate was also performed. Cells were discharged and charged at C/2 rate for 200 cycles for uncoated and coated (5 μg cm−2 Ni or Cu) electrodes and is presented in Fig. S9. After 200 cycles at C/2 rate, the capacity retention of the three groups was ∼92%. In contrast, when cycled under the 10 min charge rate, by 200 cycles the capacity retention ranged from ∼78% for the control cells to ∼86% for the cells with the metal-coated electrodes at the higher loading level (Fig. 4).
Electrochemical impedance spectroscopy
Impedance response of pouch cells containing metal-coated graphite electrodes was characterized both after formation cycling and after extended (500×) cycling (Fig. 8). The collected impedance spectra were fit to an equivalent circuit model that is a modified version of the Randles circuit, 27 with multiple sets of parallel resistor—constant phase elements in series (Fig. 8e). An inductor component (L1) models the inductance behavior, which arises from the cell connections and the geometry of the electrodes. 28 The first resistor, R1, represents DC electrolyte resistance as well as ohmic resistances of the cell components. R2 and CPE1 in the first RQ element and R3 and CPE2 in the second RQ element are used to fit the high to medium frequency semicircular features in the Nyquist plot and correspond to the ionic resistances and capacitances of the surface films on the electrodes within the cell. 28 The fourth resistor (R4), third constant phase element (CPE3), and Warburg element (Zw) were used to fit the middle to low frequency range and approximate the charge transfer resistance, double layer capacitance, and solid state diffusion of Li+ ions in the electrodes. Equivalent circuit fit results are tabulated in Tables SI and SII, and the magnitudes of R2, R3, R4 along with the sum of these values are plotted for each metal type in Figs. 8c, 8d. The EIS fitting results indicate that prior to cycling, the total of the ionic and charge transfer resistances (R2, R3, R4) for all electrode types were 13–15 Ω·cm2 with values within error (n = 3), indicating that the metal films do not have a significant effect on the ionic resistance of the electrodes. These results are supported by previous studies which demonstrate facile Li+ ion (de)intercalation into graphite electrodes through nano-films of Cu 29–32 and Ni. 33,34 The resistance of the cells increased after cycling by ∼40%, consistent with cell aging. 35 As also observed prior to extended cycling, there were insignificant differences in the total resistances for cells with the various anode types after the fast charge cycling.

Figure 8. (a), (b) Impedance spectra of representative pouch cells (a) after formation cycling and (b) after 500 fast charge cycles. (c), (d) Equivalent circuit fit results as a function of electrode type for R2, R3, R4 and their sum. (e) Equivalent circuit model used to fit impedance spectroscopy data.
Download figure:
Standard image High-resolution imageLi plating experiments
To examine the effectiveness of the various metal films at suppressing Li deposition, half cells containing uncoated and metal-coated graphite electrodes were subjected to voltage holds of −20 and −30 mV after being fully lithiated. Under these electrochemical conditions, the voltage of the electrode is below the equilibrium potential for Li plating, and the effectiveness of the metal films at increasing Li deposition overpotential can be probed. Post-testing, the electrodes were recovered under inert atmosphere and X-ray diffraction (XRD) was used to quantify the amount of crystalline Li deposited on the electrode. This experimental protocol was previously established as a useful tool for quantifying lithium deposition. 18 Figure 9 shows the normalized Li metal plating capacities and normalized Li(110)/Cu(220) peak area ratios from XRD at −20 and −30 mV potential holds. For the Ni films, XRD measurements indicated reduced quantity of Li plating with the greater benefit achieved with the 11 μg cm−2 Ni loading, demonstrated by ∼20%–25% decrease in deposited Li vs the untreated electrodes by XRD. Similarly, the 11 μg cm−2 Cu-coated graphite electrodes exhibited Li plating suppression up to ∼80%, while the lower loading condition was not as effective. Notably, among the higher loading coatings, the Cu films suppressed lithium plating more effectively the than Ni films. The presence of plated lithium is in agreement with previous reports. 8,11,14 The Li plated on an electrode surface can become physically isolated and electrochemically inactive such that the finite quantity of active Li ions in the Li-ion cell is depleted, resulting in capacity loss. 8,9
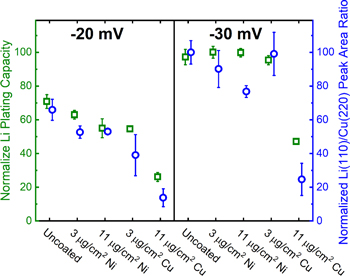
Figure 9. Normalized Li plating capacities and normalized Li(110)/Cu(220) peak area ratios from XRD measurements for lithiated electrodes subjected to voltage holds of −20, and −30 mV.
Download figure:
Standard image High-resolution imageSEM imaging of electrodes post cycling
Electrodes were harvested from cycled pouch cells in the charged state for each cell cycled 500× under the 6C/1C condition and imaged using SEM. Secondary electron SEM imaging of the electrodes reveals significant Li metal in the form of irregular, globular-shaped deposits (Fig. S11). The findings verify Li plating as a significant capacity fade mechanism in these cells under the extreme fast charging rate, in agreement with previous reports. 8,11,14 The plated Li can become physically isolated and electrochemically inactive, the finite quantity of active Li ions in the Li-ion cell is depleted, resulting in capacity loss. 8,9 No differences in quantity of plated Li can be determined among the different electrode types because the SEM images only capture the upper surface of the Li deposits. However, as discussed in section 2.3, XRD measurements of electrodes subjected to negative voltage holds establish that the electrodes with the nanoscale metal films do suppress the quantity of plated Li compared with uncoated graphite electrodes.
Scanning electrochemical microscopy measurements
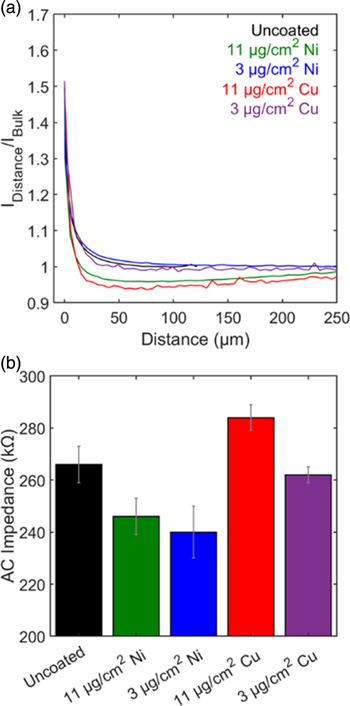
The surface conductivity of the electrodes was probed using Scanning Electrochemical Microscopy (SECM) where measurements were collected on the uncoated and metal coated electrodes (Figs. 10, S12). SECM is a powerful tool that has been effectively used to provide information on the comparative electrochemical properties of surfaces. 36 While SECM has been utilized frequently for monitoring corrosion processes, 37,38 it has been recently become a technique of interest in battery research. 39 SECM approach curves were measured in DC mode, with ferrocene methanol used as a redox mediator. The current response upon approaching the probe to the sample surface correlates with the conductive or insulating nature of the surface. 40 All five approach curves (Fig. 10a) show an increase in current above the steady state upon approaching the surface of the electrode, consistent with the behavior of materials with a conducting surface. 39,41–44 These findings demonstrate that the graphite surface is conductive in its untreated state, and remains conductive after the deposition of the Cu or Ni films.
Figure 10. Scanning Electrochemical Microscopy (SECM) measurements of undischarged electrodes with and without deposited nanoscale metal films. (a) Approach curves (b) Average surface impedance.
Download figure:
Standard image High-resolution image
To gain more quantitative insight into the relative conductivity of the surfaces before and after metal deposition, AC impedance maps were collected on all five anode types. AC measurements can be investigated without the addition of a redox mediator, 45,46 and can thus be employed with a simple solvent system. AC SECM utilizes an applied potential and measures the AC response and provides a spatial distribution of impedance over the sample area. 47–50 To ensure reliable comparisons between the various electrode groups, three AC impedance maps were collected over a large area of each electrode and were averaged (Figs. 10b and S12). Compared to the untreated graphite, the nickel film increased the surface conductivity slightly as evidenced by reduced impedance (246(7) kΩ for 11 μg cm−2 Ni-coated graphite and 266(7) kΩ for untreated graphite). Interestingly, there was no significant difference between the surface impedances of the 3 μg cm−2 and 11 μg cm−2 Ni treated electrodes (240(10) kΩ and 246(7) kΩ, respectively). On the other hand, the Cu film resulted in marginally lower surface conductivity where the 11 μg cm−2 Cu-coated graphite had an average impedance of 284(5) kΩ. This increase was only observed for the thicker coating as the 3 μg cm−2 Cu graphite had an average impedance of 262(3) kΩ, similar to uncoated graphite.
Discussion
Materials with high overpotential to Li plating hold promise to prevent Li metal deposition during charge. In particular, Ni and Cu metal foils have overpotentials unfavorable for Li deposition due to the large thermodynamic cost associated with heterogeneous nucleation of Li metal on these surfaces. 10,19 Notably, the surface coated graphite electrodes are not metal foils and the loading of the metal films and associated nanostructure may play a role in the efficacy of the metal coatings at suppressing Li plating. Investigation of the impact of anode metal film loading on the extreme fast charging capability reveals significant differences in the retained capacity after extended cycling under high rate. For cells containing anodes with a low metal film loading (3 μg cm−2 Ni or Cu), mean capacity retention values at 500 cycles were within error of the uncoated graphite electrode. However, for cells with ~4× greater metal film loading (11 μg cm−2 Ni or Cu), capacity retention was improved by 8% and 9%, respectively, compared to the control group. These findings are in good agreement with the Li-plating experiments, which demonstrated that the higher metal film loadings were more effective at suppressing Li plating compared to their lower loading counterparts. Moreover, the Li-plating results revealed that Cu coatings were slightly more effective than the Ni coatings. This result could be rationalized by considering the varying overpotentials afforded by each metal. Previous studies of Li metal nucleation overpotential indicated that Ni and Cu metal foils exhibit overpotential values of −30 and −40 mV, respectively. 10
In a previous report on the use of nanoscale Ni and Cu films at suppressing Li deposition, the influence of the metal coatings on the formed solid electrolyte interphase (SEI) was probed. 18 X-ray photoelectron spectroscopy (XPS) was used to thoroughly characterize the solvent decomposition products on control graphite, 10 nm Ni-coated graphite (5 μg cm−2 Ni) and 10 nm Cu-coated graphite (5 μg cm−2) after formation cycling using C 1s, O 1s, F 1s, and Li 1s spectra. On all three electrode types, fitting results revealed carbonate, carboxylate, ether, alkoxy, and LiF species that comprised the SEI as well as PVDF binder and lithiated carbon for the underlying electrode. 18 No major differences in the quantities or relative percentages of these SEI species were observed among the three electrode types. Thus, the overall chemistry of SEI species is not significantly altered by the metal films and thus is not anticipated of have an appreciable impact on the electrochemical behavior.
The differences in capacity retention improvement afforded by the metal coatings of different loadings are correlated to the variation in the nanostructures of the films. Notably, the sputter deposited nanoparticles that form the 3 μg cm−2 Ni or Cu loading films have diameters of 4.7 ± 1.1 nm and 5.5 ± 0.9 nm, respectively and are approximately equivalent to the 5 nm film thickness, indicating that the film is comprised of a single layer of nanoparticles. In contrast, the higher loading films have considerable overlap of nanoparticles, with particle sizes of 6.5 ± 1.5 nm and 9.9 ± 2.2 nm comprising the 11 μg cm−2 Ni or Cu films, respectively, with AFM measured film thicknesses of 20 nm. The overlap of the deposited nanoparticles in the high loading films is anticipated to enable more complete coverage of the graphite surface and may permit more effective overpotential control for suppression of Li plating during extended cycling. Although the results demonstrate that the higher loadings of surface metal films on graphite anodes offer enhanced Li plating suppression, there will exist a thickness limit. Loadings greater than a critical thickness will begin to impede Li+ ion diffusion and may even induce Li plating through excessive transport inhibition. 30–33 Balancing the tradeoffs between Li plating suppression and facile mass transport through the metal films will be explored in future work.
The possibility of the Cu and Ni metal coatings increasing the electronic conductivity of the anode has also been considered as an additional mechanism for reducing capacity fade during fast charging. The conductive properties of thin metal films are known to be strongly dependent on both the size and packing density of the nanoparticles that comprise the films. 51–55 Quantum size effects occur at the nanoscale, where the number of overlapping atomic orbitals in the valence and conduction bands decrease, causing the width of the bands to narrow. 56 Thus, nanoparticles have a wider band gap compared to the equivalent bulk material and demonstrate lower electronic conductivity. 57
When considering the conductivity of thin films, the packing density of constituent metallic nanoparticles is also important because the probability of electron hopping between metallic islands increases with decreasing distance between the clusters. 51 Experimental studies of films of Au, Cu, Ag and Fe with thicknesses between 6–350 nm indicate that for films less than 40 nm thick, resistivity is high due to separation of conducting domains. 58 However, between 40–120 nm a sharp rise in conductivity occurs as conducting grains overlap and percolation threshold in the film is reached. 58 Similarly, measurements of Ag thin films indicate high electronic conductivity for thicknesses above 30–40 nm as an interconnected particle network forms. 59 Results on Cu thin films have indicated that the sharp increase in film conductivity occurs at ca. 10 nm, where discontinuous, isolated islands at thicknesses below these values are the cause of high resistance. 60
Conductivities of metallic thin films are also dependent on the electron scattering at the grain boundaries between crystallites and the mean free path of the electron (MFP, Cu = ∼40 nm, Ni = ∼6). 61,62 When the grain size becomes less than the MFP, the conducting electrons experience more grain boundaries and associated scattering events as they attempt to travel the MFP distance, increasing the resistivity. The size-dependence on Ni and Cu conductivities is well reported, with conductivity decreasing at and below the MFP-length particle sizes. 63–65 For Cu films, an increase in thickness from 10 to 15 nm resulted in a 2× increase in conductivity, where the value continued to increase until ∼41 nm, 60 which is approximately the mean free path of Cu. 60,66
Experimental SECM results suggest that the conductive nature of the graphite surface is largely maintained upon metal film deposition. Notably, deposition of the thicker Cu films resulted in slightly lower (ca. 7% lower) surface conductivity while the Ni film resulted in 7%–10% higher conductivity. These differences are not observed in the cell level EIS data, suggesting that the variation in conductivity is confined to the anode surface and is too minor to be observed by bulk measurement. 67,68 Furthermore, despite apparent differences in surface impedance, the two types of metallic films both lead to similar improvements in cyclability. Thus, the results illustrate that reduction in lithium deposition due to the presence of the metal surface coatings improves capacity retention under fast charge rates.
Conclusions
The use of nanoscale metal films deposited on the surface of graphite electrodes was demonstrated to reduce capacity fade under repetitive fast charge conditions. The benefit was dependent on metal film loading for both Ni and Cu film types. Extended galvanostatic cycling of metal-coated graphite electrodes in graphite/NMC622 pouch cells revealed that 11 μg cm−2 Ni- or 11 μg cm−2 Cu-coated electrodes enabled enhanced capacity retention under fast (10 min) charge, with mean improvement of 8% and 9%, respectively, over uncoated graphite anodes after 500 cycles. 3 μg cm−2 Ni or Cu films did not improve capacity retention, suggesting that there is a minimum film loading necessary for effective overpotential control. Li plating experiments support these findings, as the higher loading metal films generally exhibited enhanced Li plating suppression compared to that of lower loading. Notably, TEM characterization shows that lower film loadings have nanoparticles with diameters approximately equivalent to the film thickness, indicating that the film is comprised of a monolayer of nanoparticles. In contrast, higher loadings exhibit considerable overlap of nanoparticles. The overlap of the deposited nanoparticles in the higher loading films is anticipated to enable more complete coverage of the graphite surface, permitting more effective overpotential control for the suppression of Li plating. The findings underscore the important role of functional surface coating nanostructures on Li-ion battery anodes cycled under aggressive conditions.
Experimental
Electrode preparation
Graphite electrodes were prepared with a 90:3:7 wt.% ratio of natural graphite (SLC 1506 T, Superior Graphite), carbon black (Super P, Timcal) and polyvinylidene fluoride (PVDF) in N-methyl-2-pyrrolidone (NMP), respectively. The slurry mixture was cast onto Cu-foil to achieve an active loading of ∼8.8 mg cm−2. Cathodes were prepared with a 90:5:5 wt.% ratio of NMC622 (Targray), carbon black (Super P, Timcal) and PVDF in NMP cast onto Al-foil to yield an active loading of ∼16.9 mg cm−2. Anodes and cathodes were cut to size and pressed.
Direct current (DC) magnetron sputtering was used to deposit nanoscale films of Ni and Cu with a Kurt J. Lesker 75 PVD sputtering instrument located at the Center for Functional Nanomaterials, Brookhaven National Laboratory. Nanoscale depositions, yielding metal-coated loadings on graphite of 3 and 11 μg cm−2 for Ni and Cu, were consistently achieved from calibration curves of deposited film thickness vs deposition time. The 3 and 11 μg cm−2 loadings correspond to estimated metal thicknesses of 5 and 20 nm, respectively.
Metal film characterization
Atomic force microscopy (AFM) measurements were collected on a Park NX-20 in non-contact mode. Metal film deposition thickness was verified from ultra-flat SiO2 wafers sputtered alongside the graphite electrodes and by AFM analyses. To create a measurable step height between the metal film and the SiO2 substrate, sections of the surface films were removed. AFM scanning was then performed on the step region to determine the thickness of the deposited films (Fig. S13). For Ni, the average thicknesses for nominal 5 nm and 20 nm films were 5.0 ± 0.5 and 19.5 ± 0.8 nm, respectively (n = 3) (Table SIII). For Cu, the average thicknesses for nominal 5 nm and 20 nm films were 5.3 ± 0.8 nm and 19.9 ± 0.6 nm, respectively (n = 3). The surface films are not a continuous metal layer but are instead comprised of nanograins and thus have some inherent porosity. The measured thicknesses from AFM were converted to areal loadings using the density of the major phase identified by selected area diffraction in section 2.1.4 (NiO for as-sputtered Ni films, Cu2O for as sputtered Cu-films) to calculate an estimated loading of Ni or Cu in μg cm−2 units. The estimated areal loadings using this method for 5 nm and 20 nm Ni or Cu films are 3 and 11 μg cm−2, respectively.
Scanning electron microscopy (SEM) images with backscattering electron detection were collected using a high-resolution SEM (JEOL 7600F) instrument. Energy dispersive X-ray spectroscopy (EDS) was measured using a JEOL JSM-6010PLUS instrument. High-resolution SEM images at 300kx and 800kx magnification were collected using a Hitachi 4800 instrument. The JEOL 7600F and Hitachi 4800 instruments are located at the Center for Functional Nanomaterials, Brookhaven National Laboratory. Particle size analysis of Ni or Cu film sputtered on graphite were collected from the high-resolution SEM images with 800kx magnification and conducted using ImageJ software where 150 ∼ 200 particles were used for the analyses.
Transmission electron microscopy (TEM) and selected area electron diffraction (SAED) for Cu film with 5 μg cm−2 film loading sputtered on TEM grid with graphene substrate were acquired with a JEOL 1400 TEM using an accelerating voltage of 120 kV. TEM, high-resolution TEM and SAED for Ni film with 5 μg cm−2 film loading sputtered on TEM grid with graphene substrate were acquired with FEI Talos F200X using an accelerating voltage of 200 keV. Both instruments are located at the Center for Functional Nanomaterials, Brookhaven National Laboratory.
Electrochemical measurements
Single layer pouch cells were assembled with graphite and NMC622 electrodes balanced to a 1.19 N/P ratio. The cells were prepared with 1.0 M LiPF6 30:70 EC:DMC + 2% vinyl carbonate (VC) electrolyte and polypropylene separator. Post assembly, a tap charge and four formation cycles at C/10 rate between 3.0–4.3 V were completed prior to additional testing. The cell test protocol included 1C discharge and a 10 min charge using a 6C constant current to 4.3 V followed by a constant voltage hold at 4.3 V. Cells were tested in triplicate including control (uncoated) anodes and anodes coated with 3 μg cm−2 Ni, 11 μg cm−2 Ni, 3 μg cm−2 Cu, and 11 μg cm−2 Cu. Impedance (PEIS) after formation and after extended cycling was measured using a BioLogic VSP Potentiostat in the frequency range of 1 MHz to 10 mHz with a 5 mV sinus amplitude. All electrochemical testing was performed at 30 °C. Li plating experiments were performed in coin cells with a Li metal counter electrode. Cells underwent one cycle at C/10 rate and then a second discharge at C/10 to 0.005 V, followed by an additional discharge at C/100 rate to 0 V to ensure complete graphite lithiation. The cells were then held at voltages of −20 and −30 mV for 6 h. Duplicate cells were measured for each condition. Post electrochemical testing, cells were disassembled under an inert atmosphere, electrodes harvested, rinsed, and dried. A XRD sample holder containing a beryllium window and O-ring seal was used to maintain the graphite electrodes under an inert atmosphere. A Rigaku SmartLab X-ray diffractometer with Cu Kα radiation and Bragg−Brentano focusing geometry was used for XRD measurements.
Scanning electrochemical microscopy (SECM) approach curves and AC impedance maps were collected with a BioLogic M470 scanning probe workstation. All approach curves were collected in DC mode with aqueous 1 mM ferrocenemethanol/100 mM KCl electrolyte; all impedance maps were collected in AC mode in water (>18 MΩ·cm). All measurements used a 10 μm Pt probe working electrode, a Pt wire counter electrode, and a screen-printed Ag/AgCl reference electrode.
Acknowledgments
This work was supported by the U. S. Department of Energy Office of Energy Efficiency and Renewable Energy under the Advanced Battery Materials Research program, award DE-EE0007785. Method development and the electron microscopy studies were supported by Center for Mesoscale Transport Properties, an Energy Frontier Research Center supported by the DOE-BES, under award #DE-SC0012673. The pouch cell assembly line was supported under award 75039 from the New York State Energy Research and Development Authority (NYSERDA) and award 76890 from the New York State Department of Economic Development (DED), which were provided as matching funds to the Center of Mesoscale Transport Properties. NYSERDA has not reviewed the information contained herein, and the opinions expressed do not necessarily reflect those of NYSERDA or the State of New York. Any opinions, findings, conclusions, or recommendations expressed are those of the author(s) and do not necessarily reflect the views of the DED. This research used resources of the Center for Functional Nanomaterials, which is a U.S. DOE Office of Science Facility, at Brookhaven National Laboratory under Contract No. DE-SC0012704. The authors acknowledge Dr. Ming Lu at the Center for Functional Nanomaterials at Brookhaven National Laboratory for his assistance with DC magnetron sputtering depositions. EST acknowledges the William and Jane Knapp chair for Energy and the Environment.