

Abstract
A novel Ti/PbO2-Bi-PTh composite electrode was successfully prepared by electrodeposition and applied in electrochemical degradation of phenol. The Ti/PbO2-Bi-PTh electrode was characterized by XRD, SEM, AFM, LSV, CV and EIS. Results showd that the electrode has a fine and compact surface structure, higher oxygen evolution potential (OEP, 2.42 V) and low charge transfer resistance (51.00 Ω). The electrode also exhibited excellent electrochemical oxidation activity on the degradation of phenol (1000 mg l−1) with degradation efficiency of 100% and TOC removal rate of 93.58% achieved in 60 min and 180 min, respectively. In addition, possible mechanism of phenol degradation on the electrode was proposed by analyzing the intermediate products with GC-MS. Noticeably, the Ti/PbO2-Bi-PTh electrode displayed excellent stability and high electrocatalytic performance after 10 cycles, indicating its promising application in the phenolic wastewater treatment.
Export citation and abstract BibTeX RIS
Phenol is a highly toxic pollutant in wastewater discharged from petrochemical industry and it causes irreversible damage to the environment and human body even at very low concentrations. 1,2 Many methods have been developed for the treatment of phenolic wastewater, including physical, 3 biological treatment, 4 chemical 5,6 and advanced oxidation processes (AOPs). 7,8 To date, AOPs have been developed because of its high efficiency and mild reaction conditions. Generally, AOPs include wet oxidation, 9–11 photochemical oxidation, 12 Fenton process 13,14 and electrochemical oxidation (EO). Among them, the EO has been widely studied due to its mild reaction conditions, good controllability and no secondary pollution during electrolysis process. 15–17
However, the EO method mainly depends on the properties of electrode material which significantly affect the efficiency of wastewater treatment. 18 Thus, the preparation of ideal electrode materials is the key of the EO process. Recently, kinds of electrode materials have been investigated intensively such as IrO2, 19 RuO2, 20 SnO2, 21 PbO2, 22 etc. PbO2 electrode has been treated as the most promosing electrode because of its stronger corrosion resistance, higher oxygen evolution potential and higher current passing capacity compared to others. 23 However, the application and development of PbO2 electrodes are greatly hindered by the low electrooxidation activity and low current efficiency. 24 Hence, it is highly desirable to improve the electrooxidation ability and efficiency of PbO2 electrode.
In particular, reports have demonstrated that the electrochemical property of the PbO2 electrode is greatly affected by the addition of dopants. 25,26 For example, Correia et al. 27 have employed electrochemical oxidation to degrade the pesticide tebuconazole (TBC) using Bi doped PbO2 electrode. The SEM images show that the Bi-PbO2 electrode presents smaller grain size and more active sites than that of the untreated PbO2 electrode. The total organic carbon (TOC) removal rate of 68% can be reached (1.21 times higher than that of the traditional PbO2 electrode) with a current density of 40 mA·cm−2. Yao et al. 28 also have found the increasing degradation rate of acetamiprid by using the Yb-doped PbO2 electrode. In addition, Ce, 15 Ni, 29 Co3O4, 30 ZrO2 31 and Sm2O3 32 have also been used for the surface coating of PbO2 electrode. All these dopants can significantly enhance the electrochemical properties of the electrode. 33,34
Lately, conductive polymers have attracted much attention owing to their excellent properties including high electric conductivity, high thermal stability and good environmental adaptability. 35 The incorporation of conductive polymers into inorganic materials such as TiO2, 36 MnO2, 37 ZnO, 38 SnO2 39 not only can make use of the excellent electric conductivity of the conductive polymers, but also maintain the unique physicochemical properties of the inorganic materials. 40 Rosario et al. 41 have doped poly(3,4-ethyldioxythiophene) (PEDOT) into MnO2 by electrodeposition and the obtained electrode shows excellent electrochemical performance. In our previous study, PPy modified RuO2 electrode has been developed for the degradation of reflow wastewater (COD removal rate of 93.7%) with the electrode resistance being reduced from 56.2 Ω to 7.6 Ω and the electrode life span being extended from 267 d to 391 d. 42
Owing to superior thermal stability, high charge storage capacity and stable chemical properties, polythiophene (PTh) can be considered as an desirable conductive polymer which has great potential application in electrode preparation. 43–45 Therefore, PTh can be used to increase the conductivity of the conventional PbO2. On the other hand, Bi doping can promote PTh deposition on surface of PbO2 electrode and reduce the cracks on the crystal surface. Hereby, in this report, Bi and PTh are combined to improve the stability, conductivity and electrocatalytic activity of the PbO2 electrode. The prepared Ti/PbO2-Bi-PTh electrode is further used for electrochemical degradation phenol wastewater.
Material and Methods
Reagents
Chemical reagents (Pb(NO3)2, C4H4S, NaOH, H2C2O4, [BMIM]BF4, Bi(NO3)3, NaF, Na2SO4, HNO3 and C6H5OH) were purchased from Shanghai Macklin Biochemical Technology Co., Ltd. (China). Titanium sheets (99.7%) were purchased from FuMeiTe metal materials company (Guangdong, China). The above chemicals were used without further purification.
Titanium substrate pretreatment
Before electrodeposition, the titanium substrates with size of 5.0 cm × 2.0 cm × 1.0 cm were polished with sandpaper to remove the oxide film on the substrate surface. The substrates were degreased in NaOH (35 wt%) for 1 h at 80 ℃. Then, the Ti substrates were etched in oxalic acid solution (15%) for 2 h at 80 ℃. The treated titanium substrates were washed with deionizing water and dried in oven and then sealed in anhydrous ethanol solution for further study.
Preparation of Ti/PbO2-Bi-PTh electrode
The Ti/PbO2-Bi-PTh electrode was prepared by co-doped with traces of Bi and PTh using electrochemical deposition. The electrodeposition solution was prepared by mixing of 0.5 M Pb(NO3)2, 2 mM Bi(NO3)3, 0.05 M C4H4S and 0.1 M [BMIM]BF4 with its pH adjusted to 2.0 by 1.0 M HNO3 solution. The Ti/PbO2-Bi-PTh electrode was deposited in the above electrodeposition solution with current density of 20 mA cm−2 at 35 ℃ for 30 min. Afterwards, the Ti/PbO2-Bi-PTh electrode was thoroughly washed with distilled water. For comparison, Ti/PbO2 electrode was fabricated. In addition, the electrodes of Ti/PbO2-Bi and Ti/PbO2-PTh were manufactured by the same procedrue in the absence of thiophene or Bi(NO3)3 during the electrodeposition process. 46
Analytical methods
Structure characterization
The crystalline state of the prepared Ti/PbO2, Ti/PbO2-Bi, Ti/PbO2-PTh and Ti/PbO2-Bi-PTh electrodes were characterized by XRD-7000 (Japan; Cu Ka, 45 kV, 30 mA). The micromorphology and element distribution of the prepared electrodes were characterized by SEM (JSM-7800F, Japan) equipped with an energy dispersive spectrometer (EDS) detector. The surface microstructure of the above electrodes was tested by AFM (CSPM5500, China, Contact mode). The presence of PTh was analyzed by Fourier transform infrared (FT-IR) (Tensor-27, Germany) spectra and UV–visible spectra (UV–vis) (T6, China).
Electrochemical properties
The linear sweep voltammetry (LSV), cyclic voltammetry (CV) and electro-chemical impedance spectroscopy (EIS) were tested by an electrochemical workstation (AUT84442, Switzerland). These tests were conducted with a standard three-electrode system (saturated calomel electrode (SCE) as the reference electrode, Pt electrode as the counter electrode and the prepared electrodes as the working electrodes). The CV test was performed in 0.1 M Na2SO4 solution at a scan rate of 100 mV s−1 and the LSV test was performed in 0.5 M Na2SO4 solution at a scan rate of 50 mV s−1. The EIS measurement was carried out in a frequency range from 100 kHz to 0.01 Hz with an applied sine wave of 10 mv amplitude at open circuit potential (OCP). In addition, the generation rate of ·OH radical in the electrochemical process was measured by fluorescence spectrophotometer (RF5301-PC, Japan). The hydroxyl radical was captured by 2-hydroxy terephthalic acid which can be tested by fluorescence. 47 Thus, the peak intensity of 2-hydroxyterephthalic acid at wavelength about 440 nm could be used as an indicator of ·OH radical production.
Electrochemical degradation measurement
The four prepared electrodes were used as the anode and titanium mesh was treated as the cathode for the electrochemical degradation of phenol wastewater (1000 mg·l−1 phenol, 4.0 g·l−1 Na2SO4 and the initial pH = 5.0). The working area of the electrode was 3 × 2 cm2. During the degradation tests, the concentration of phenol was monitored by HPLC (Prominence UFLC, C18, Japan) per 20 min. Meanwhile, TOC was determined by Total Organic Carbon Analyzer (TCD-800, China). The degradation efficiency of phenol (ηDEP) and the TOC removal efficiency (ηTOC) were calculated by the following formulas:


The energy consumption in the electrochemical oxidation process was calculated according to the following formula (3) 48 :

where C0 is the initial phenol concentration and Ct is the phenol concentration at given time t. TOC0 is the initial TOC value of the phenol solution and TOCt is the phenol solution TOC value after degradation at time t. V is the electrolyte volume (L), I is the current (A) and Ucell is the cell voltage.
The intermediate products produced during the degradation of phenol were tested by gas chromatography-mass spectrometry (GCMS-QP2010Plus, Japan). The temperature was increased to 280 ℃ at a rate of 15 ℃ min−1 for 10 min. Helium was used as the carrier gas with a flow rate of 1.0 ml min−1. The ionization voltage used in the mass spectrometer detector is 70 eV and the ionization temperature is 180 ℃. Besides, the charge-mass ratio range is 30 ∼ 280 m z−1. The possible substances were analyzed by comparing the standard mass spectrum library NIST.
Results and Discussion
Characterization of the prepared electrodes
The XRD patterns of the prepared electrodes are shown in Fig. 1. Compared with standard cards (PDF#89-2805), the PbO2 in the four electrodes are β-PbO2 with diffraction peaks at 25.4°, 32.0°, 49.0°, 52.1°. 49 The Ti/PbO2-Bi electrode shows peaks at the same positions but with different intensity compared with the Ti/PbO2 electrode, which indicates that the coating of Bi does not change the crystal structure of Ti/PbO2. The intensity of the PbO2 (211) peak is significantly enhanced, indicating that the Bi preferentially promotes the PbO2 lattice plane growth along the (211) direction. In addition, the intensity of the PbO2 (110) peak decreases when PTh is individually coated on the Ti/PbO2 electrode. This is because of the partial coverage of amorphous PTh on the PbO2 electrode. When the Ti/PbO2 electrode is co-modified by Bi-PTh, the characteristic peaks of PbO2 around 25.4° and 49.0° nearly disappear. However, the PbO2 (301) peak intensity notably increases compared to the other three electrodes, which suggests that the Bi-PTh promotes the PbO2 preferential growth along the (301) direction.
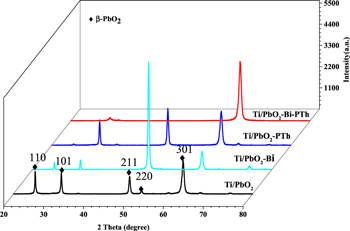
Figure 1. XRD patterns of the four prepared electrodes.
Download figure:
Standard image High-resolution imageThe SEM was employed to analyze the effect of Bi and PTh on the micromorphology of Ti/PbO2 electrode. As shown in Fig. 2a, the Ti/PbO2 electrode exhibits a rough surface. After individual addition of Bi (Fig. 2b), the microstructure of Ti/PbO2-Bi does not change significantly but the size of PbO2 decreases. When the Ti/PbO2 electrode is individually coated with PTh, the rough surface is greatly improved to be flatter and smoother compared with the Ti/PbO2 electrode (Fig. 2c), which suggests that the PTh can effectively reduce the surface roughness of PbO2. Meanwhile, the co-doped Ti/PbO2-Bi-PTh electrode (Fig. 2d) presents the flattest surface due to the synergistic effect of PTh-Bi. The obtained Ti/PbO2-Bi-PTh electrode is very conducive and expected to show better stability and electrocatalytic activity due to the improved interface by decreasing the loss of active PbO2. 50

Figure 2. SEM images of the four prepared electrodes: (a) Ti/PbO2, (b) Ti/PbO2-Bi, (c) Ti/PbO2-PTh and (d) Ti/PbO2-Bi-PTh.
Download figure:
Standard image High-resolution imageThe surface element distribution of the four differently prepared electrodes was analyzed by EDS, which is shown in Fig. S1(available online at stacks.iop.org/JES/167/143506/mmedia). From Fig. S1, there are no observable Ti peaks, implying that Ti substrate is completely covered by PbO2. In addition, the presence of Bi further proves that Bi is successfully coated on the Ti/PbO2 electrode. However, the presence of C and S could be polythiophene or thiophene monomer adsorbed on the electrode. To prove the successful doping of polythiophene, FT-IR and UV–visible analysis were conducted to confirm the existence of PTh in the composite electrode. 51 FT-IR spectra of Th, PbO2-PTh and PbO2-Bi-PTh are presented in Fig. 3a. As depicted in Fig. 3a, the difference between the FT-IR spectra of polythiophene and thiophene monomer can be clearly observed. In the spectra of PbO2-PTh and PbO2-Bi-PTh, the absorption bands at 463 cm−1 and 610 cm−1 may be attributed to the C-S-C ring deformation mode. The characteristic band at 1112 cm−1 is due to the Cα-Cα vibrations, the Cα-Cα will minimize the torsion angle of the thiophene rings, and the Cα-Cα structure has better regularity and excellent conductivity. 52 The stretching vibrations of the C=C bonds in the thiophene ring appear at 1380 cm−1and 1633 cm−1. The band at 3400 cm−1 may be attributed to the O–H of H2O in KBr. 53 UV–vis absorption spectra were studied to reveal more information on the PTh coating (Fig. 3b). As shown in Fig. 3b, the UV absorption curves of PbO2-PTh and PbO2-Bi-PTh are similar. The absorption band red-shifts from 402 nm to 558 nm compared with the monomer, which is attributed to the π–π* transition with the electron on the thiophene ring. 54–56 Thus, the EDS, F-TIR and UV–vis analysis confirm that the Ti/PbO2-Bi-PTh electrode is successfully prepared.
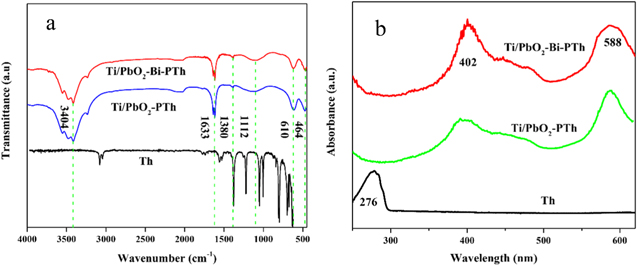
Figure 3. FT-IR spectra (a) and UV–vis absorption spectra (b) of Th, Ti/PbO2-PTh and Ti/PbO2-Bi-PTh.
Download figure:
Standard image High-resolution imageTo further study the surface improvement of the Ti/PbO2 electrode by co-doping of PTh and Bi, AFM was employed to study the surface microstructure of the four electrodes. The 2-D and 3-D images of the electrodes are shown in Figs. 4a–4h. The average surface depth values of the four prepared electrodes are 80.21 nm (Fig. 4e), 68.62 nm (Figs. 4f), 26.73 nm (Figs. 4g) and 9.36 nm (Fig. 4h), respectively. These results demonstrate that the surface improvement degree of the dopants follows the order: PTh-Bi > PTh > Bi, which is in good agreement with the SEM results presented above. Specifically, the surface depth values of Ti/PbO2-Bi and Ti/PbO2-PTh electrodes are much higher than that of Ti/PbO2-PTh-Bi electrode, by nearly 7.3 and 2.9 times, respectively. This also demonstrates the combined effect of Bi and PTh on reducing the surface roughness and the surface cracks. 57,58

Figure 4. AFM images of the four prepared electrodes: (a) and (e) Ti/PbO2, (b) and (f) Ti/PbO2-Bi, (c) and (g) Ti/PbO2-PTh, (d) and (h) Ti/PbO2-Bi-PTh.
Download figure:
Standard image High-resolution imageFurthermore, the electrochemical properties of the prepared electrodes were tested. Firstly, the ·OH radical concentration was investigated by fluorescent spectrometry around 440 nm wavelength. 47 The ·OH radical acts as high active oxidant that can decompose phenol into small molecules, such as CO2 and H2O. 59 Thus, the ·OH radical generation rate can be used to assess the electrode electrochemical performance. As shown in Fig. 5, the fluorescent peak intensities increase with increasing electrolysis time. The Ti/PbO2-Bi-PTh electrode has the highest fluorescence intensity of about 635 a.u. which is approximately 2.2, 1.8, 1.4 times of that of Ti/PbO2 (285 a.u.), Ti/PbO2-Bi (350 a.u.) and Ti/PbO2-PTh (469 a.u.) electrodes, respectively. This result proves that the number of ·OH radicals on the Ti/PbO2-PTh-Bi electrode is higher than that of the other three electrodes. The electrochemical efficiency improvement is mainly attributed to the denser and smoother surface microstructure of Ti/PbO2-PTh-Bi electrode which could provide more active sites for the production of ·OH radicals. 60

Figure 5. Changes of the fluorescence intensity of the four electrodes with electrolysis duration: (a) Ti/PbO2, (b) Ti/PbO2-Bi, (c) Ti/PbO2-PTh and (d) Ti/PbO2-Bi-PTh.
Download figure:
Standard image High-resolution imageSecondly, the linear sweep voltammetry (LSV) results are shown in Fig. 6a. The OEP of different modified PbO2 electrodes are listed in Table I. The oxygen evolution potential (OEP) of the Ti/PbO2, Ti/PbO2-Bi, Ti/PbO2-PTh and Ti/PbO2-PTh-Bi electrodes is 1.75, 1.86, 2.21 and 2.42 V, respectively. The Ti/PbO2-Bi-PTh electrode with the highest OEP can facilitate the generation of more ·OH radicals and accelerate the degradation efficiency of phenolic wastewater. 61 In addition, the cyclic voltammetry curves of the prepared electrodes are shown in Fig. 6b. The CV curve of the Ti/PbO2-Bi-PTh electrode exhibits the highest integrated area and current density among all the electrodes, implying that the Ti/PbO2-Bi-PTh electrode has an excellent capacitance. Furthermore, the interface properties and the charge transfer resistance of the four electrodes were investigated by electrochemical impedance spectroscopy (EIS). The Nyquist plots of Ti/PbO2, Ti/PbO2-Bi, Ti/PbO2-PTh and Ti/PbO2-Bi-PTh electrodes are displayed in Fig. 6c. The semicircle represents the charge transfer resistance between the surface layer and the active components. The radius of the semicircle significantly decreases when the Ti/PbO2 electrode is individually modified with Bi and PTh. Equivalent circuit model and EIS simulation results are included in Fig. 6d. The RS, Rct and CPE represent the solution resistance, charge transfer resistance and constant phase element for double-layer, respectively. 62 According to the fitted data, the Ti/PbO2-Bi-PTh electrode shows the lowest Rct (51.002 Ω cm−2), while the Ti/PbO2 electrode presents the highest Rct (182.650 Ω cm−2). These results imply that the charge transfer velocity of the Ti/PbO2-Bi-PTh electrode layer is significantly improved due to the introduction of conductive PTh and Bi.

Figure 6. Linear sweep voltammetry (a), Cyclic voltammetry curve (b), Nyquist impedance plot (c) and EIS equivalent circuit and fitting results (d) of the four prepared electrodes.
Download figure:
Standard image High-resolution imageElectrochemical degradation of phenol
Figure 7a illustrates the difference of the electrochemical oxidation capability to degrade phenol by the four electrodes. Phenol degradation efficiency of 54.8%, 70.8%, 86.3% and 98.5% within 60 min is achieved for Ti/PbO2, Ti/PbO2-Bi, Ti/PbO2-PTh and Ti/PbO2-Bi-PTh electrodes, respectively. By fitting the test data (Fig. 7b), electrocatalytic degradation process under the studied conditions is consistent with the first-order kinetic model and the kinetic rate constants of phenol degradation for Ti/PbO2, Ti/PbO2-Bi, Ti/PbO2-PTh and Ti/PbO2-Bi-PTh electrodes are 0.0190, 0.0385, 0.0595 and 0.0843 mg·l−1‧min−1, respectively. These results show that the co-doping of PTh and Bi on the Ti/PbO2 electrode can significantly increase the phenol degradation efficiency. In addition, the TOC removal results are shown in Fig. 7c. The TOC removal rate on the four electrodes is 60.7%, 71.8%, 84.5% and 93.58% in 180 min, respectively. The Ti/PbO2-Bi-PTh electrode exhibits the highest TOC removal rate among the four electrodes. Consequently, most phenol molecules can be completely decomposed into H2O, CO2 and other chemicals. 66 In addition, the optimization of the reaction conditions such as thiophene concentration, electrolyte concentration, current density, electrode space and pH value are presented in Figs. S2–S6.

Figure 7. Changes of the phenol degradation efficiency of the four electrodes with electrocatalysis time (a), the corresponding kinetic curves (b) and the TOC removal rate of four electrodes (c). Reaction conditions: Phenol initial concentration = 1000 mg·l−1, Na2SO4 concentration = 8 g·l−1, thiophene concentration = 0.05 mol·l−1 (Fig. S2), Current density = 30 mA‧cm−2 (Fig. S3), Electrode spacing = 3 cm (Fig. S4), Solvent pH = 5 (Fig. S5).
Download figure:
Standard image High-resolution imageDegradation mechanism of phenol
The electrochemical degradation products of phenol by Ti/PbO2-Bi-PTh electrode are identified with GC-MS at degradation time of 0 min, 60 min, 120 min and 180 min, respectively. As shown in Fig. 8, the substance fragments at the retention time of 8.275, 11.900, 18.085, 22.873, 26.503 and 29.765 min are determined by GC-MS and compared with the mass spectrometry standard library NIST. The fragments are maleic acid, phenol, oxalic acid, catechol, hydroquinone and quinone, respectively. 67 With the extension of degradation time, the concentration of phenol decreased gradually. In addition, some new products are detected in the phenol degradation process. The mass spectrum of each intermediate product is shown in Fig. S7. The fragment composition is determined by the mass-to-charge ratio and retention time, which indicates that phenol underwent different oxidation pathways in the degradation process. As observed, the peak of phenol completely disappeared and maleic acid, benzoquinone, hydroquinone and catechol are almost completely degraded within 60 min. After 180 min, there is only a small amount of oxalic acid. As shown in Fig. 9, Phenol is continuously oxidized and decomposed by ·OH in the electro-oxidation system. The hydroxylated substance is further oxidized to maleic acid and other organic acids. In the subsequent oxidation process, the carbon chain is continuously broken. Finally, the organic substance is completely oxidized and degraded into CO2 and H2O. 68,69

Figure 8. Chromatograms of different intermediate by-products during phenol degradation: (a) 0 min, (b) 60 min, (c) 120 min and (d) 180 min.
Download figure:
Standard image High-resolution image
Figure 9. The proposed pathway of electrochemical degradation of phenol.
Download figure:
Standard image High-resolution imageCell voltage test and cycle experiment
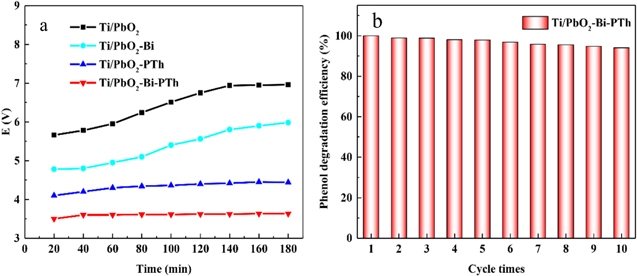
The stability of the prepared electrodes is further studied by the cell voltage and recycling tests. As it is well known that the cell voltage reflects the energy consumption and the stability of the electrode during the electrocatalytic oxidation process. Hence, the cell voltage test is employed to assess the stability of the four electrodes. As displayed in Fig. 10a, the curves of the modified electrodes with the introduction of conductive PTh are stabler and flatter than that of the Ti/PbO2 and Ti/PbO2-Bi electrodes, and approaching to a straight line with longer degradation time. These results reveal that the tight and dense PTh coating improves the stability of the Ti/PbO2 electrode by restricting the loss of the active PbO2 species. In addition, the maximum cell voltage of the four electrodes is 6.96, 5.98, 4.44 and 3.63 V, respectively, and the Ti/PbO2-Bi-PTh electrode has the lowest cell voltage. The energy consumption of the electrochemical oxidation process of different electrodes in 60 min is calculated with formula (3), and the results are shown in Table II. Ti/PbO2-Bi-PTh electrode has the lowest energy consumption (5.89 kW·h·m−3) compared with the other three electrodes. In other words, the Ti/PbO2-Bi-PTh electrode could save more energy during phenol degradation and possess more potential for practical application. The recycling tests are carried out to investigate the Ti/PbO2-Bi-PTh electrode stability. As shown in Fig. 10b, the Ti/PbO2-Bi-PTh electrode can still retain phenol degradation efficiency of 94% after 10 cycles, suggesting good recyclability and chemical stability of the electrode.
Figure 10. The changes of cell voltage of the four electrodes (a) and the recycling tests of the Ti/PbO2-PTh-Bi electrode (b).
Download figure:
Standard image High-resolution image
Table II. Energy consumption of different electrodes.
| Electrode | Average cell voltage (V) | Energy consumption (kW·h·m−3) |
|---|---|---|
| Ti/PbO2 | 5.80 | 9.56 |
| Ti/PbO2-Bi | 4.84 | 7.99 |
| Ti/PbO2-PTh | 4.20 | 6.93 |
| Ti/PbO2-Bi-PTh | 3.57 | 5.89 |
Conclusions
A novel Bi-PTh co-doped Ti/PbO2 electrode is successfully fabricated by electrodeposition and applied to electrochemical oxidation degradation of phenol. The Ti/PbO2-Bi-PTh electrode exhibits a flatter and smoother surface than the traditional Ti/PbO2 electrode. Moreover, the Ti/PbO2-Bi-PTh electrode has higher OEP (2.42 V), better capacitance and faster charge transfer (51.002 Ω cm−2) than the conventional Ti/PbO2 electrode. In the electrochemical oxidation process, the phenol degradation efficiency of 100% within 60 min and TOC removal efficiency of 94% within 180 min are achieved by the Ti/PbO2-Bi-PTh electrode. The kinetic study suggests that phenol degradation reaction belongs to the first-order kinetic model and the rate constant reaches 0.0843 mg·l−1‧min−1. The degradation pathway of phenol is explored by GC-MS and a possible degradation pathway is proposed. Furthermore, the cell voltage test shows that the process of electrochemical oxidation requires extremely low energy consumption (5.89 kW·h·m−3). In addition, the electrochemical degradation of phenol and cycle tests indicate that Ti/PbO2-Bi-PTh has excellent electrocatalytic properties and stability. Hence, this work provides a novel approach to modify the PbO2 electrode by co-doping Bi-PTh, and the modified Ti/PbO2-Bi-PTh electrode could meet the industry requirements for high efficiency degradation of phenolic wastewater.
Acknowledgments
This work was supported by the Science and Technology Research Program of Chongqing Municipal Education Commission (grant no. KJQN201901510) and the Natural Science Foundation of Chongqing (grant no. cstc2020jcyj-msxmX0491).