
Abstract
The electrochemical formation of Dy–Ni alloys was investigated in molten CaCl2–DyCl3 (1.0 mol%) at 1123 K. Cyclic voltammetry indicated the formation of Dy–Ni alloys at more negative than 1.0 V vs. Ca2+/Ca. Higher cathodic currents were observed from approximately 0.6 V, which indicated the formation of Dy–Ni alloys having higher Dy concentration. An open-circuit potentiometry was carried out with Mo and Ni electrodes before and after the addition of DyCl3. After the potentiostatic electrolysis of Mo electrode at −0.50 V for 30 s in molten CaCl2–DyCl3, only one potential plateau appeared at 0.33 V, which was interpreted as the equilibrium potential of Dy3+/Dy. In contrast, four potential plateaus were observed at 0.49, 0.62, 0.87, and 1.04 V for Ni electrode after the potentiostatic electrolysis at 0.25 V for 15 min. According to energy-dispersive X-ray spectroscopy and X-ray diffraction of the electrolyzed samples, the four potential plateaus correspond to the two-phase coexisting states of (DyNi + DyNi2), (DyNi2 + DyNi3), (DyNi3 + DyNi5), and (DyNi5 + Ni). Standard Gibbs energies of formation were calculated for Dy–Ni alloys.
Export citation and abstract BibTeX RIS

This is an open access article distributed under the terms of the Creative Commons Attribution Non-Commercial No Derivatives 4.0 License (CC BY-NC-ND, http://creativecommons.org/licenses/by-nc-nd/4.0/), which permits non-commercial reuse, distribution, and reproduction in any medium, provided the original work is not changed in any way and is properly cited. For permission for commercial reuse, please email: permissions@ioppublishing.org.
Alloys consisting of rare-earth (RE) and transition metal (TM) are of great interest owing to their remarkable physical and chemical properties such as hydrogen storage, permeability, catalytic properties, and magnetism. Especially, neodymium–iron–boron (Nd–Fe–B) magnets used in the high-performance motors have attracted increasing attention recently, due to the popularity of electric vehicles (EVs) and hybrid electric vehicles (HEVs). Since the high-performance motors need to operate in the high temperature environment, an addition of dysprosium (Dy) into the magnets is necessary to maintain the superior coercive force. 1
However, for many countries, the supply risk of RE elements (REEs) is high due to their insufficient reserves and uneven distribution of the mineral resources. In 2019, more than 80% of globally proven RE reserves located in China, Brazil, Vietnam, and Russia. 2 Among REEs, heavy REEs including Dy are especially scarce and unevenly distributed. 3 The recycling of REEs from magnet scraps is an effective measure to mitigate its supply risk. Until now, however, the only practical process for recycling has been the combination of hydrometallurgical leaching and solvent extraction, that is used for the onsite recycling of the process waste in the Nd–Fe–B magnet manufacturing plants. 4 Although this hydrometallurgical process has been applied for many years, it has a few limitations such as multistep process, high energy consumption, and high environmental load. Despite the waste from electronic products (e-waste) containing high concentrations of REEs has been increasing rapidly in recent years, recycling from the e-waste has not been industrialized yet. Therefore, the development of a new process for efficient recycling of REEs from magnet scraps is essential.
Many researchers have already proposed several pyrometallurgical methods for the separation and recovery of REEs at high temperature. For example, a recycling process utilizing chemical vapor transport (CVT) was reported, wherein they used the difference in vapor pressures of RE salts at high temperature to separate REEs in the form of gas complex. 5–9 In another study, a separation method for REEs by vacuum distillation of di- and trihalide mixtures was proposed. 10,11 In this, the principle of separation and recovery of REEs is similar to the CVT method, wherein they used the difference between vapor pressures of RE dihalides (RECl2 or REI2) and trihalides (RECl3 or REI3). Although these two methods provide an easier process with fewer steps than the hydrometallurgical process, it is difficult to achieve a high separation ratio. There are several other processes proposed for REEs recycling, 12–16 but the separation between REEs was not their research focus.
We have previously proposed a separation and recovery process of REEs from waste magnets using RE–TM alloy formation in molten salts, wherein REEs are separated due to the differences in the formation potential of RE–TM alloys and the diffusion rate of RE in the RE-TM alloys. 17 We investigated the electrochemical behavior of RE (RE = Nd and Dy) and the formation of RE–Ni alloys in molten LiCl–KCl at 723 K. 18–22 A high separation ratio of 72 was achieved for Dy/Nd in the alloy sample. 21 We also conducted a similar research in molten NaCl–KCl–RECl3 (RE = Nd, Pr, and Dy) at 973 K. 23–26 The highest achieved molar separation ratio for Dy/Nd was approximately 25, 26 was lower than the previous case. However, a higher alloy formation rate was achieved due to the higher temperature. To increase the alloy formation rate, a fluoride system of LiF–CaF2 was used at 1123 K, and the electrochemical behavior of RE (RE = Nd, Pr, and Dy) and formation of RE–Ni alloys were investigated. 25,27–29 The formation rate of RE–Ni alloys was raised over 200 μm h−1, while the separation ratio of Dy/Nd was limited to only 6. 29 Recently, besides the Ni substrate, we have investigated the RE-alloying behaviors of many other materials. 30–34
In previous studies, we achieved high separation ratios in chloride melts and high alloy formation rates at high operation temperatures. To achieve high values for both, the separation ratio and the alloy formation rate, a high temperature operation of a chloride melt with low vapor pressure is a reasonable approach. As a chloride melt, we selected CaCl2 due to its lower vapor pressure compared with that of the chlorides of alkali and alkaline earth metals. Considering the melting point of CaCl2 (1055 K), the selected operation temperature was 1123 K. In the present study, we first investigated the electrochemical behavior of Dy3+ ions at Mo and Ni electrodes by cyclic voltammetry. Then, the formation potential of each Dy–Ni alloy was estimated by open-circuit potentiometry. The formed Dy–Ni alloy phases were identified by X-ray diffraction (XRD). Cross-sections of the alloy samples were observed by scanning electron microscopy (SEM) and analyzed by the energy-dispersive X-ray spectroscopy (EDX). Finally, Gibbs energy of formation for each Dy–Ni alloy was calculated from the formation potential and compared with the reported values.
Experimental
As shown in Fig. 1, 300 g of CaCl2 powder (Kojundo Chemical Laboratory Co., Ltd., 99.9%) loaded in a graphite crucible (Sanko Co., Ltd., IG-110, i.d: 90 mm, height: 120 mm) was first dried in a vacuum oven at 453 K for 72 h, and then placed at the bottom of a stainless-steel vessel in an air-tight Kanthal container for further drying under vacuum at 773 K for 24 h. After drying, the temperature was raised to the experimental value of 1123 K. All the experiments were carried out under the dry argon atmosphere in a glove box. One mol-percent of DyCl3 powder (Kojundo Chemical Laboratory Co., Ltd., 99.9%) was added directly into the molten salt. Two types of working electrodes were used, flag electrodes (diameter: 3.0 mm, thickness: 0.1 mm, lead wire diameter: 0.2 mm) for the cyclic voltammetry and open-circuit potentiometry measurements, and plate electrodes (5 mm width × 20 mm length × 0.1 mm thickness) for the samples preparation. The working electrode materials were Ni (Nilaco Corp., >99%) and Mo (Nilaco Corp., >99%). A Ni wire immersed in molten CaCl2 containing 1.0 mol% NiCl2 (Alfa Aesar Corp., 98%), set in a mullite tube (Nikkato Corp., o.d. 6 mm × i.d. 4 mm × length 500 mm, 56% Al2O3–40% SiO2; HB grade) was used as the reference electrode. All the potentials in this study were calibrated with reference to a dynamic Ca2+/Ca reference electrode, which was prepared by electrodepositing Ca metal on a Mo flag electrode at sufficiently large cathodic current densities (>2 A cm−2). A carbon rod (Sanko Co. Ltd., diameter 7 mm × length 520 mm) was used as the counter electrode. An electrochemical measurement system (Hokuto Denko Corp., HZ-7000) connected to a computer was used for the entire measurements.
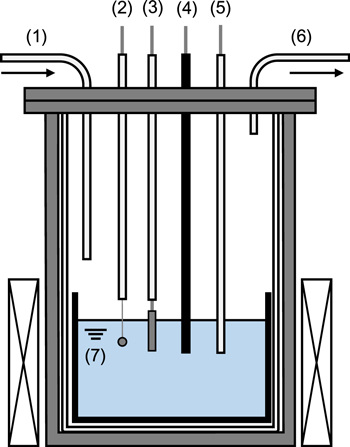
Figure 1. Schematic drawing of the experimental apparatus for molten CaCl2–DyCl3 systems. (1) Ar gas inlet, (2) working electrode (Mo or Ni), (3) working electrode (Ni plate), (4) counter electrode (carbon rod), (5) reference electrode (Ni2+/Ni), (6) gas outlet, and (7) CaCl2 molten salt (1.0 mol% DyCl3 included).
Download figure:
Standard image High-resolution imageThe alloy samples prepared by the potentiostatic electrolysis were usually covered with the solidified salts. Before the analysis, the samples were washed with deionized water to remove the salts and then rinsed by ethanol (FUJIFILM Wako Pure Chemical Corp., 99.5%). After this treatment, the weight change was measured, and then, XRD analysis was carried out with a diffractometer (Rigaku Corp., Ultima IV) using Cu-Kα radiation (λ = 0.15418 nm) at 40 kV and 40 mA. Subsequently, the samples were embedded in resin and polished with the emery papers (#320 and #600), polycrystalline diamond suspensions (3 μm and 9 μm), and buffing compound (Micro Polish II, 0.3 μm, Buehler), successively. After exposing the cross-section, the samples were analyzed by SEM (Thermo Fisher Scientific Inc., Phenom Pro Generation 5) and EDX (Thermo Fisher Scientific Inc., SE1200-8001).
Results and Discussion
Cyclic voltammetry
According to the phase diagram of the Dy–Ni system, 35 there are nine intermetallic compounds (Dy3Ni2, DyNi, DyNi2, DyNi3, Dy2Ni7, DyNi4, Dy4Ni17, DyNi5, and Dy2Ni17) and liquid alloy at 1123 K. In this study, these Dy–Ni alloys were expected to form by the electrochemical reaction. Figure 2 shows the obtained cyclic voltammograms for a Mo electrode before and after the addition of 1.0 mol% DyCl3. In the blank measurement, cathodic currents rapidly increase from approximately 0.2 V (vs. Ca2+/Ca), as shown by the broken curve. These currents possibly correspond to the formation of Ca metal with an activity smaller than unity, because Ca metal dissolves into molten CaCl2 up to 4 mol%. 36 After the DyCl3 addition, a sharply rising cathodic current and an anodic current peak are observed at approximately 0.3 V. Since no Mo–Dy alloys exist at 1123 K, they should be interpreted as the deposition and dissolution of Dy metal, respectively.

Figure 2. Cyclic voltammograms for a Mo flag electrode in molten CaCl2 before and after the addition of 1.0 mol% DyCl3 at 1123 K. Scan rate: 20 mV s−1.
Download figure:
Standard image High-resolution imageFigure 3 presents the cyclic voltammograms for a Ni electrode before and after the 1.0 mol% DyCl3 addition. For the reference, the voltammogram for Mo electrode in DyCl3 addition system is also plotted (broken curve). Before the addition of DyCl3, the voltammogram for Ni electrode (black solid curve) is almost the same as Mo electrode in Fig. 2, indicating that the cathodic currents increasing from 0.2 V should also correspond to the formation of Ca metal fog. After the DyCl3 addition (red solid curve), cathodic currents increase from 1.0 V, which suggests the start of Dy–Ni alloys formation. From approximately 0.6 V, a further increase in cathodic current is observed, suggesting the formation of Dy–Ni alloys having higher Dy concentration. In contrast, several anodic peaks observed in the anodic sweep possibly correspond to the dissolution of Dy from the formed different Dy–Ni alloys.

Figure 3. Cyclic voltammograms for Ni and Mo flag electrodes in molten CaCl2 before and after the addition of 1.0 mol% DyCl3 at 1123 K. Scan rate: 20 mV s−1.
Download figure:
Standard image High-resolution imageOpen-circuit potentiometry
According to the binary phase diagram of the Ca–Ni system, 37 Ca–Ni alloys exist at 1123 K. To find the potential of Ca–Ni alloy formation, the measurement was initially conducted for a Ni electrode in molten CaCl2. Figure 4 shows the open-circuit potential curve after galvanostatic electrolysis at −2.0 A cm−2 for 30 s. Only one potential plateau maintained at 0.13 V over 50 s should correspond to the formation potential of Ca–Ni alloys. 38
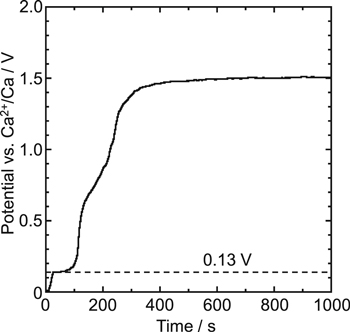
Figure 4. Open-circuit potentiogram for a Ni flag electrode after galvanostatic electrolysis at −2.0 A cm−2 for 30 s in molten CaCl2 at 1123 K.
Download figure:
Standard image High-resolution imageSecondly, to elucidate the potential of Dy3+/Dy and each of the two-phase coexisting state, a Mo and a Ni electrode were used in CaCl2–DyCl3 (1.0 mol%) for open-circuit potentiometry measurement. A black curve in the left part of Fig. 5 shows the result corresponding to the Mo electrode exhibiting only one potential plateau at 0.33 V, after the potentiostatic electrolysis at −0.50 V for 30 s. Since Mo does not form any intermetallic compounds with Dy at 1123 K, 39 the observed potential may be interpreted as the Dy3+/Dy potential. For the Ni electrode, the measurement condition was selected at 0.25 V for 15 min to avoid the influence of Ca–Ni alloy. Figure 5 shows the result for the Ni electrode (plotted with red curves) exhibiting four potential plateaus at 0.49, 0.62, 0.87, and 1.04 V. The plateau potentials were determined from the points having the smallest differential coefficients. The result suggests that the potential plateaus at 0.62, 0.87, and 1.04 V are related to the three anodic peaks shown in Fig. 3. The four potential plateaus possibly correspond to the potentials of two-phase coexisting states of different Dy–Ni alloys. To confirm each of the two-phase coexisting state, alloy samples were prepared by the potentiostatic electrolysis at 0.40, 0.50, 0.70, 0.90, and 1.20 V, respectively.

Figure 5. Open-circuit potentiograms at Mo and Ni flag electrodes in molten CaCl2–DyCl3 (1.0 mol%) at 1123 K. Electrolysis condition: −0.50 V for 30 s (Mo), 0.25 V for 15 min (Ni).
Download figure:
Standard image High-resolution imagePreparation and characterization of Dy–Ni alloys
Figure 6 shows (a) a cross-sectional SEM image obtained using EDX analysis, and (b) an XRD pattern for the sample prepared by the potentiostatic electrolysis at 0.40 V for 60 min. Non-uniform inner and outer layers were found through the cross-section. EDX analysis revealed the atomic composition to be Dy:Ni = 31.4:68.6 at point (1) of the inner layer, indicating the formation of DyNi2; while at points (2) and (3) of outer layer, the compositions were Dy:Ni = 48.3:51.7 and 48.0:52.0, respectively, which indicated that the finally formable alloy at 0.40 V is DyNi. The existence of inner DyNi2 layer would be caused by the fast formation rate of DyNi2 and the slow formation rate of DyNi. The XRD pattern of the sample confirmed the formations of both DyNi and DyNi2.

Figure 6. (a) A cross-sectional SEM image with EDX analysis and (b) an XRD pattern of the sample obtained by potentiostatic electrolysis with a Ni electrode at 0.40 V for 60 min in a molten CaCl2–DyCl3 (1.0 mol%) system at 1123 K.
Download figure:
Standard image High-resolution imageTo confirm the fast formation rate of DyNi2 and the slow formation rate of DyNi, the sample was prepared at the same potential of 0.40 V for 15 min. Figure 7 shows (a) a cross-sectional SEM image and (b) an XRD pattern of the sample. Uniform alloy layer having a thickness of approximately 50 μm was observed. The only existing of DyNi2 alloy was confirmed from the EDX and XRD results. Therefore, the formation rate of DyNi2 is much faster than that of DyNi.
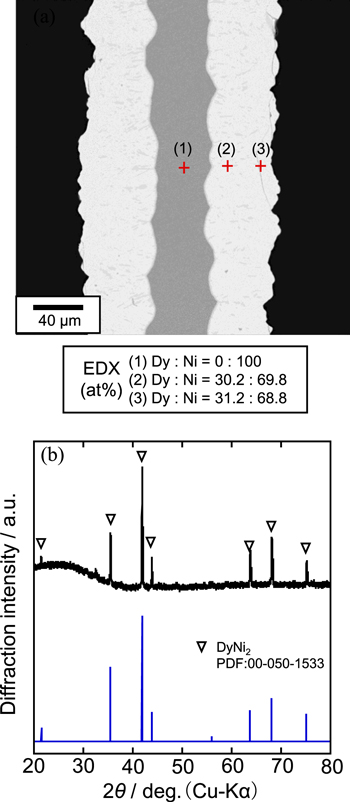
Figure 7. (a) A cross-sectional SEM image with EDX analysis and (b) an XRD pattern of the sample obtained by potentiostatic electrolysis with a Ni electrode at 0.40 V for 15 min in a molten CaCl2–DyCl3 (1.0 mol%) system at 1123 K.
Download figure:
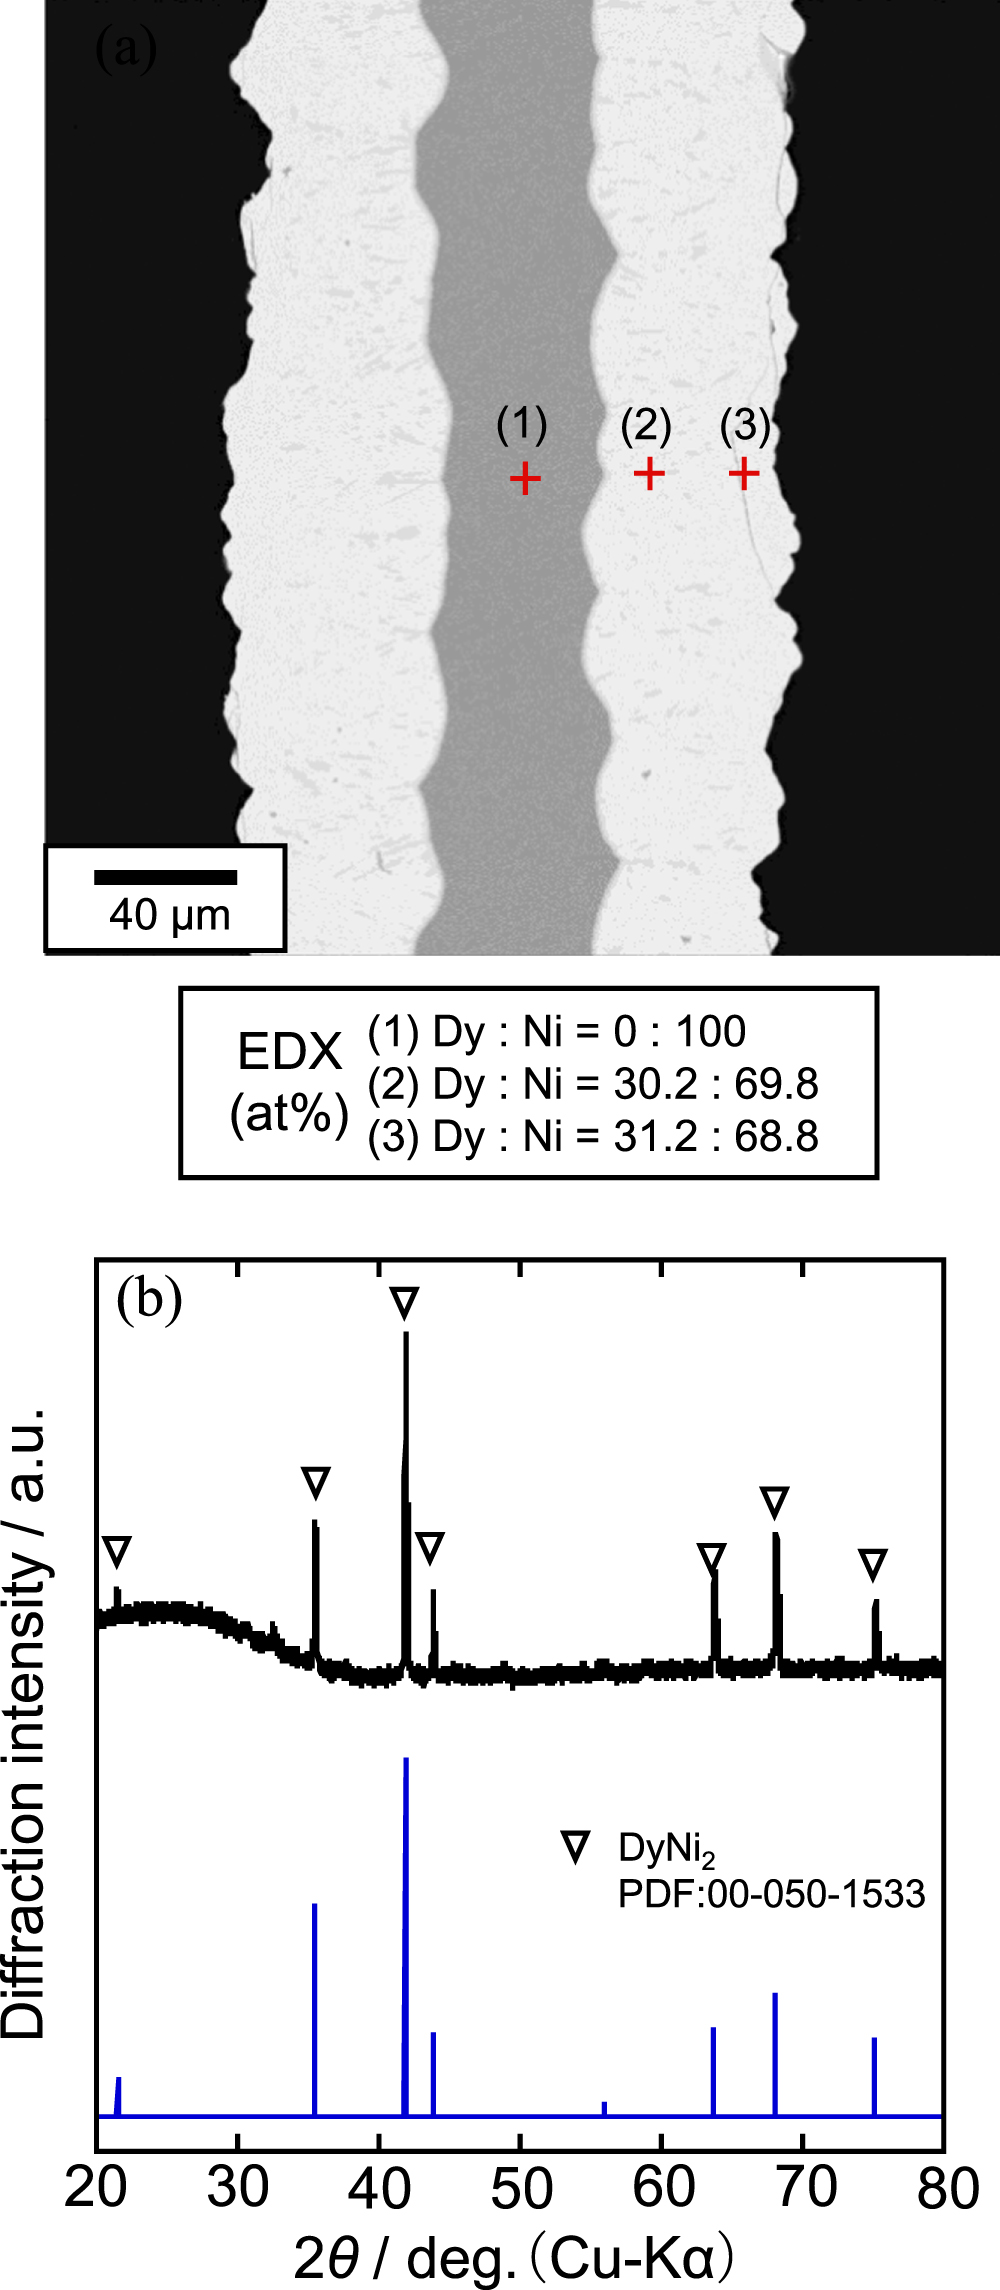
Standard image High-resolution imageFigure 8 shows (a) a cross-sectional SEM image with EDX analysis and (b) an XRD pattern for the sample electrolyzed at 0.50 V for 60 min. The Ni plate substrate electrode was uniformly and completely alloyed. The thickness of the plate increased from the original value of 100 μm to 200 μm. According to the EDX analysis, compositions at point (1), (2), and (3) were Dy:Ni = 30.7:69.3, 29.7:70.3, and 30.5:69.5, respectively, indicating the uniform alloy is DyNi2. Besides, the XRD analysis clearly indicated that only DyNi2 alloy exists. Figure 9 shows the current density change during the electrolysis. The total amount of electricity was 209.4 C. From the weight increase (0.0784 g) of the sample after the electrolysis, the current efficiency for the DyNi2 formation was calculated to be 66.6%. According to these results, DyNi2 is the thermodynamically stable phase at 0.50 V. The growth rate of DyNi2 alloy is over 100 μm h−1, similar to that in molten LiF–CaF2 at 1123 K. 28

Figure 8. (a) A cross-sectional SEM image with EDX analysis and (b) an XRD pattern of the sample obtained by potentiostatic electrolysis with a Ni electrode at 0.50 V for 60 min in a molten CaCl2–DyCl3 (1.0 mol%) system at 1123 K.
Download figure:
Standard image High-resolution image
Figure 9. Current density change during the potentiostatic electrolysis of a Ni electrode at 0.50 V for 60 min in a molten CaCl2–DyCl3 (1.0 mol%) system at 1123 K.
Download figure:
Standard image High-resolution imageIn our previous studies of electrochemical formation of RE–Ni alloys in molten salts, we found that the formation rates of RE-poor phases such as RENi3 and RENi5 are very slow. 22,26–28 However, once an RE-rich alloy such as RENi2 is formed as the starting electrode, the formation of the RE-poor phases, namely, the anodic dissolution of RE metal from the RE-rich alloy, becomes considerably faster. 22,26–28 Hence, in this study, based on the result at 0.50 V, electrodes with Dy-rich alloy were prepared by potentiostatic electrolysis at 0.50 V for 15 min, as the first step. Subsequently, Dy-poor phases were produced by the anodic dissolution of Dy from the Dy-rich phase at 0.70, 0.90, and 1.20 V for 60 min, as the second step.
As shown in Fig. 10, the reaction of the first step was investigated by, (a) a cross-sectional SEM image with EDX analysis and (b) an XRD pattern for the sample electrolyzed at 0.50 V for 15 min. Except the inner Ni substrate layer, three alloy layers were detected by the EDX analysis. At points (2), (3), and (4), the compositions are Dy:Ni = 16.7:83.3, 23.9:76.1, and 30.2:69.8, indicating that they are DyNi5, DyNi3, and DyNi2, respectively. According to SEM image, the dominating phase of DyNi2 layer exhibited a thickness of approximately 20 μm. Further, the XRD analysis confirmed the formation of DyNi2. Based on these results, the Dy-rich alloy formed in the first step was confirmed to be DyNi2.
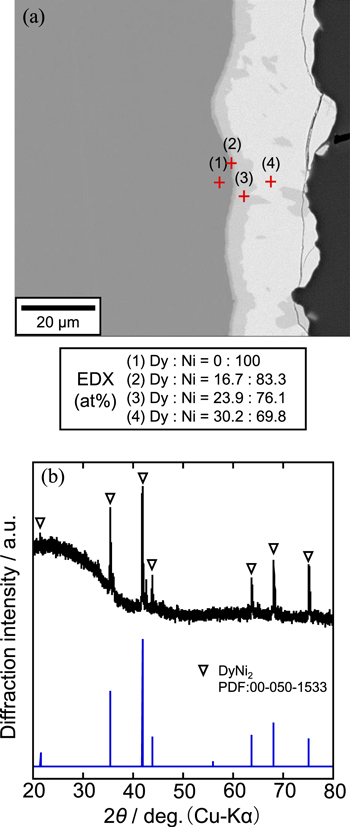
Figure 10. (a) A cross-sectional SEM image with EDX analysis and (b) an XRD pattern of the sample obtained by potentiostatic electrolysis with a Ni electrode at 0.50 V for 15 min in a molten CaCl2–DyCl3 (1.0 mol%) system at 1123 K.
Download figure:
Standard image High-resolution imageFigure 11 shows (a) a cross-sectional SEM image with EDX analysis and (b) an XRD pattern for the sample electrolyzed at 0.70 V for 60 min in the second step. According to Fig. 11a, thickness of the alloy layer was larger than that in Fig. 10a. The EDX analysis indicated the compositions at point (2) and (3) as, Dy:Ni = 16.8:83.2 and 23.7:76.3, which suggest the formation of DyNi5 and DyNi3, respectively. Compared to the DyNi2 alloy layer formed in the first step, only DyNi3 alloy was left on the surface of sample, as confirmed by the XRD analysis. Thus, DyNi3 is the thermodynamically stable phase at 0.70 V. The middle DyNi5 alloy layer was formed due to the interdiffusion between DyNi3 and Ni substrate.
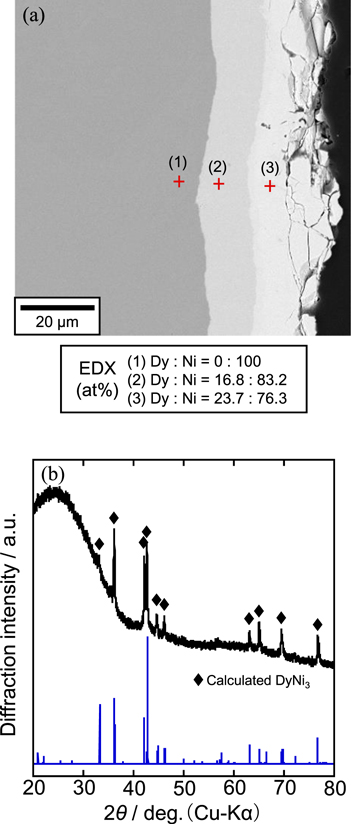
Figure 11. (a) A cross-sectional SEM image with EDX analysis and (b) an XRD pattern of the sample obtained by potentiostatic electrolysis of the DyNi2 electrode at 0.70 V for 60 min in a molten CaCl2–DyCl3 (1.0 mol%) system at 1123 K.
Download figure:
Standard image High-resolution imageThe same fabrication method was repeated; the second step was performed at 0.90 V for 60 min. Figure 12 shows (a) a cross-sectional SEM image with EDX analysis and (b) an XRD pattern for the sample. A porous alloy layer caused by the volume change during the Dy dissolution from DyNi2 was observed. EDX analysis results at point (2) and (3) were Dy:Ni = 16.5:83.5 and 17.0:83.0, respectively, suggesting the alloy layer is DyNi5. Besides, the XRD analysis confirmed the formation of DyNi5. Therefore, DyNi5 is the thermodynamically stable state at 0.90 V.

Figure 12. (a) A cross-sectional SEM image with EDX analysis and (b) an XRD pattern of the sample obtained by potentiostatic electrolysis of the DyNi2 electrode at 0.90 V for 60 min in a molten CaCl2–DyCl3 (1.0 mol%) system at 1123 K.
Download figure:
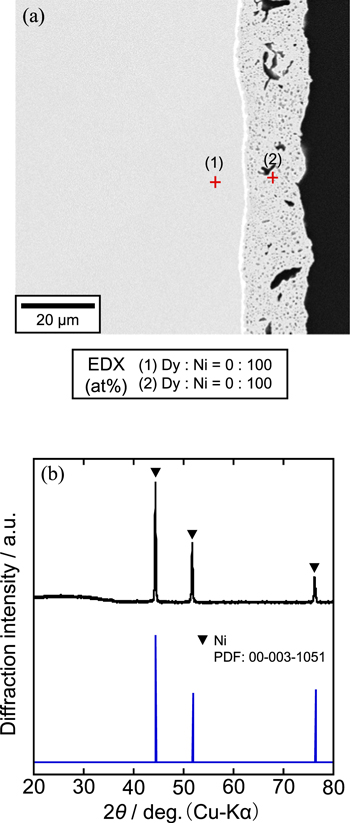
Standard image High-resolution imageFinally, the sample was prepared at 1.20 V for 60 min in the second step. Figure 13 shows (a) a cross-sectional SEM image with EDX analysis and (b) an XRD pattern for the sample. According to the SEM image, DyNi2 alloy was transformed into a porous layer. Both EDX and XRD analyses confirmed the porous layer is Ni.
Figure 13. (a) A cross-sectional SEM image with EDX analysis and (b) an XRD pattern of the sample obtained by potentiostatic electrolysis of the DyNi2 electrode at 1.20 V for 60 min in a molten CaCl2–DyCl3 (1.0 mol%) system at 1123 K.
Download figure:
Standard image High-resolution image
In the present study, formations of Dy3Ni2, Dy2Ni7, DyNi4, Dy4Ni17, and Dy2Ni17 were not confirmed. It is probably caused by the slow formation rate of unconfirmed alloy phase and high transition rate to observed alloy phase in this system. From these results, the four potential plateaus (0.49, 0.62, 0.87, and 1.04 V) obtained in the open-circuit potentiometry measurement are found to correspond to the two-phase coexisting states of (DyNi + DyNi2), (DyNi2 + DyNi3), (DyNi3 + DyNi5), and (DyNi5 + Ni), respectively. Table I summarizes the equilibrium reactions of Dy–Ni alloys and the corresponding equilibrium potentials. These potentials are also given with reference to the Dy3+/Dy potential, which was determined to be 0.33 V (vs. Ca2+/Ca) in Fig. 5.
Table I. Equilibrium reactions and corresponding potentials for Dy–Ni alloys and metallic Dy in molten CaCl2–DyCl3 (1.0 mol%) at 1123 K.
| Equilibrium reaction | Potential vs. Ca2+/Ca / V | Potential vs. Dy3+/Dy / V |
|---|---|---|
| 5 Ni + Dy3+ + 3 e− ⇌ DyNi5 | 1.04 | 0.71 |
| 3/2 DyNi5 + Dy3+ + 3 e− ⇌ 5/2 DyNi3 | 0.87 | 0.54 |
| 2 DyNi3 + Dy3+ + 3 e− ⇌ 3 DyNi2 | 0.62 | 0.29 |
| DyNi2 + Dy3+ + 3 e− ⇌ 2 DyNi | 0.49 | 0.16 |
| Dy3+ + 3 e− ⇌ Dy | 0.33 | 0 |
Calculation of standard Gibbs energies of formation
Using the previously described
19
method, the standard Gibbs energies of formation for Dy–Ni alloys ( ) were calculated. Since several intermetallic compounds were not confirmed as described above, the obtained values were based upon the meta-stable states of the system. First, the partial molar Gibbs energies of Dy (
 ) were obtained from the equilibrium potentials vs. Dy3+/Dy. Next, the partial molar Gibbs energies of Ni (
 ) were calculated by the Gibbs-Duhem equation. Table II summarizes the obtained values of
  and
and  Finally,
  were calculated from the
  and
and  and summarized in Table III. As shown in Table III, the obtained values were compared with the calculated values using the CALPHAD technique.
40
They are in relatively good agreement with each other, but all the values obtained in this study are more negative than the CALPHAD values. The previous study reached the same conclusion,
40
when the CALPHAD values for Dy–Ni system were compared with the experimental values obtained in molten LiCl–KCl at 700 K.
19
and summarized in Table III. As shown in Table III, the obtained values were compared with the calculated values using the CALPHAD technique.
40
They are in relatively good agreement with each other, but all the values obtained in this study are more negative than the CALPHAD values. The previous study reached the same conclusion,
40
when the CALPHAD values for Dy–Ni system were compared with the experimental values obtained in molten LiCl–KCl at 700 K.
19
Table II. Thermodynamic properties of Dy–Ni intermetallic compounds in two-phase coexisting states in this system at 1123 K.
| Coexisting state |
 /kJ(mol Dy)−1 /kJ(mol Dy)−1
|
 /kJ(mol Ni)−1 /kJ(mol Ni)−1
|
|---|---|---|
| Ni + DyNi5 | −205.5 | 0 a) |
| DyNi5 + DyNi3 | −156.3 | −9.8 |
| DyNi3 + DyNi2 | −84.0 | −34.0 |
| DyNi2 + DyNi | −46.3 | −52.8 |
a)From the approximation that the activity of Ni is unity at this temperature.
Table III. Standard Gibbs energies of formation for Dy–Ni alloys at 1123 K, in per mole atoms.
 /kJ mol−1 /kJ mol−1
| ||
|---|---|---|
| Phase | This study | CALPHAD 40 |
| DyNi5 | −34.2 | −27.9 |
| DyNi3 | −46.4 | −36.3 |
| DyNi2 | −50.6 | −41.9 |
| DyNi | −49.5 | −41.8 |
Conclusions
In this study, the electrochemical formation of Dy–Ni alloys was investigated in a molten CaCl2–DyCl3 (1.0 mol%) at 1123 K. Following are the summarized results of this study. The potential of Dy3+/Dy was determined to be 0.33 V vs. Ca2+/Ca. An open-circuit potentiogram obtained after the potentiostatic electrolysis of a Ni electrode at 0.25 V for 15 min exhibited four potential plateaus at 0.49, 0.62, 0.87, and 1.04 V, which suggest the formation of coexisting Dy–Ni phases. Cross-sectional SEM/EDX and XRD analyses confirmed the formation of DyNi and DyNi2 alloys at 0.40 and 0.50 V, respectively. The DyNi2 electrodes prepared by the potentiostatic electrolysis at 0.50 V for 15 min were transformed to the other phases by the anodic dissolution of Dy. The formed phases at 0.70, 0.90, and 1.20 V were confirmed to be DyNi3, DyNi5, and Ni, respectively. The equilibrium reactions for Dy–Ni alloys and the corresponding potentials were determined. Based on the potentials, standard Gibbs energies of formation were calculated and compared with the reported CALPHAD values.
Acknowledgments
This work was partly supported by a Grant-in-Aid for Japan Society for the Promotion of Science (JSPS) Fellows grant number 19J20301.