
Abstract
The microstructures and passivation behavior of selective laser melted 316L stainless steel (SLM SS316L) after various heat treatments (500 °C, 950 °C, and 1100 °C) were investigated. The electrochemical results showed that the SLM SS316L sample that was heat treated at 950 °C exhibited the lowest passive current density. The microstructural characterization analysis indicated that the subgrain structures transformed from dislocation-rich subgrain boundaries into island-like cellular trace structures after heat treatment at 950 °C. This led to improved corrosion resistance due to the elimination of dislocations and the homogenization of the composition. Compositional analyses of the passive film indicated that there was no notable change in the passive film composition after heat treatment at 500 °C and 950 °C. However, heat treatment at 1100 °C promoted the formation of Cr(OH)3 in the passive film, resulting in a reduced corrosion resistance. Based on these results, heat treatment at 950 °C appears to be an adequate post-process for SLM SS316L to optimize the microstructure, while also improving corrosion resistance.
Export citation and abstract BibTeX RIS

This is an open access article distributed under the terms of the Creative Commons Attribution 4.0 License (CC BY, http://creativecommons.org/licenses/by/4.0/), which permits unrestricted reuse of the work in any medium, provided the original work is properly cited.
Proton-exchange membrane fuel cells (PEMFCs) have attracted wide attention because they are energy efficient and have a fast startup, are small, and are environmentally friendly.1–3 Bipolar plates, which conduct the current, support the power stacks, and provide gas flow channels, are important components in PEMFCs.4,5 The bipolar plate directly impacts the performance of PEMFCs, and it has a considerable influence on the widespread commercialization of PEMFCs. Therefore, the material of the bipolar plate is critical and needs to be carefully selected. Austenitic stainless steel is considered a potential candidate for bipolar plates because of its low cost, reasonable mechanical strength, and excellent corrosion resistance.6–9 However, numerous problems remain in the application of bipolar plates produced from stainless steel.10,11 The metallic ions released from alloys may poison the membrane electrode assembly, resulting in a decline in fuel cell performance.12 Furthermore, flow field channels increase the process requirement and production time of the bipolar plate, leading to an increase in manufacturing cost.13 Because of this, the widespread application of stainless steel in bipolar plates is limited.
Selective laser melting (SLM), an emerging additive manufacturing technique, provides several advantages compared with traditional casting processes, including high speed, high material utilization, and near-shape machining.14–18 SLM technology reduces the number of manufacturing process steps and costs while maintaining the excellent mechanical properties of stainless steel. However, residual stress, elemental segregation, and irregular grains have been found in SLM components due to the high cooling rates, which are detrimental to the corrosion resistance.19–22 Chao et al.23 reported that subgrain boundaries exhibited the enrichment of high-density dislocations. Trelewicz et al.24 demonstrated that the cellular subgrain structure of additively manufactured 316L could lead to an increase in passive current density in 0.1 M HCl. They pointed out that the cellular subgrain structure was a non-equilibrium structure with segregated Mo. Zhou et al.25 revealed that melt-pool boundaries were preferential corrosion sites, which was consistent with previous results.26 Therefore, it is necessary to adopt a post-process to homogenize the structure and composition. Heat treatment appears to be an appropriate post-process to homogenize the non-equilibrium microstructure and release residual stress. However, studies on the influence of high-temperature heat treatments on the corrosion behavior of SLM SS316L are in their infancy.
Kong et al. 27 studied the passivation behavior of SLM SS316L in PEMFCs via various heat treatments. They reported that a solution treatment at 1050 °C improved the corrosion resistance, which was attributed to the homogenization of the non-equilibrium structure. However, they only considered the effect of recrystallization annealing on the corrosion resistance. Recently, Bruycker et al.28 confirmed that the stress corrosion crack sensitivity of SLM SS316L reduces significantly after heat treatment at 950 °C. Laleh et al.29 studied the corrosion behavior of SLM SS316L after different heat treatments in 0.6 M NaCl. Their results indicated that, after heat treatment at temperatures below 1000 °C, SLM SS316L displayed a higher pitting corrosion resistance than that of SLM SS316L after heat treatment above 1000 °C. However, there have been no detailed studies on the microstructure and passivation behavior of SLM SS316L in PEMFCs after heat treatment below 1000 °C. Therefore, the present study was conducted to investigate the influence of high-temperature heat treatments on the microstructure and passivation behavior of SLM SS316L in simulated PEMFC environments.
Potentiodynamic and potentiostatic polarization tests, electrochemical impedance spectroscopy (EIS), and Mott-Schottky tests were conducted to evaluate the properties of the passive film on SLM SS316L. The microstructures and passive film properties of SLM SS316L were evaluated by scanning electron microscopy (SEM), X-ray diffraction (XRD), transmission electron microscopy (TEM), and electron backscatter diffraction (EBSD). The compositions of the passive films were investigated by X-ray photoelectron spectroscopy (XPS).
Experimental
Sample preparation
The chemical composition of the SLM SS316L is listed in Table I. SLM SS316L samples were obtained from an EOS M290 machine (Germany), which was equipped with a 400 W Yb-fiber laser, at a scanning speed of 980 mm s−1. The total build volume was 250 × 250 × 325 mm. The size of the focused beam was 100 μm. The porosity of the as-built SLM SS316L sample was approximately 0.9% (measured by the mercury intrusion porosimeter (MIP) method).
Table I. Chemical composition (in wt%) of the as-received SLM SS316L sample.
| Element | Ni | Cr | Mo | Mn | Si | P | S | Fe |
|---|---|---|---|---|---|---|---|---|
| Mass fraction (%) | 10.53 | 16.13 | 2.52 | 0.23 | 0.57 | 0.014 | 0.006 | Bal. |
Three heat-treatment conditions were used. (1) HT500: the temperature was raised to 500 °C and maintained for 4 h, which can release some residual stress.28 (2) HT950: the temperature was raised to 950 °C and maintained for 4 h. (3) HT1100: the temperature was raised to 1100 °C and maintained for 1 h. HT1100 was chosen to generate full recrystallization. All the heat treatment processes were performed in a vacuum environment, followed by furnace cooling.
Electrochemical measurements
Electrochemical tests were performed in a traditional three-electrode cell; a Pt plate was the counter electrode, the sample served as the working electrode, and a saturated calomel electrode (SCE) acted as the reference electrode. The sample for the electrochemical test was embedded in plastic tubes and enclosed with epoxy resin. The work area was a circle 10 mm in diameter. Subsequently, the sample was ground with 80–2000 grit SiC paper, polished with 0.5 μm diamond paste, cleaned with ethanol and deionized water, and finally dried in air.
A solution containing 0.5 M H2SO4 + 2 ppm HF was used to simulate the PEMFC cathode environment. All electrochemical tests were performed at 70 °C with air bubbling. The sample was first cathodically polarized at −0.6 VSCE for 5 min. To reach a steady state, all samples were immersed in the electrolyte for 3600 s. Subsequently, potentiodynamic polarization tests were performed at a potential of −0.3 V below the open circuit potential to +1.4 V at a rate of 1 mV s−1. The potentiostatic polarization tests were conducted at a potential of 0.6 VSCE for 4 h. EIS measurements were performed after potentiostatic polarization at 0.6 V for 4 h in a 0.5 M H2SO4 + 2 ppm HF solution. The frequency range was from 100 kHz to 10 mHz, and the sinusoidal amplitude was 5 mV. The Mott-Schottky test was conducted at 1 kHz with a scan rate of 50 mV s−1 from 0.6 VSCE to −0.5 VSCE. All the electrochemical tests were conducted at least three times under each condition.
Microstructural characterization
XRD was performed with a Panalytical X'Pert Pro (operated with Cu Kα radiation at 40 kV and 30 mA) to obtain phase information from the SLM SS316L samples before and after heat treatment. The samples were scanned at a rate of 5°/min in the 2θ range of 20°–80°. EBSD measurements were performed to obtain the grain sizes, grain orientations, and dislocation distributions. For the EBSD measurements, the collection speed, scanning step, and acceleration voltage were 637.76 Hz, 3 μm, and 20 kV, respectively.
Microstructural features were observed using SEM (FEI NovaNano SEM, equipped with energy dispersive spectroscopy (EDS), operated at 15 kV) with secondary electron (SE) imaging. To visualize the surface features, the samples were etched in aqua regia (HCl:HNO3 = 3:1). The evolution of cellular structures and dislocations during heat treatment was observed using TEM (Hitachi H-9500, operated at 300 kV). The preparation process for the TEM samples comprised the following steps. First, a 3 mm disk was cut off from the sheet via wire cutting. Then, the disk was mechanically ground to 60 μm thick and punched into a 3 mm diameter disk. Finally, the small disk was double-jet electropolished using a Struers Tenupol-5 at −30 °C.
The chemical composition of the passive film was analyzed using XPS (ESCALAB 250xi, Thermo Fisher) with an Al Kα X-ray source (hv = 1486.68 eV, source power = 150 W). Before XPS surface analysis, all samples were potentiostatically tested at 0.6 VSCE for 4 h in a 0.5 M H2SO4 + 2 ppm HF solution (70 °C). XPS results were obtained by analyzing three areas on each SLM sample. The peaks in the XPS spectra were investigated using the XPSPEAK 4.1 software after calibration of the C 1 s peak (284.8 eV) and subtraction of the baseline.
Results
Effect of heat treatment on microstructure
XRD patterns of the as-received SLM SS316L and heat-treated samples are shown in Fig. 1. Only the (111), (200), and (222) peaks of single-phase austenite were found in the as-received sample. The primary growth orientation was along the (111) direction, which is consistent with a previous report.30 After heat treatment, the peak intensity of the SLM samples decreased markedly, and the (222) grain orientation disappeared.

Figure 1. XRD results of the as-received and heat-treated samples.
Download figure:
Standard image High-resolution imageEBSD images of the SLM SS316L samples are shown in Fig. 2. As shown in Fig. 2a, the as-received sample had irregular and spindly grains, which are attributed to the rapid solidification process (usually 105−108 K s−1). The as-received and HT950 samples (Fig. 2c) had almost the same grain size and grain shape, but the HT1100 sample (Fig. 2e) exhibited regular polygonal grains due to recrystallization. As seen in Figs. 2b, 2d, and 2f, the kernel average misorientation figures of the as-received and HT950 samples indicated the presence of a high-density of dislocations distributed inside the grains. However, the dislocation density of the HT1100 sample clearly decreased, indicating that the dislocation structures were eliminated after heat treatment at 1100 °C. As summarized in Table II, the average grain sizes did not change significantly between the as-received and HT950 samples. Grain growth was noticeable after heat treatment at 1100 °C, which is ascribed to recrystallization.

Figure 2. Inverse pole figures and Kernel average misorientation figures obtained through EBSD:(a), (b) the as-received SLM SS316L, (c), (d) HT950, and (e), (f) HT1100.
Download figure:
Standard image High-resolution imageTable II. Average grain sizes for SLM SS316L measured from the EBSD results presented in Fig. 2.
| Material | As-received | HT950 | HT1100 |
|---|---|---|---|
| Average grain size (μm) | 28.1 | 28.7 | 36.0 |
Figure 3 displays the surface morphologies of the SLM SS316L samples after the potentiodynamic polarization test in a simulated PEMFC environment. From Figs. 3a and 3b, it is evident that the corrosion surface of the HT500 sample was similar to that of the as-received sample. The corrosion grooves at the cellular substructures and melt-pool boundaries were notably clear. Meanwhile, intense corrosion attacks occurred in areas close to melt-pool boundaries. Previous studies reported that melt-pool boundaries contain some defects, such as residual stress, a heat-affected zone, and a nonmetallic unstable state.31 Shifeng et al.32 reported that the concentration of nonmetallic elements (C, O, Si) near melt-pool boundaries greatly decreased. Therefore, the melt-pool boundary may be composed of an inhomogeneous microstructure that is preferentially corroded.31,32 After heat treatment at 950 and 1100 °C, these cellular substructures were not observed, as shown in Figs. 3c and 3d, respectively. The melt-pool boundaries disappeared, and only the corrosion grooves at the grain boundary were clear.26
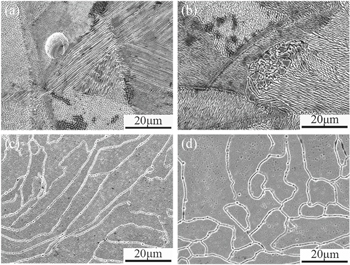
Figure 3. The surface morphologies of SLM SS316L sample after potentiodynamic polarization test at 70 °C in a 0.5 M H2SO4 + 2 ppm HF solution: (a) As-received, (b) HT500, (c) HT950, and (d) HT1100.
Download figure:
Standard image High-resolution imagePorosity has an important effect on the pitting corrosion resistance of SLM SS316L.33,34 In this work, the porosity of the as-received SLM SS316L sample was approximately 0.9%. In addition, the pore size of the as-received SLM SS316L samples was small (no pores were observed in the EBSD images). Sander et al.34 reported that SLM SS316L samples with different porosities had similar pitting corrosion resistances. Schaller et al.35 confirmed that large pores (>50 μm) were the primary reason for the reduced corrosion resistance in sample compared to that of samples with small pores (<10 μm). Therefore, in this study, it is thought that porosity had a marginal effect on the corrosion resistance.
Figure 4 shows an SEM image and a TEM image of the as-received sample. Distinct subgrain structures were observed in the etched surface morphology of the as-received sample, and the size of the subgrain was approximately 0.5–1 μm. Meanwhile, subgrain boundaries protruded from the surface compared to the center of the subgrain, indicating a better etch resistance. As shown in Fig. 4b, subgrain boundaries were entangled by a high concentration of dislocations, and dislocation walls revealed distinct contrast.

Figure 4. (a) SEM image of the as-received sample, (b) TEM image of the as-received sample.
Download figure:
Standard image High-resolution imageFigure 5 shows an SEM image and a TEM image of the HT950 sample. As shown in Fig. 5b, the migration and rearrangement of dislocations occurred. Only some dislocation lines and overlapped dislocations were observed. However, subgrain structures are also shown in Fig. 5a. After heat treatment at 950 °C, the subgrain structure began to disappear. Compared to the as-received sample, the subgrain boundaries became discontinuous and formed a homogeneously distributed island-like cellular trace microstructure.
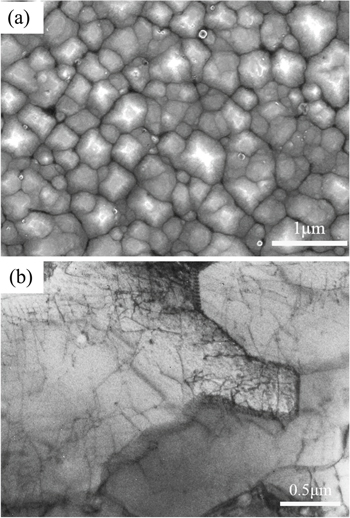
Figure 5. (a) SEM image of the HT950 sample, (b) TEM image of the HT950 sample.
Download figure:
Standard image High-resolution imageElectrochemical tests
Figure 6 displays the potentiodynamic polarization curves of SLM SS316L at 70 °C in a 0.5 M H2SO4 + 2 ppm HF solution. As observed, all the samples exhibited large passive regions in the potential range from 100 to 800 mVSCE. Generally, the passive current density is related to the stability of the passive film.36 The passive current densities and corrosion potentials obtained from the potentiodynamic polarization curves are listed in Table III. The as-received and HT500 samples had similar passive current densities, while the HT950 and HT1100 samples showed considerably lower passive current densities. This indicates that heat treatment at 950 and 1100 °C can greatly improve the stability of the passive film. Kong et al.27 also found that a SLM SS316L sample heat treated at 1050 °C displayed a lower passive current in simulated PEMFC environments, which is in good agreement with the results reported here.

Figure 6. Potentiodynamic polarization curves for SLM SS316L at 70 °C in a 0.5 M H2SO4 + 2 ppm HF solution.
Download figure:
Standard image High-resolution imageTable III. Passive current density at 0.6 VSCE (ipass) and corrosion potential (Ecorr) of the as-received and heat-treated SLM samples.
| Material | As-received | HT500 | HT950 | HT1100 |
|---|---|---|---|---|
| ipass at 0.6 VSCE (μA cm−2) | 46.1 ± 1.5 | 39.8 ± 2.5 | 6.5 ± 0.7 | 13.4 ± 2.1 |
| Ecorr (VSCE) | −0.261 ± 0.027 | −0.236 ± 0.052 | −0.309 ± 0.006 | −0.277 ± 0.014 |
Potentiostatic polarization tests were conducted at 0.6 VSCE for 4 h at 70 °C in a 0.5 M H2SO4 + 2 ppm HF solution; the results are shown in Fig. 7. For all the curves, the passive current density decayed rapidly at the beginning and then gradually maintained a relatively stable value, indicating the formation of a passive film. After all the passive current densities were stable, the order of the passive current densities was as follows: HT950 > HT1100 > HT500 > as-received.
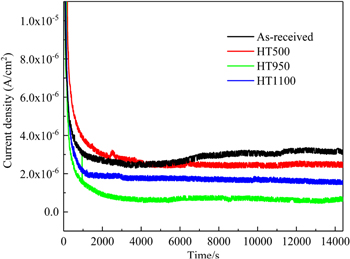
Figure 7. Potentiostatic polarization curves for SLM SS316L at 0.6 VSCE for 4 h at 70 °C in a 0.5 M H2SO4 + 2 ppm HF solution.
Download figure:
Standard image High-resolution imageEIS was performed after the potentiostatic tests at 0.6 V for 4 h at 70 °C in a 0.5 M H2SO4 + 2 ppm HF solution. The Nyquist plots of the as-received and heat-treated SLM SS316L samples are presented in Fig. 8. The Nyquist plots are composed of a capacitive arc. To calculate the resistance of the passive film, a simple equivalent circuit was employed (inset in Fig. 8). For the equivalent circuit, RS represents the solution resistance, CPE is the constant phase element, and R1 corresponds to the charge transfer resistance. Table IV lists the results obtained from fitting the EIS results. R1 of the as-received and HT500 samples exhibited a relatively low value, while the R1 value clearly increased after the high-temperature heat treatments. Moreover, the HT950 sample showed the highest charge transfer resistance, indicating that it had the best corrosion resistance. This result agrees well with the results of the potentiodynamic polarization curves (Fig. 6) and potentiostatic polarization curves (Fig. 7).

Figure 8. The Nyquist plot for SLM SS316L after potentiostatic test at 0.6 VSCE for 4 h at 70 °C in a 0.5 M H2SO4 + 2 ppm HF solution. The inset figure is the equivalent circuit.
Download figure:
Standard image High-resolution imageTable IV. The fitting results obtain from the EIS results.
| Material | Rs (Ω cm2) | CPE (10−5 Ω−1 cm−2 sα) | α | R1 (105 Ω cm2) |
|---|---|---|---|---|
| As-received | 0.81 ± 0.09 | 1.31 ± 0.07 | 0.895 ± 0.005 | 1.11 ± 0.07 |
| HT500 | 1.19 ± 0.05 | 0.92 ± 0.08 | 0.885 ± 0.003 | 1.13 ± 0.07 |
| HT950 | 1.78 ± 0.12 | 1.70 ± 0.11 | 0.941 ± 0.004 | 2.38 ± 0.15 |
| HT1100 | 0.86 ± 0.08 | 1.60 ± 0.19 | 0.912 ± 0.004 | 1.52 ± 0.21 |
Figure 9 shows the Mott-Schottky results of the SLM SS316L samples after the potentiostatic test at 0.6 VSCE for 4 h at 70 °C in a 0.5 M H2SO4 + 2 ppm HF solution. The space-charge capacitance (CSC) of the passive film of an n-type semiconductor can be calculated using Eq. 137,38:
where ε is the dielectric constant of the passive film, ε0 is the vacuum permittivity (8.854 × 10⁻¹⁴ F cm−1), e is the electron charge (1.602 × 10⁻¹⁹ C), ND is the donor density (cm−3), E is the applied potential (VSCE), EFB is the flat band potential (VSCE), K is the Boltzmann constant (1.38 × 10⁻²³ J K−1), and T is the absolute temperature (K). As shown in Fig. 9, all the curves had a positive slope in the potential range from 0 to 600 mV, indicating the formation of an n-type semiconducting passive film.39,40 Based on these linear domains, the donor densities of the passive film were obtained, as shown in Fig. 10. There was a high donor density in the as-received sample, which is attributed to the rapid cooling rate of SLM components. After heat treatment at 950 °C and 1100 °C, the donor density decreased considerably, indicating the formation of a more stable passive film. Morshed-Behbahani et al.41 also confirmed that a stabilization heat treatment (900 °C) was helpful in decreasing the defect concentration by homogenizing the distribution of Cr. Interestingly, the HT500 sample showed the highest donor density. This may be caused by the reduction in compressive residual stress after stress-relieving annealing. Similar results were also reported by Cruz et al. 42, where the donor density of the passive film increased after heat treatment at 450 °C and 650 °C.

Figure 9. Mott-Schottky plots for the as-received and heat-treated samples after potentiostatic test at 0.6 VSCE for 4 h at 70 °C in a 0.5 M H2SO4 + 2 ppm HF solution.
Download figure:
Standard image High-resolution image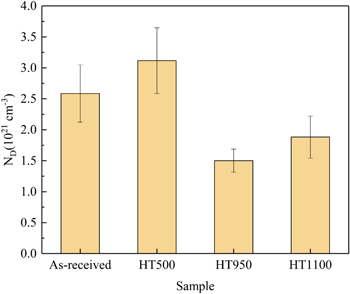
Figure 10. The donor density of the passive film formed on SLM SS316L.
Download figure:
Standard image High-resolution imageComposition of the passive film
To analyze changes in the composition after the various heat treatments, XPS was performed after the potentiostatic tests at 0.6 VSCE for 4 h. The passive film primarily contained the oxides and hydroxides of Fe and Cr, as shown in Fig. 11. The high solution spectra of Fe 2p3/2 were decomposed into three peaks: metallic Fe (707.3 eV), Fe3O4 (708.2 eV), and FeOOH (711.8 eV). There was a distinct metallic Fe peak, which is attributed to the thin passive film on SLM SS316L. The Cr 2p2/3 ionization was deconvolved into metallic Cr (574.5 eV), Cr2O3 (576.1 eV), and Cr(OH)3 (577.3 eV).

Figure 11. XPS results of SLM SS316L after potentiostatic test at 0.6 VSCE for 4 h at 70 °C in a 0.5 M H2SO4 + 2 ppm HF solution: (a1)-(a4) Cr-2p, (b1)-(b4) Fe-2p.
Download figure:
Standard image High-resolution imageBased on the fitted peak area, the cationic fractions of Cr and Fe and the Crox+hy/Feox+hy ratio are shown in Fig. 12. For all the samples, iron oxide was the primary component of the passive film. It is worth noting that the cationic fractions of the as-received, HT500, and HT950 samples were very similar. However, the Crox+hy/Feox+hy ratio of the HT1100 sample increased considerably. Cr(OH)3 was enriched in the passive film after heat treatment at 1100 °C, while only a slight increase in Cr2O3 content was observed. This may be caused by the partial elimination of the subgrain structures after recrystallization annealing. Fine-grained microstructures can reduce the diffusion channels of Cr to the surface.43

Figure 12. Metallic elements composition of passive film formed on SLM SS316L after potentiostatic test at 0.6 VSCE for 4 h at 70 °C in a 0.5 M H2SO4 + 2 ppm HF solution.
Download figure:
Standard image High-resolution image
Discussion
Effect of inclusions
In general, the pitting corrosion resistance of SLM SS316L is higher than that of wrought SS316L, because the rapid solidification process of SLM SS316L avoids the generation of inclusions (typically MnS). MnS inclusions may act as pit initiation sites and accelerate corrosion. According to a previous report29, MnS inclusions appeared after heat treatment above 1000 °C and led to a decrease in pitting resistance. However, Kong et al. 44 reported that no MnS inclusions were found after heat treatment at 1200 °C. This may be due to the low Mn concentration in SLM SS316L (0.42%), while the Mn concentration in other reports was above 1%. According to the previous research of our group25, Si-rich and O-rich inclusions were found after heat treatment at 1100 °C, but no MnS inclusions appeared (probably due to the low Mn concentration (0.23%)). In addition, the homogenous distribution of Cr around the oxide inclusions may avoid the reduction in local corrosion resistance.23 It is reasonable that inclusions have a certain degree of influence on corrosion resistance, but are not the primary factor.
Effect of heat treatment
Numerous studies have found that there are higher concentrations of Cr, Ni, and Mo at subgrain boundaries compared to the center of subgrains.23,34,45 The increase in alloying elements helps subgrain boundaries resist the attack of aggressive ions.46 This is beneficial to the corrosion resistance of subgrain boundaries. Kong et al. 47 reported that the Volta potential at the subgrain boundary was higher than that at the subgrain interior owing to the higher Cr and Mo concentrations at the boundary. Therefore, subgrain boundaries appear to act as physical barriers to resist corrosion attacks. It can be seen that fine subgrain structures play an important role in improving corrosion resistance.43 Revilla et al.46 suggested that SLM SS316L samples showed larger passivity compared to a LMD (laser metal deposition) sample in a 3.5 wt% NaCl solution, which they attributed to the finer subgrain network in the SLM SS316L samples. In summary, the effect of the subgrain structure on the passive film properties should be considered.
For the HT500 samples, although the annihilation of dislocations probably occurred, the microstructures (Fig. 3b) and passive film composition (Fig. 12) of the HT500 sample was similar to that of the as-received sample. It appears that the elimination of residual stress had a marginal effect on the corrosion resistance, which is consistent with previous research.27,42
After heat treatment at 950 °C, it can clearly be seen that dislocations were eliminated and rearranged (Fig. 5b) along with the partial annihilation of subgrain boundaries. However, it was reported that subgrain structures composed solely of dislocations (without Mo and Cr segregation) were found in additively manufactured 316L.48 Therefore, both subgrain structures (with Cr and Mo segregation) and pure dislocation cellular structures coexist in additively manufactured 316L. For pure dislocation structures, it is well known that an increase in dislocation density reduces corrosion resistance.49 The reduction in the local equilibrium potential in the dislocation-rich region promotes the dissolution of the anodic metal.50 After heat treatment at 950 °C, some of the dislocations were eliminated, resulting in the improved corrosion resistance of HT950. However, the microstructural variation (island-like cellular trace structures in HT950) of the subgrain structures during heat treatment is a direct result of the annihilation of dislocations and rearrangement of subgrain boundaries. According to a previous report,29 the alloying element segregation in subgrain structures showed good stability during heat treatment. This was caused by the distinct subgrain structures of SLM SS316L. During heat treatment at 950 °C, the pure dislocation subgrain boundaries quickly disappeared, while the subgrain boundaries with alloying element segregation were partially eliminated. This partial and incomplete homogenization of composition caused the formation of island-like cellular trace structures. However, it is difficult to obtain direct evidence (composition distribution of subgrains) owing to the limited instrument accuracy. However, from the EIS and passive current density results, the homogenization of the subgrain composition appears to be beneficial to the passivity of SLM SS316L. In general, high-temperature heat treatments (900 °C–1000 °C) improved the passive film properties of SLM SS316L.29,51 This provides a new idea for optimizing the corrosion resistance of SLM SS316L.
Due to complete recrystallization, the dislocation density of the HT1100 sample was markedly reduced compared to the as-received and HT950 samples (Figs. 2b, 2d, and 2f). Dislocation structures (subgrains) were partially or almost completely eliminated during heat treatment at 1100 °C, and the grain size increased. The XPS results demonstrated that heat treatment at 1100 °C promoted the formation of Cr(OH)3. Cr2O3 films have better corrosion resistance than Cr(OH)3 films, and Cr(OH)3 is formed by consuming Cr2O3.52,53 The lower Cr2O3/Cr(OH)3 ratio of the HT1100 samples compared to that of the HT950 samples resulted in a decrease in the passive film property after heat treatment at 1100 °C. However, the chemical segregation caused by recrystallization must be considered. Previous work from our group demonstrated that many nanoscale inclusions (enrichment of Si and O) are present in grains after heat treatment at 1100 °C. These inclusions may promote local corrosion.
Conclusions
This study systematically compared the effect of various heat treatments on the microstructural characteristics and passivation behavior of SLM 316L. The main conclusions are as follows:
The cellular subgrain structures of the SLM SS316L samples were entangled by chaotic high-density dislocation walls. After heat treatment at 950 °C, dislocations migrated, and subgrain structures became island-like cellular trace structures.
As shown in the EBSD and XPS results, the microstructure and passive film composition did not change significantly after heat treatment at 950 °C.
The lowest passive current density was achieved by the HT950 sample, which may be related to the microstructural variation. Compared to the as-received SLM SS316L, dislocations in the HT950 sample were annihilated, and the distribution of the alloying elements in the HT950 sample was more uniform, leading to the formation of a more stable and compact passive film.
Compared to the SLM SS316L sample heat treated at 950 °C, the sample treated at 1100 °C showed a lower corrosion resistance. This is attributed to the formation of more Cr(OH)3 in the passive film and chemical segregation after complete recrystallization.
Acknowledgments
This research was supported by the National Key Research and Development Program of China (2019YFB150530202), the National Natural Science Foundation of China (51971204), the Zhejiang Provincial Natural Science Foundation of China (LY19E010006), and the Zhejiang Provincial Natural Science Foundation of China (LY21E010005).
Data availability statement
The raw/processed data required to reproduce these findings cannot be shared at this time as the data also forms part of an ongoing study.