
Abstract
In order to understand the lithium-ion battery (LIB) failing behavior and to prevent failures and their consequences, different LIB safety tests, also called abuse tests, have been developed. This paper focuses on thermal runway (TR) triggered by overtemperature, overcharge and nail-penetration. It shows the setup and the results of the three different TR triggers on two different cell types in a custom-made TR reactor. The investigated cell types are state-of-the-art automotive pouch and hard case cells. The results are discussed in three main categories: thermal behavior, vent gas production and vent gas composition. The results and findings are supposed to be valuable for battery pack designer, car manufacturer and testing institutions for the development of future battery testing facilities and regulations.
Export citation and abstract BibTeX RIS

This is an open access article distributed under the terms of the Creative Commons Attribution 4.0 License (CC BY, http://creativecommons.org/licenses/by/4.0/), which permits unrestricted reuse of the work in any medium, provided the original work is properly cited.
This paper 436 was accepted to be presented at the Montreal, QC, Meeting of the Society, May 10–14, 2020.
It is important to reduce the risk of failing enhanced li-ion batteries (LIB) in electric vehicles (EV) and consumer electronic products. Failure cases of LIB may cause high temperatures and undesirable chemical reactions, which can result in exothermic reactions with the worst case, the thermal runaway (TR). These failure cases need to be analysed and have to be avoided reliably in operation because they cause serious safety and health risks like explosion, fire, toxic (CO, HF...) and flammable (CO, H2, CH4, C2H4, electrolyte...) atmosphere.1–3
Thermal, electrical and mechanical abuse scenarios attempt to mimic the behavior of the failing battery in real applications.4,5 Different kinds of battery abuse tests were developed and investigated.6 The tests are carried out and documented in literature on single cell, module or even battery pack level. Popular examples are: TR triggered by overtemperature, hot spots, overcharge, external and internal short circuit, crush or the penetration of the cell with foreign objects, like nail-penetration.7
Experts from United Nations Economic Commission for Europe (UNECE) discuss suitable TR tests for the "Electrical Vehicle Safety—Global Technical Regulation" (EVS-GTR). Due to missing standardized TR test procedures and varying cell formats there is currently no agreement which test procedure should be favored to accurately define the TR.8,9 TR-propagation regulation (TF5) being developed in EVS-GTR contains three testing methods: heating, overcharge and nail-penetration.10
How do the suggested testing methods/triggers (heating, overcharge and nail-penetration) influence the TR behavior and the TR results? And does a different EV cell designs, such as currently used pouch cells or hard case (also named prismatic metal can) cells, influence the results of different TR trigger?
In general, requirements for TR test methods are to be meaningful (i.e. field-relevant), realistic, reproducible, easy to perform by different test labs and they should not be easy to manipulate. According to Feng et al. there is a lack of reproducibility in nail-penetration and overcharge tests.11 Feng et al. reviewed abuse conditions of LIBs during accidents and stated that overcharge induced TR can be harsher than other abuse conditions, because of excessive energy filled into the LIB.11 Diaz et al. compared the gas generation of 2.5 Ah LiCoO2 (LCO) pouch cells and 3 Ah LCO, 2.6 Ah LiNiMnCoO2 (NMC) and 1.1 Ah LiFePO4 (LFP) cylindrical cells at thermal abuse and nail-penetration and detected significant lower vent gas amount and mass loss for nail-penetrated cells than for thermal abused cells.12 For nail-penetrated cells without TR, less than 20% of the vent gas and less toxic gas were produced than during thermal abuse at the same state-of-charge (SOC) (100%).12 Fernandez et al. explained differences in gas composition results from their overcharge abuse tests on 2.5 Ah LFP cells and overtemperature results in literature with the influence of different temperature inside and outside the cell on the vent composition.13 Koch et al. tested sensors at TR on modules with heating and nail-penetration,14 but did not present the results of the different triggers concerning temperature of the failing cell, the amount of vent gas or the gas composition. Larsson et al. published abuse tests by external heating, overcharge and short circuit of LFP and stated that overcharge or heating can theoretically end up in more severe reaction then in other abuse tests, due to the input of electric power or heat.15
Concluding, the type of abuse affects the cell reaction and the TR results,12,13,15 but a detailed comparison of the thermal behavior, the vent gas emission and the vent gas composition is currently not available in open literature.
The influence of different cell design on the failing behavior: Koch et al. stated that the "basic" effects occurring at the TR (loss of cell voltage, self-heating of the cell, production of gas, cell rupture, particle ejection) are similar for all cell types (cylindrical hard case, prismatic hard case and pouch cell).14 Beside the similar basic TR effects, the cell and venting design affects the cell reaction and might result in different thermal response of the cell, vent gas amounts and vent gas velocities.12,16,17 Hard case cells have usually a defined cell vent, the so-called burst plate or safety vent. This burst plate is the weakest point of the cell casing and opens if a defined pressure inside the cell is reached. Pouch cells on the other hand have no defined cell vent and rupture along the pouch welded sides. Typically, the hard case cells can resist higher internal pressures than the soft pouch package.18 Koch et al. identified more solid mass ejection during TR for hard case cells than for pouch cells and explains the observation with the higher stream velocities through the burst plate.17 Huang et al. shows the failing behavior of 40 Ah NMC pouch and prismatic cells at 1 C overcharge experiments.19 The pouch cell reached higher maximum temperature on the cell surface than the prismatic cell, although the pouch cell had a better overcharge tolerance.19 Additionally, the cell design, format and use of the package material (pouch, hard case) may influence the TR propagation as stated in Ref. 18.
A detailed comparison of results of different TR triggers tested on high capacity NMC cells, which is currently one of the focused cell chemistries for EVs, is missing in current literature. Additionally, information on the failing behavior of two commonly used EV cell types (pouch vs hard case) would be relevant for the scientific community in this field. This information is of relevance for various R&D activities towards significant safety improvements of batteries.
Therefore, we aim in this publication to compare the results of three different TR triggers (overtemperature, overcharge and nail-penetration) on two different automotive NMC cell types (pouch and hard case). Both cell types have a high capacity (60 Ah) and a high energy density and are used in modern EVs. Each experiment is repeated in order to comment on the reproducibility of the experiments. Hazards from these automotive NMC cells have, to the authors' knowledge, not been the subject of any scientific publication, but, as will be shown, are important to investigate.
Experimental
Two different cell types (♯1 and ♯2) are tested inside the TR reactor with three different TR triggers (overtemperature, overcharge, nail-penetration) see Fig. 1. For cell type ♯1 and cell type ♯2 each experiment is repeated.

Figure 1. Experiment overview: two cell types (♯1 pouch and ♯2 hard case) are tested in three different TR triggers (overtemperature, overcharge and nail-penetration) one after the other. The results are discussed in three main categories: thermal behavior, vent gas production and vent gas composition.
Download figure:
Standard image High-resolution imageInvestigated cell
Two automotive cell types with the same nominal capacity (60 Ah) and different cell design (pouch ♯1 vs hard case ♯2) are investigated (Table I). Both cell types ♯1 and ♯2 consist of a NMC cathode with the same proportion of Ni, Mn and Co (622) and a graphite anode, but different electrolyte mixtures. The presented cell types are designed for EV applications and are used in currently available commercial EVs. All tested cells are fresh, unused, and charged to 100% SOC before the experiments start.
Table I. Specification of the automotive li-ion cells.
| Parameter | Cell Type ♯1 | Cell Type ♯2 |
|---|---|---|
| Design | pouch | prismatic hard case |
| Cathode Material | NMC | NMC |
| Anode Material | graphite | graphite |
| Electrolyte | EC:EMC (1:1) | EC:DMC:EMC (2:3:3) |
| Nominal Voltage | 3.6 V | 3.6 V |
| Gravimetric Energy Density | 250 Wh kg−1 | 225 Wh kg−1 |
| Aging State | fresh, unused | fresh, unused |
| Start SOC | 100% | 100% |
| Cell Thickness | 11.2 mm | 28.0 mm |
Reactor setup and experimental method
The TR experiments are carried out inside a gastight 40 bar pressure resistant stainless-steel reactor. This custom-made reactor is shown in Fig. 2 and published in Refs. 3, 20, 21. In Fig. 2 and Figs. 3a and 3b the standard sample holder for overtemperature and overcharge experiments is shown. It consists of a lower and an upper stainless-steel plate. The cell is positioned horizontally between the two plates. The setup can apply a defined force to the cell (3000 N, recommended by our industry partners) using four springs. Between the cell and the two stainless-steel plates mica sheets are applied to minimize the thermal coupling between the stainless-steel plates and the cell. This insulating mica sheets (thermal conductivity of 0.23 W mK−1) are 2 mm thick and provide channels for the thermocouple wires. The thermocouples are positioned in well-defined distances to each other depending on the cell geometry. The tips of the thermocouples protrude through the mica sheets and are squeezed between the mica sheet and the cell surface. Because the mica sheets are thermal insulators, the thermocouple tips measure the cell surface temperature. Instead of the described standard sample holder also different other sample holders can be positioned inside this reactor. Figure 3c presents the nail-penetration add on to the upper sample holder plate. Inside each sample holder, the cell is electrically connected to a cycler. The reactor, including the implemented standard sample holder, has a free volume of 121.5 l. The experiments are carried out in N2 atmosphere.

Figure 2. Stainless-steel reactor setup. Inside the reactor the cell sample is fixed inside the sample holder. The presented sample holder is used for overtemperature and overcharge experiments. For nail-penetration a different upper sample holder plate is used (see Fig. 3c).
Download figure:
Standard image High-resolution image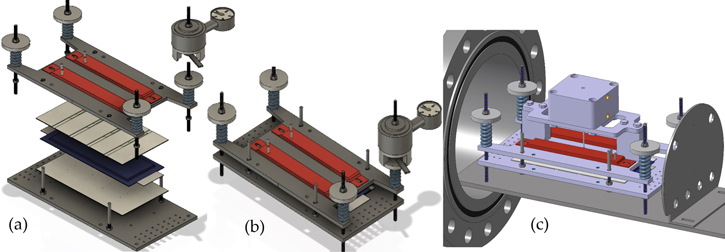
Figure 3. Sample holder setup: (a) the components of the standard sample holder and (b) the assembled standard sample holder. The standard sample holder consists of two stainless-steel plates (dark grey) with two heater stripes (red) on the top and two on the bottom side of the stainless-steel plates, mica sheets (beige) with thermocouples between the cell (symbolic design of a pouch cell (blue)) and the stainless-steel plate. With four springs a defined force can be applied to the cells. (c) shows the additional nail-penetration setup positioned on the top of the upper stainless-steel plate.
Download figure:
Standard image High-resolution imageAfter the cell is positioned in the sample holder inside the reactor and the measurement equipment is fixed, the reactor is closed and flushed with nitrogen. When the setup is prepared, different triggers are tested on single cells.
Trigger
The TR is triggered for each cell type ♯1 and ♯2 by three different methods:
- Overtemperature: homogenously external heating of the two largest surfaces of the cell. On top and bottom of the two sample holder plates, heater stripes with a heating power of max. 500 W are applied (see red heater stripes in Figs. 3a and 3b). The overtemperature experiment is designed to increase the cell surface temperature with ∼2 °C min−1. Two ventings are expected: a first venting and opening of the cell due to decomposition of overheated cell materials such as electrolyte, and a second venting accompanied by violent gas and particle emission during TR.20
- Overcharge: charging the cell with 1 C rate (1 C is the cell capacity divided by 1 h) until the TR happens. The final SOC is calculated with coulomb counting (integrate current (A) over time). At the hard case cells an overcharge safety device (OSD) is implemented. In order to trigger the cell into false state by overcharge, this OSD needed to be blocked, otherwise it would disconnect the cell tabs and the active material and the cell cannot be charged anymore. This blocking is done by isolating the corresponding cell tab from the OSD. The isolation is done outside of the cell casing. Therefore, the cell casing remains closed and the inside of the cell is not influenced.
- Nail-penetration: a nail (material: 42CrMo4) with 3 mm diameter and 60° angle of the nail tip is pushed with compressed air into the center of the large surface of the cell. The nail is inserted 8 mm into the cell. Only one venting is expected immediately after the penetration of the nail into the cell.
Measured parameters and definition of safety relevant parameters at TR
The results of differently triggered TR are compared in three main categories: thermal behavior, vent gas production and vent gas composition.
Thermal behavior
Inside the reactor, the temperature behavior of the cell is recorded with type-K thermocouples on both sides of the cell surface (type ♯1 and ♯2), the cell tabs (type ♯1) and close to the burst plate of the cell (type ♯2). Additionally, the temperature inside the TR reactor (type ♯1 and ♯2) is measured. Since the pouch cell (type ♯1) design has no defined burst plate like the prismatic metal can cell, three thermocouples were positioned on the welded pouch foil on the long side of the cell. The thermocouple positions for both cell types are shown in Fig. 5. Different thermocouple patterns were used because of the different geometries of both cell types. Safety relevant parameters are:
-
 (°C) the average measured temperature of all thermocouples on the cell surface when the first venting starts
 -
(°C) the temperature of the one cell-surface thermocouple, which is the first to exceed the temperature rate of 10 °C min−1 (detailed description in Ref. 20)
-
(°C) the average measured temperature of all thermocouples on the cell surface when the second venting starts
-
(°C) the maximum recorded temperature of one of the thermocouples on the cell surface
-
(°C) the maximum recorded temperature of one of the thermocouples at the venting positions
-
(°C) the average gas temperature inside the reactor.


Vent gas production
With GEMS 3300B06B0A05E000 pressure sensors inside the reactor, the pressure increase due to gas generation is recorded during the whole TR experiment. With the ideal gas law, the amount of produced, not condensed vent gas can be calculated. The same calculation is used as presented in Ref. 20 Safety relevant parameters are:
- nv (mol or liter) the total amount of released gas (in STP: 298.15 K, 100 kPa)
- nv1 (mol) the amount of gas produced starting at and ending at the
- nv2 (mol) the gas produced after and during the TR
 ̇ch (mol s−1 or l s−1) the characteristic venting rate based on the minimal duration Δt50% (s) when 50% of the venting gas nch50% (mol) is produced.


Vent gas composition
The vent gas composition is measured with Fourier Transform Infrared (FTIR) spectrometer and gas chromatograph (GC) in parallel after the TR. The pipes from the reactor towards the gas analysis are closed during the TR experiment and opened after the TR happened. They are heated to 130 °C. Safety relevant parameters are the quantified gas concentrations of gases like: H2, CO, CO2, CH4, C2H6, C2H4, C2H2, DEC, DMC, EC, EMC, H2O, C6H14, HF, C4H10, C3H8 and O2. Since N2 is not produced by battery failures, N2 is used as inert gas.
The reactor gas consists of the inert gas N2 and the vent gas, which is added by the failing cell. Since the produced vent gas does not contain N2, the amount of N2 in the reactor gas can be subtracted to calculate the concentration of each component of the vent gas only. The concentration of any gas component (cv/%) in the vent gas is calculated with the measured concentration of this gas component in the reactor gas (cm) and the measured N2 concentration (cN2) in the reactor gas:

A Bruker MATRIX-MG01 FTIR is used with 0.5 cm−1 wavenumber resolution and N2(l) cooled MCT detector. The measurement chamber itself is heated to 190 °C and the interior space of the spectrometer is purged with N2(g) for at least 2 h. For the background measurement 100 scans are averaged. A number of 40 scans are used for each data point.
For gas analysis with GC, the 3000 Micro GC (G2802A) is used with three columns and TCD detectors. The three-channel system includes Molsieve (10 m × 320 μm × 12 μm), Plot U (8 m × 320 μm × 30 μm) and OV1 (8 m × 150 μm × 2,0 μm). The injector temperature and the sample inlet temperature are set to 100 °C for all three channels. The column temperature of the Molsieve channel is 80 °C (at 30 psi) and 60 °C for the Plot U and OV1 channel (40 psi each). Injection time for Molsieve and Plot U is 15 ms and 10 ms for the OV1 channel.
The duration of the venting during TR is defined as the time between the start of the TR (at the second venting when the pressure increase inside the reactor exceeds 200 mbar s−1) until the maximum pressure in the reactor is reached.
After finishing the vent gas composition measurement, the experiment after-treatment is started. This experiment after-treatment consists of the following steps: the reactor is heated up to 200 °C, evacuated to about 1 kPa absolute pressure and flushed with N2 several times before the reactor is opened again. Because each TR trigger experiment is repeated, for the safety relevant parameters, such as the maximum reached cell surface temperature, the average value of the repeated experiments is presented with a standard deviation.
Results and Discussion
In total twelve TR experiments on single EV cells were conducted (see Fig. 4).

Figure 4. Experiment matrix: for each cell type (♯1 and ♯2) two overtemperature, two overcharge and two nail-penetration experiments were conducted.
Download figure:
Standard image High-resolution imageEach cell was triggered into TR. The experiments were reproducible in the categories thermal, electrical, mechanical and venting behavior. As Koch et al. referred in Ref. 14 the basic effects occurring during the TR (loss of cell voltage, self-heating of the cell, production of gas, cell rupture, particle ejection) cell were very similar for both cell types, but there are small but safety relevant differences in the failing behavior of both cell types and for the three different triggers:
- Overtemperature: The homogenous heating from both large sides of the cell forced cell type ♯1 to the first venting at (121 ± 1) °C and cell type ♯2 at (138 ± 1) °C. The first venting can be explained by pressure increase inside the cells due to gases produced at the solid electrolyte interface (SEI) decomposition,18,22 electrolyte decomposition23 and continuous evaporation of the electrolyte.3 The cell casing opens at the weakest point. After the first venting and the continuous heating, the critical temperature for TR of cell type ♯1 was reached at (206 ± 1) °C and for cell type ♯2 at (192 ± 1) °C. Reaching the critical temperature indicates the start of the exothermic process inside the cell, which accelerates the self-heating of the cell and results in a TR. Gas producing reactions are the reaction of the conducting salt with solvent and the SEI,24–26 the reaction of intercalated lithium in the anode and electrolyte initiated by the SEI breakdown27 and the decomposition of the cathode producing oxygen,28,29 which further reacts with the electrolyte.30,31
- Overcharge: The cell type ♯1 was triggered into TR by charging with 1 C up to (146 ± 1)% SOC ending up in (4.93 ± 0.03) V before the voltage dropped completely. Cell type ♯2 was triggered into TR after reaching (147 ± 1)% SOC, which is similar to the SOC of cell type ♯1. Cell type ♯2 ended in (4.85 ± 0.09) V before the voltage dropped completely. In the overcharge failure case after the anode is fully lithiated, lithium metal deposits on the anode surface during overcharge.32,33 Additional to the above-mentioned reactions in overtemperature failure, this lithium deposit reacts with the electrolyte under generation of heat and gas.32 Two ventings were detected for both cell types in the overcharge trigger: the pouch cell vented 240 s and the hard case cell 50 s before the second venting started. Huang et al. observed a better overcharge tolerance (using 1 C) for tested pouch cells (154.6% SOC) than for the tested metal can cells (148% SOC) with the same capacity, active material and electrolyte composition (40 Ah, NMC111, EC:DEC:DMC = 1:1:1).19 In this study, the capacity of the two commercial cell types is the same, but the cells are series products of two different cell manufacturer and the exact active material and electrolyte composition is not the same and different additives might be added.
- Nail-penetration: Immediately after inserting the nail 8 mm deep into the cells, type ♯1 and type ♯2 cells were triggered into the TR and the voltage dropped to zero. Sparks were visible at the intrusion of the nail. In nail penetration, a high discharge current passes through the cell, which leads to heat generation due to joule heat. This heat generation leads to decomposition and release of oxygen of the delithiated cathode.34 Neither cell type was completely penetrated by the nail (see cell thicknesses in Table I).
The following results and discussion are structured in the three main categories: thermal behavior, vent gas production and vent gas composition, and minor categories: mass loss and reproducibility. In each category, the results of the three different triggers are presented. First the results of cell type ♯1 are presented, then the results of cell type ♯2. In the end of each category, the results of the two different cell designs are compared and discussed.
Thermal behavior
Figure 5 shows the temperature measured on the cell surface, vent positions and inside the reactor for all three TR trigger of one representative experiment for each cell type. The first venting of the cells can be identified as a small increase in the temperature and reactor pressure signal for both cell types. In Figs. 5a, 5b, 5d and 5e the first venting of the cells is marked with a red dot.

Figure 5. Temperature response of one representative (a) (d) overtemperature, (b) (e) overcharge and (c) (f) nail-penetration experiment of cell type ♯1 and ♯2 in comparison. For cell type ♯1 nine thermocouples are positioned on both large cell surfaces in a cross pattern (red) to document the cell surface temperature, four thermocouples are positioned inside the TR reactor (pink) to measure the gas temperature in the reactor at different positions, three thermocouples are positioned in the pouch foil welded sides (blue) to measure the vent gas temperature and two thermocouples are positioned on each terminal of the cell (black). For cell type ♯2 nine thermocouples are positioned on both large cell surfaces in a 3 × 3 pattern (red) to document the cell surface temperature, four thermocouples are positioned inside the TR reactor (pink) to measure the reactor temperature at different positions, three thermocouples are positioned in front of the burst plate (blue) to measure the vent gas temperature. The cell voltage is plotted on the second y-axis with a dashed line (green).
Download figure:
Standard image High-resolution imageIn the overtemperature triggered TR
(Figures 5a and 5d) the temperature of the cell surface increased constantly due to the homogenous heating from both sides of the sample holder. In Table II the thermal parameters are compared for both cell types and all three TR trigger. The first venting  of the cell type ♯1 happened at a lower average cell surface temperature (difference of 18 °C) than of cell type ♯2. The second venting
  for type ♯1 is (204 ± 1) °C, which is higher than for cell type ♯2 at (190 ± 2) °C. The maximum recorded temperature
  is similar for both cell designs.
  for cell type ♯1 reached 584 °C, which is a lower temperature than measured at the cell surface. This is due to the undefined pouch foil opening. In comparison,
  for cell type ♯2 with the defined cell opening reached more than 1200 °C.
Table II. Thermal parameters of two automotive cell types in overtemperature, overcharge and nail-penetration abuse tests in comparison.
| Overtemperature | Overcharge | Nail-penetration | ||||
|---|---|---|---|---|---|---|
| cell type ♯1 pouch | cell type ♯2 hard case | cell type ♯1 pouch | cell type ♯2 hard case | cell type ♯1 pouch | cell type ♯2 metal can | |
 (°C) (°C) |
121 ± 1 | 138 ± 1 | 56 ± 1 | 66 ± 9 | — | — |
 (°C) (°C) |
206 ± 1 | 192 ± 1 | — | — | — | — |
 (°C) (°C) |
204 ± 1 | 190 ± 2 | 82 ± 17 | 96 ± 4 | — | — |
 (°C) (°C) |
819 ± 5 | 782 ± 50 | 906 ± 146 | 579 ± 139 | 783 ± 1 | 743 ± 33 |
 (°C) (°C) |
584 ± 1 | 1169 ± 39 | 1044 ± 271 | 1021 | 482 ± 127 | 850 ± 185 |
In the overcharge triggered TR
In Fig. 5b for the pouch cell and (e) for the hard case cell, a first venting happened for cell type ♯1 at (56 ± 1) °C and for cell type ♯2 at (66 ± 9) °C. The first venting is detected as a small increase of the temperature signal and cross checked with video recordings inside the test chamber.  in overcharge experiments is not as meaningful as in overtemperature experiments, but also shows that cell type ♯2 can withstand higher internal pressure than the soft pouch foil, although the aluminum hard case is a better heat conductor than the pouch foil. The second venting in the overcharge trigger is measured at (82 ± 17) °C for cell type ♯1 and at (96 ± 4) °C for cell type ♯2. In comparison to overtemperature trigger, in overcharge the temperature of second venting decreases due to the destabilization of the cathode and the Li plating at the anode side. The maximum recorded temperature
  is for type ♯1 (906 ± 146) °C and for type ♯2 (579 ± 139) °C. In the case of cell type ♯2 the jelly roll was found outside of the aluminum housing after the experiment. Therefore, the thermocouples on the aluminum hard case measured a lower maximum cell-casing surface temperature because the reacting active material was not inside the case anymore.
  for cell type ♯1 reached in one experiment also temperatures above 1000 °C.
  for cell type ♯2 reached 1021 °C in one experiment and in the second experiment all thermocouples at the vent position were destroyed during the TR and the vent gas temperature could not be measured.
In the nail triggered TR
Figure 5c for the pouch cell and (f) for the hard case cell the first venting happened at the nail-penetration itself and both cell designs heated up exothermally immediately after the nail-penetration of the cells. The maximum recorded temperature  is similar for both cell designs. For cell type ♯1
  is lower than the maximum recorded cell surface temperature.
  for cell type ♯2 reached again temperatures above 1000 °C.
Independent of the trigger and the cell design, in each experiment the maximum measured cell-case temperature was above 718 °C, which is higher than the melting temperature of aluminum. The highest 
 was measured for cell type ♯1 in the overcharge triggered experiment (see Table II and Fig. 7a).
Comparing the results of cell type ♯1 and ♯2
As reported by Pfrang et al.18 we observed that metal can cells can withstand a higher internal pressure until they open compared to pouch cells. This can be observed in overtemperature and overcharge experiments. We also measured the maximum expansion of the cell during the experiment against the spring force of the sample holder with a micrometer screw. Then we calculated the force with which the cell presses against the upper pressure plate. This force divided by the area of the cell gives the pressure. This pressure was evaluated for the pouch cells and the metal can cells. For the pouch cell we observed values between 223 kPa–411 kPa and for the metal can cell 386 kPa–855 kPa before the first venting. With video recordings we can prove that the maximum expansion of the cell is reached before the first venting. These observed pressure values also prove, that the pouch cells open at a lower internal pressure than the metal can cells. The temperature at the first venting of the pouch cell is consistent with the temperature of 120 °C reported by Ren et al. on overheated 24 Ah pouch cells in Ref. 35. When the burst plate of the hard case cells opens, at the first venting gas is ejected. At the second venting and TR at both cell types, gas and particles with high temperatures are ejected.3 The second venting  and the critical temperature
  for cell type ♯1 was observed in overtemperature trigger at a higher temperature than for cell type ♯2. This indicates that cell type ♯1 can withstand overtemperatures longer than type ♯2. Reason for the higher
  and
and  for cell type ♯1 might be the different delithiation percent of the cathode and consequently the cathode stability, the stacking of the active layers or the earlier opening of the pouch foil. The percent of delithiation of the cathode and lithiation of the anode at 100% SOC are not known and are not analysed in this study. What is known is, that both cell types have NMC cathode and graphite anode and are series products from two different cell manufacturer. The two cells types have different electrolyte composition, different packaging material, the active material is stacked inside the pouch foil and rolled inside the hard case.
 for cell type ♯2, the hard case cell, reached in all three trigger types higher maximum values than the pouch cell design type ♯1. This can be explained due to the defined venting of the hard case cell. The vent gas temperature can be measured more easily for hard case cells with a defined burst plate, than for pouch cells, because the pouch foil can open at all pouch welded sides simultaneously. Nevertheless, the nail-penetration experiment showed that the vent gas of the pouch cell (type ♯1) can also reach temperatures above 1000 °C. It needs to be mentioned that the maximum measured vent gas temperature might also be affected by the ejection of hot particles.
The maximum recorded temperature  does not vary significantly for both cell types. But comparing the average
  for all three triggers in Figs. 7a and 7e the cell type ♯1 reached higher values than cell type ♯2, especially in the overcharge experiment. Huang et al. also observed in overcharge experiments that the pouch cell reaches higher maximum temperature on the cell surface than the prismatic cell.19 Additionally, the slightly higher
  for cell type ♯1 might also indicate the influence of the higher energy density of cell type ♯1 compared to type ♯2. The influence of the energy density on the
  is published in Ref. 36.
Although several thermocouples on the cell surface are used in the experiment, the thermocouple positions in our test setup are limited in amount and in position. At some experiments the thermocouple is close to the hottest position of the cell, and sometimes not. The hottest position on the cell surface is not known before the experiment. Therefore, sometimes a higher deviation of the recorded  and also
  from one experiment to the other experiment was observed. Other temperature values such as
 and
and  have a good reproducibility (see Table II).
Vent gas production
As reported in the overtemperature and overcharge experiments, a first venting and opening of the cell case was observed at both cell types before the TR.
In the overtemperature triggered TR
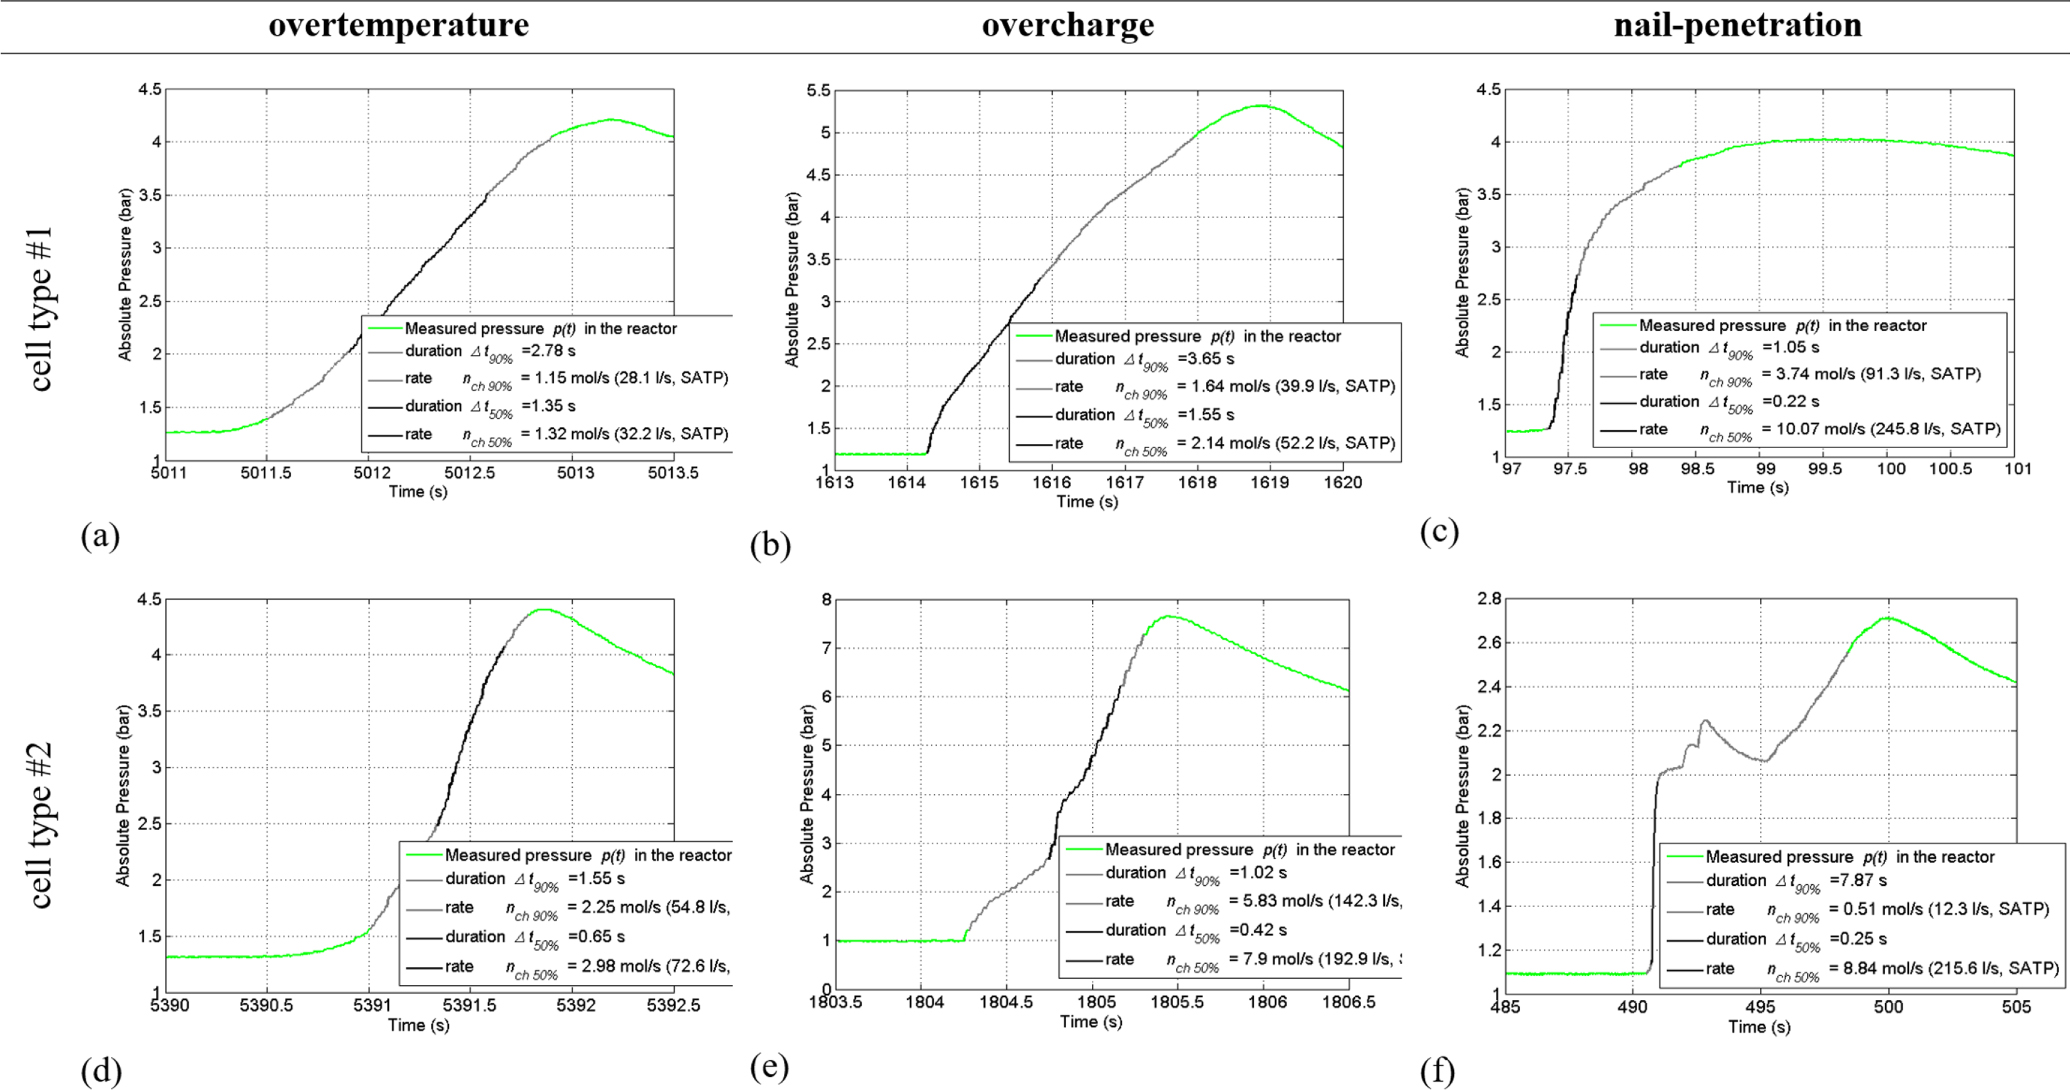
The pressure inside the reactor increased slowly after the first venting and opening of the cells ending up in nv1 = 0.15 mol of gas before the TR. The continuous pressure increase is due to the ongoing evaporation of electrolyte out of the opened cell. During the main TR reaction, both cell types released significant additional amount of gas and the pressure inside the sealed reactor increased within seconds up to a maximum value shown in Fig. 6a for cell type ♯1 and (d) for cell type ♯2. The duration of the venting during TR of cell type ♯1 was (3.5 ± 0.1) s. In this time the main amount of gas was produced with a characteristic venting rate of ̇ch = (34 ± 2) l s−1. The cell type ♯2 released gas in less time (2.0 ± 0.1) s than type ♯1. The characteristic venting rate of cell type ♯2 was therefore higher ̇ch = (67 ± 4) l s−1. Cell type ♯1 produced in total (1.56 ± 0.04) l Ah−1 in the overtemperature experiment. For cell type ♯2 also (1.56 ± 0.05) l Ah−1 were measured. The produced gas amount fits to reported values in literature between 1.2–2 l Ah−117,22,23 for overtemperature triggered NMC cells.

Figure 6. Measured pressure response inside the reactor (green) during the TR of one representative (a) (d) overtemperature, (b) (e) overcharge and (c) (f) nail-penetration experiment of automotive cell type ♯1 and ♯2 in comparison. In the graph the minimal time when 50% of the gas is produced is marked with a black line. The time when 90% of the gas is produced is marked in grey. The experiment time in seconds (s) is plotted on the x-axis.
Download figure:
Standard image High-resolution imageIn the overcharge triggered TR
The first venting ended up in nv1 = 0.13 mol of gas for both cell types. During the main TR reaction, both cell types released significant amounts of gas and the pressure inside the sealed reactor increased up to a maximum value shown in Fig. 6 for (b) cell type ♯1 and (e) cell type ♯2. The duration of the venting during TR for cell type ♯1 was (5.2 ± 0.8) s with a characteristic venting rate of ̇ch = (47 ± 4) l s−1. The cell type ♯2 released during the TR in (1.1 ± 0.1) s gas with consequently much higher characteristic venting rate of ̇ch = (250 ± 56) l s−1. Cell type ♯1 and ♯2 produced in total significantly more gas during overcharge than during overtemperature. Cell type ♯1 released (2.79 ± 0.02) l Ah−1 and cell type ♯2 (2.65 ± 0.06) l Ah−1.
In the nail triggered TR
Both cell types released significant amounts of gas immediately after the nail penetrated the cell. The pressure inside the sealed reactor increased up to a maximum value shown in Fig. 6 for (c) cell type ♯1 and (f) cell type ♯2. The duration of the venting during TR of the stacked cell type ♯1 in nail-penetration was (3.1 ± 0.9) s, which was faster than in overtemperature or overcharge. The characteristic venting rate of cell type ♯1 in nail-penetration is therefore ̇ch = (182 ± 65) l s−1. The cell type ♯2 behaves differently than the pouch cell, because the gas release took (11.5 ± 2.5) s during the TR. In Fig. 6f a stepwise increase of the pressure inside the reactor can be seen. The characteristic venting rate of cell type ♯2 in nail-penetration is ̇ch = (140 ± 76) l s−1. Cell type ♯1 produced in total (1.71 ± 0.07) l Ah−1 in nail-penetration experiments and cell type ♯2 also (1.77 ± 0.03) l Ah−1. In nail-penetrated TR, less gas is produced than in the overcharge triggered TR, but more gas than in the overtemperature triggered TR (see Figs. 7b and 7f). Therefore, we do not confirm the statement of Diaz et al., that for nail-penetrated cells lower vent gas amounts are produced than in thermal abused cells. The divergence of the observations might be because Diaz et al. did not observe a TR.

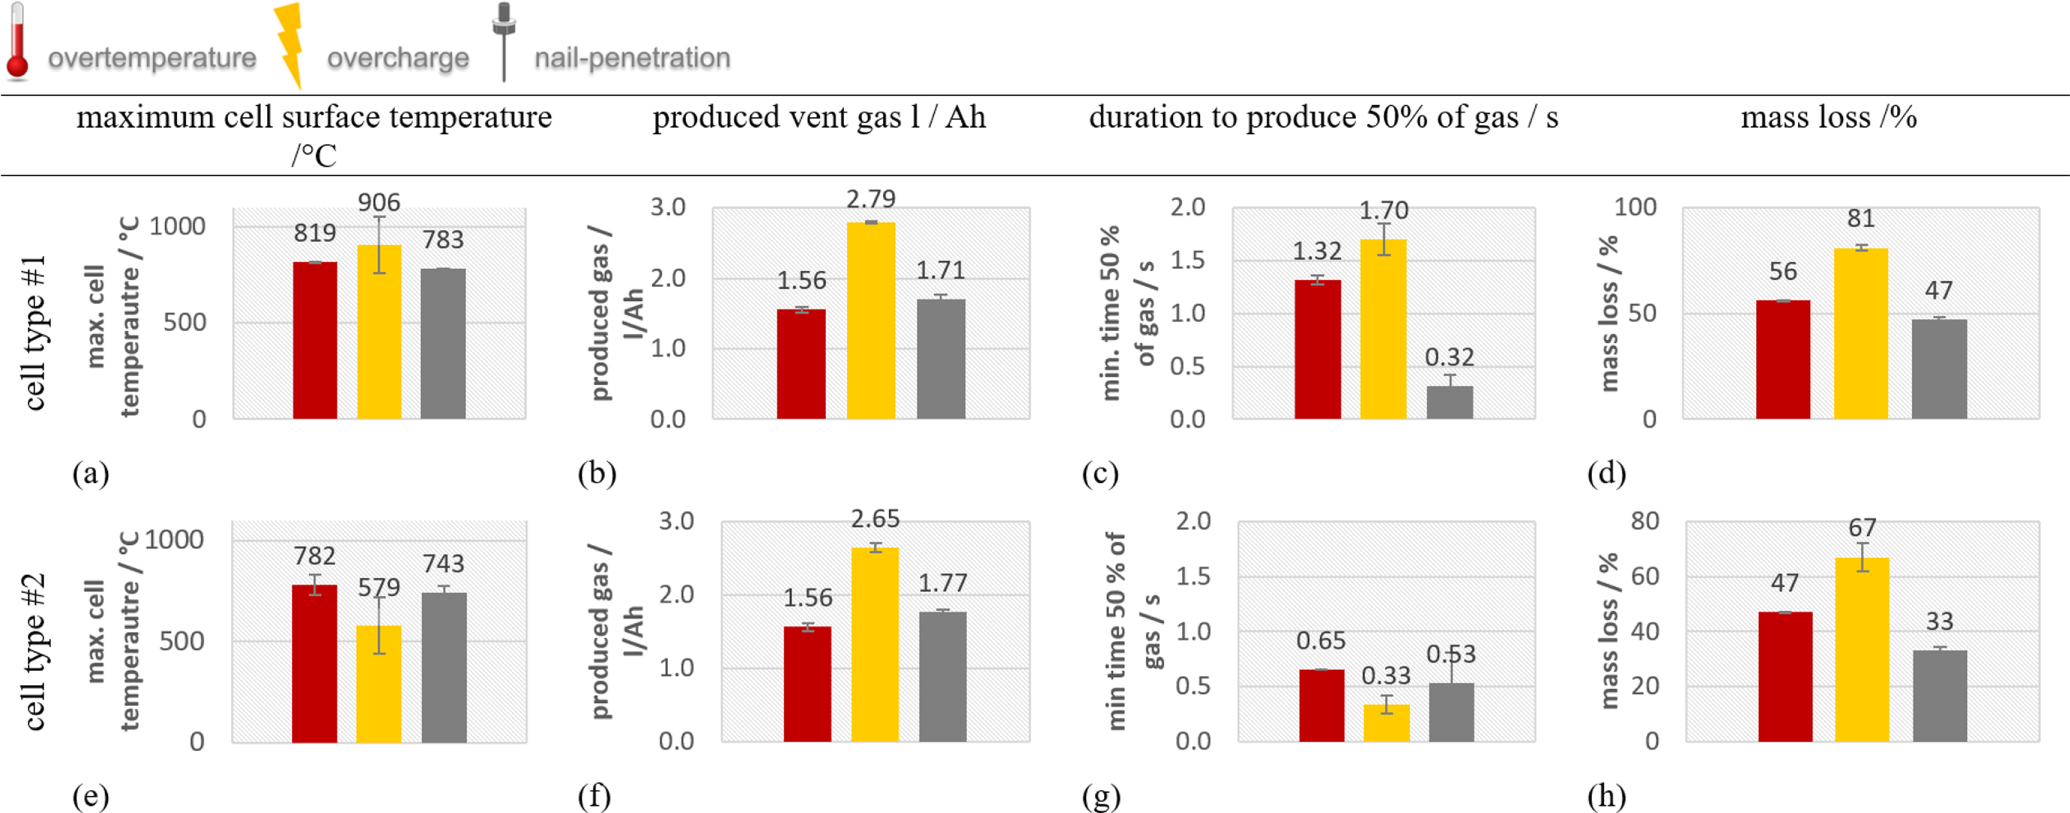
Figure 7. Safety relevant parameters compared in overtemperature (left bar, red), overcharge (middle bar, yellow) and nail-penetration (right bar, grey) TR experiments of automotive cell type ♯1 and ♯2 in comparison: (a) maximum reached cell surface temperature during the TR experiment; (b) the amount of produced vent gas per Ah; (c) the minimal venting duration to produce 50% of the gas and (d) the total loss of the cell mass during the whole experiment.
Download figure:
Standard image High-resolution imageNote, that since the characteristic venting rate is defined as the minimum duration when 50% of the gas is produced during the TR, the numeric value of the characteristic venting rate can exceed the numeric value of the maximum amount of released gas. The minimum duration to produce 50% of the vent gas during the TR is plotted in Fig. 7c for cell type ♯1 for all three TR trigger in comparison and in Fig. 7g for cell type ♯2.
Comparing the results of cell type ♯1 and ♯2
The TR duration (pressure increase during the TR) is in overtemperature and overcharged experiments for cell type ♯1 longer than for cell type ♯2. In Fig. 6e the pressure increases inside the reactor during overcharge of cell type ♯2 (hard case). For the hard case cell, the pressure increase is not as smoothly as it is for the pouch cell, and two peaks are visible before reaching the maximum pressure. This observation of two peaks can be seen even more clearly for the nail-penetrated hard case cell in Fig. 6f. The nail-penetrated 8 mm into each cell. The cell thickness of the cell type ♯2 is 28 mm; more than twice the nail-penetrated length. At the disassembling of the test setup after the TR, for cell type ♯2 two jelly rolls were visible inside the hard case. Therefore, the stepwise increasing pressure for the nail-penetrated hard case cell indicates that the penetrated jelly roll was triggered into the TR first, and the TR propagated to the second jelly roll after some seconds. A closer look to the thermocouples positioned on the bottom side of the cell confirms that the temperature at the bottom side (opposite to the nail-penetration position) increased some seconds after the temperature on the top of the cell, where the nail penetrated the cell.
The measured vent gas amounts per Ah of cell type ♯1 and cell type ♯2 are very similar for both cell types, if the TR trigger is the same! In this case, both cell types have the same capacity (Ah) and also similar cathode and anode chemistry, but different electrolyte composition (see Table I). Therefore, we assume that the exact electrolyte composition does not influence the produced vent gas amount. The minimum duration to produce 50% of the vent gas during the TR is different for both cell types (Figs. 7c and 7g). For cell type ♯1 the venting time for 50% of the vent gas is higher than for cell type ♯2, especially in the overtemperature and the overcharge trigger. Also, the duration of the venting during TR for cell type ♯1 in overtemperature and in overcharge is longer than for the hard case cell. This also results for cell type ♯1 in lower characteristic venting rates and less intense pressure peaks during the TR. In the nail-penetration experiment the duration of the venting during TR for cells with more than one jelly roll is longer, but a high characteristic venting rate is still possible.
Therefore, the cell and venting design as well as the packaging of active material layers seems to influence the reaction time of the TR, and consequently the safety relevant parameters such as the characteristic venting rate and maximum pressures reached inside a sealed volume.
Vent gas composition
The gas composition is measured about 10 min after each TR happened. In Fig. 8 the vent gas composition for (a) cell type ♯1 and (b) cell type ♯2 is compared using all three TR trigger. The main gas compounds produced during the TR of both EV cell types are CO, CO2, H2 and higher hydrocarbons. These main compounds are similar to published gas compositions at other NMC LIBs with commercial electrolyte solvents (such as EC, DEC, DMC, EMC) like published in Refs. 17, 37. Although the investigated cells in Ref. 37 are small cylindrical hard case 18650 cells with LCO/NMC and NMC cathode, DMC:EMC:EC:PC electrolyte. Beside the similar main gas components there are differences in gas compositions measured at the three TR trigger and the investigated cells:
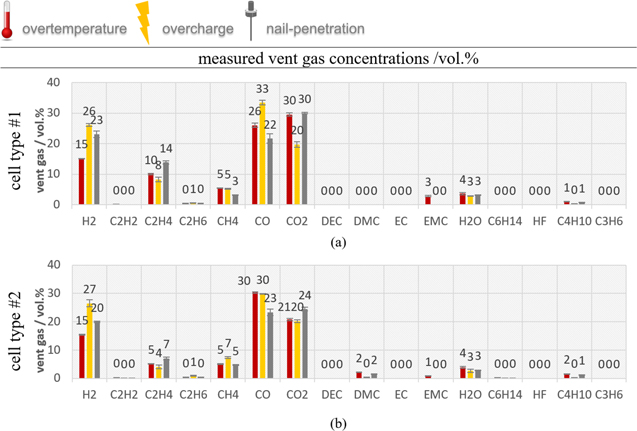
Figure 8. Vent gas composition in vol.% after the overtemperature (left bars, red), overcharge (middle bars, yellow) and nail-penetration (right bars, grey) experiments in comparison of automotive cell type ♯1 and ♯2.
Download figure:
Standard image High-resolution imageIn the overtemperature experiment
The main gas components are in descending order for cell type ♯1: 30% CO2, 26% CO, 15% H2, 10% C2H4, 5% CH4, 4% H2O, 3% EMC and below 1% C4H10, C2H6, C2H2. Cell type ♯2 produced in descending order: 30% CO, 21% CO2, 15% H2, 5% C2H4, 5% CH4, 4% H2O, 2% DMC, 2% C4H10, and lower 1% EMC, C2H6, C2H2, C6H14 (see Fig. 8 red bars). Differences in gas concentrations from both cell types are observed in C2H4, CO, CO2 and DMC. These differences will be discussed in the comparison of the results of both cell types. The average substance concentration values published by Koch et al. in Ref. 17 over 51 overtemperature triggered NMC LIBs fit to the presented results in this paper: 28% CO, 37% CO2, 22%H2, 6% C2H4 and 5% CH4.17 Our results are within the error bars of each gas component presented in Ref. 17, Fig. 4. The gases produced during the TR can be explained by SEI decomposition,18,38 electrolyte decomposition,39,40 NMC (cathode) degradation and reaction of the solvent with the cathode.27,32
In the overcharge experiment
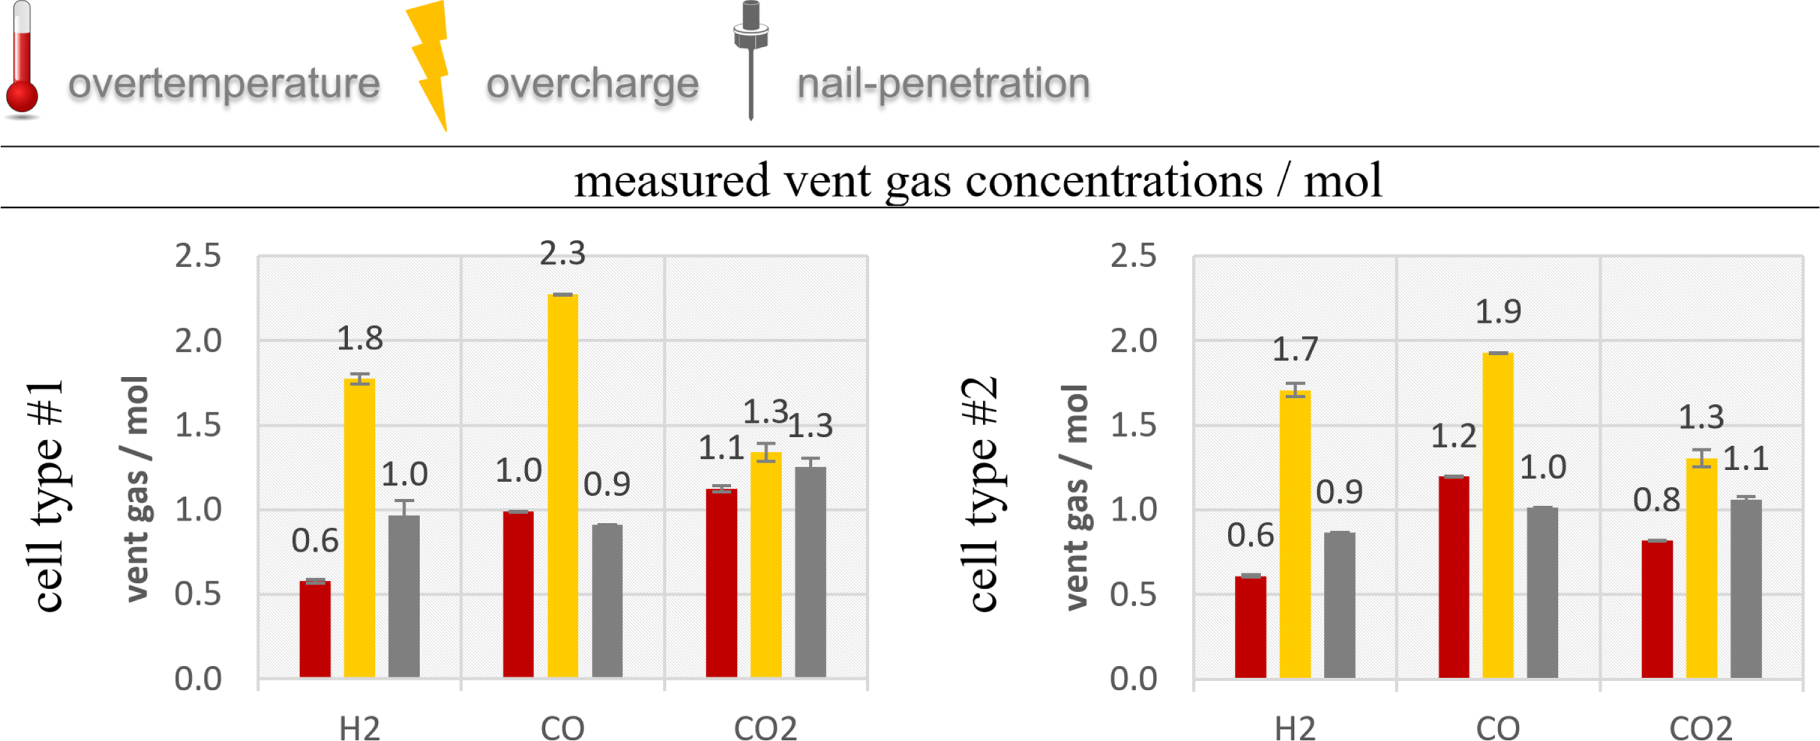
Beside higher amounts of gas than in overtemperature trigger both cell types produced significant higher amounts of CO and H2, and a little higher amount of CO2 and CH4. To emphasize the higher amounts of CO, H2 in overcharge experiments compared to overtemperature, Fig. 9 presents the main gas composition in mol for all three TR trigger. Cell type ♯1 produced in overcharge two times as much CO ((2.27 ± 0.05) mol) and three times as much H2 ((1.77 ± 0.03) mol) than in overtemperature and nail trigger. Cell type ♯2 also produced 1.6 times higher amounts of CO ((1.93 ± 0.06) mol) and 2.8 times higher H2 ((1.71 ± 0.04) mol) in overcharge experiments compared to overtemperature. In Fig. 8 yellow bars the relative vent gas composition is presented. Additional to the above-mentioned reactions producing gases, the lithium metal deposit on the anode surface reacts with the electrolyte under generation of heat and gas.33 According to Ohsaki et al. CO and CO2 were mainly produced at the cathode side during overcharge and on the anode side the main component is H2 and small amounts of CH4, C2H4, C2H6, CO and CO2 were measured41.

Figure 9. Main vent gas components converted into mol after the overtemperature (left bars, red), overcharge (middle bars, yellow) and nail-penetration (right bars, grey) experiments in comparison of automotive cell type ♯1 and ♯2. The concentration of the gas component H2, CO and CO2 in the vent gas in vol.% multiplied with the measured amount of released vent gas nv in mol gives the concentration of the gas component in mol.
Download figure:
Standard image High-resolution imageIn the nail triggered TR
Both cell types produced the lowest CO volume percent values and the highest C2H4 value of all three triggers. The H2 values are lower than in the overcharge experiment, but higher than in overtemperature (see grey bars in Fig. 8 and Fig. 9). CO2 values are increased for the cell type ♯2 compared to the overtemperature trigger. Diaz et al. observed for nail-penetrated cells without TR less toxic gas than in thermal abuse using cells with the same state-of-charge (SOC) (100%).12 Although Diaz et al. refers to gas results without TR, we also observed lower CO values in the nail-penetration experiments than in overtemperature experiments.
The gas compositions measured in the repeated experiments show high agreement and for most gas components deviations between the two measured values were below 3%. Exceptions are in some experiments the values of H2O, higher hydrocarbons with low concentrations such as C2H2, C2H4 and C2H6 and in nail-penetration tests the CO concentration.
We assume that the trigger and consequently the reaction mechanism and the reached temperatures influences the decomposition reactions and the resulting vent gas composition. The influence of temperature inside the cell during the reactions on the gas composition was also stated by Fernandez et al. in Ref. 13.
Comparing the results of cell type ♯1 and ♯2
For both cell types significant amounts of CO were produced, especially in overtemperature and overcharge experiments. In overcharge experiments the CO amount was higher than the CO2 amount. The observation of CO2:CO ratio is less than one can be explained by the high gravimetric energy density of both cell types. As observed by Koch et al. the CO2:CO ratio decreases with increasing gravimetric energy density of the cells.17 This can also be observed in the overheated LCO/NMC cell by Golubkov et al., which produced significant higher CO values than the NMC cells with lower energy density.37
The exact gas composition varies with different electrolyte composition. In this case, the active material of both cell types is very similar, but different electrolyte compositions are used. Internal investigations of car manufacturers reveal that in cell type ♯1 the main electrolyte components are EC:EMC (1:1) and in cell type ♯2 EC:DMC:EMC (2:3:3). In Figs. 8a and 8b different electrolyte vapor is identified for both cell types. For cell type ♯1 EMC was identified, but no EC could be identified. EC is very unlike to be measured with the presented gas analysis setup. We assume that parts of EC decompose and parts condensate inside the TR reactor or before the gas analysis section, because the boiling point of EC is higher than the gas temperature inside the reactor. For cell type ♯2 DMC and EMC could be measured. Typical decomposition reactions of electrolyte components such as EC are CO2, CO, C2H4, EMC, DEC,29,39 for EMC: CO2, CO, DMC, DEC, for DEC CO2, C2H6,39 and for DMC: CO, CO2, CH4, C2H6, H2O.29,31,38 Major varying gas concentrations between both cell types are observed in C2H4, CO, CO2 and DMC values. Onuki et al. observed that C2H4 was only formed from EC.39 Cell type ♯1 produced significant higher C2H4 concentrations at all three triggers (twice as much than cell type ♯2) and also CO2 values were higher than for cell type ♯2. This observation correlates with the significant higher amount of EC in cell type ♯1 (twice as much) compared to cell type ♯2. Therefore, we assume that the higher C2H4 amount in the vent gas composition of cell type ♯1 is because of the higher amount of decomposed EC. Only minor varying gas concentrations were measured in H2 and CH4 values.
In the presented results no hydrogen fluoride (HF) was identified with the FTIR spectrometer inside the FTIR gas measurement chamber. Although it is assumed that small amounts of HF were released by the cells according to,42,43 but the highly reactive HF reacted with materials inside the test reactor, the analysis pipes and the ejected particles. Additionally, we assume that modern mass produced EV cells produce less HF than older cells. We measured inside our test setup for an older aged 18 Ah cell with NMC/LTO chemistry 66 ppm (0.396 mmol) HF after the TR21 and for another modern automotive pouch cell 0 ppm HF.3
Mass loss
In all experiments the TR could be triggered, and the cells ejected gas and particles during the TR. In Figs. 7d and 7h the mass losses of the investigated cells during the TR including the experiment after-treatment are compared for all three TR trigger. In the overtemperature triggered TR cell type ♯1 lost (56 ± 1)% of the initial weight and cell type ♯2 (47 ± 1)% during the whole TR experiment and the experiment after treatment. These results are comparable with reported mass loss of 15%–60% for NMC cells with 20–81 Ah in overtemperature trigger in Ref. 17. The overcharged cells lost significant higher mass than in overtemperature trigger. In both repeated overcharged hard case cells, the whole jelly roll was found outside of the metal can after the experiment. In the nail triggered TR both cell types had the lowest mass loss of all three trigger. The reduced mass loss for nail-penetrated cells compared to overtemperature trigger was also observed by Diaz et al. in Ref. 12. Diaz et al. explains the reduced mass loss in nail-penetration "as the main reaction happening was the boiling of electrolyte solvents after opening the batteries." In the presented results the nail got stuck in the cell and was removed during disassembly after the experiment. The nail inside the cell may have prevented further particle emission.
Comparing the results of cell type ♯1 and ♯2
At each tested TR trigger cell type ♯1 lost higher amounts of mass than cell type ♯2. This observation is not consistent with the identified higher mass loss of hard case cells compared to pouch cells of Koch et al. in Ref. 17. Koch et al. explains the observation of higher mass loss at hard case cells with the higher stream velocities through the burst plate.17 We assume, that the different casing and the different gravimetric energy density influences the mass loss. For cell type ♯2, the metal casing has a higher mass than the pouch foil and this metal casing contributes to the measurement of the weight. Beside the casing, the pouch cell type ♯1 might lost additionally higher amounts of mass than the hard case cell type ♯2, because cell type ♯1 has a higher gravimetric energy density.
Comparing the trigger
In overtemperature and overcharge experiments a first venting before the TR could be measured at both cell types. For nail-penetration only one venting starting immediately after the nail-penetration was observed.
The presented results show that overcharge triggered TR can be harsher than other abuse triggers such as overtemperature and nail-penetration. This is in good agreement with Ref. 11.For both cell types in the overcharge experiments, significantly more gas is produced, a higher mass loss is observed and the gas components had higher volume percent in flammable, explosive and toxic gas compounds such as H2 and CO than in overtemperature or nail-penetration. A reason for the harsher TR behavior might be the additional energy filled into the cells, the extreme delithiation and destabilization of the cathode and the lithium metal deposits on the anode surface. Although, overcharge experiments of the presented cell types were proofed to end up in a more severe abuse than thermal or nail-penetrated cells, our results partly agree with the statement of Larsson et al. in Ref. 15 that the abuse by overcharge and heating can end up in more severe abuse, due to the input of electric power or heat. We can confirm the statement for overcharge, but we cannot confirm the statement for overtemperature.
Table III presents a summary of safety relevant parameters of the two tested cell types during and after TR for all three different triggers.
Table III. Summary of safety relevant parameters of two automotive cell types in overtemperature, overcharge and nail-penetration abuse tests in comparison.
| Overtemperature | Overcharge | Nail-penetration | ||||
|---|---|---|---|---|---|---|
| cell type ♯1 pouch | cell type ♯2 hard case | cell type ♯1 pouch | cell type ♯2 hard case | cell type ♯1 pouch | cell type ♯2 metal can | |
| first vent | yes | yes | yes | yes | no | no |
 (°C) (°C) |
121 ± 1 | 138 ± 1 | — | — | — | — |
| SOCmax | 100 | 100 | 146 ± 1 | 147 ± 1 | 100 | 100 |
| TR | yes | yes | yes | yes | yes | yes |
 (°C) (°C) |
206 ± 1 | 192 ± 1 | — | — | — | — |
 (°C) (°C) |
204 ± 1 | 190 ± 2 | 82 ± 17 | 96 ± 4 | — | — |
 (°C) (°C) |
819 ± 5 | 782 ± 50 | 906 ± 146 | 579 ± 139 | 783 ± 1 | 743 ± 33 |
| duration TR venting (s) | 3.50 ± 0.01 | 2.00 ± 0.01 | 5.2 ± 0.8 | 1.1 ± 0.1 | 3.1 ± 0.9 | 11.5 ± 2.5 |
| amount of gas (mol) | 3.8 ± 0.1 | 3.8 ± 0.1 | 6.9 ± 0.1 | 6.5 ± 0.2 | 4.2 ± 0.2 | 4.3 ± 0.1 |
| venting rate ̇ch (l s−1) |
34 ± 2 | 67 ± 4 | 47 ± 4 | 250 ± 56 | 182 ± 65 | 140 ± 76 |
| main gas compounds | CO, H2, CO2 | CO, H2, CO2 | CO, H2, CO2 | CO, H2, CO2 | CO, H2, CO2 | CO, H2, CO2 |
| cH2 (vol%) | 15 ± 1 | 15 ± 1 | 26 ± 1 | 25 ± 1 | 23 ± 1 | 20 ± 1 |
| cCO (vol%) | 26 ± 1 | 30 ± 1 | 33 ± 1 | 30 ± 1 | 22 ± 1 | 23 ± 1 |
| mass loss (%) | 56 ± 1 | 47 ± 1 | 81 ± 1 | 67 ± 5 | 47 ± 1 | 33 ± 1 |
Thermal behavior
In each experiment independent of the trigger and the cell design the maximum measured temperature was above 718 °C. Under consideration of the standard deviation of measured temperature values and different cell design all three TR trigger resulted for both cell geometries in similar  and
and  In overtemperature and in nail-penetration the SOC is 100% and therefore, we assume that the delithiation of the cathode and the lithiation of the anode are the same. Here the
  values are comparable. Cell type ♯1 reached in nail-penetration the lowest
  values and in overcharge the highest (see Figs. 7a and 7e). Cell type ♯2 reached the lowest
  values in overcharge experiments due to the ejection of the jelly roll during the overcharge and the highest value in overheated TR.
Vent gas emission
Cell type ♯1 and ♯2 produced in total significantly more gas in overcharge than in overtemperature and nail-penetration experiments. Overtemperature triggered cells produced the lowest gas amounts of the three tested triggers. For the amount of produced gas for overtemperature triggered NMC cells in literature values between 1.2–2 l Ah−1 are reported.17,22,23 The measured values of both cell types in this publication fit into the reported gas amount per liter for heat trigger. No literature was found presenting the gas amount per Ah at NMC cells triggered by overcharge or nail-penetration. But the presented experiments show that overcharge trigger forces the batteries to produce significantly more gas per Ah than using other trigger methods. The venting rates ̇ch are for overtemperature TR lower than for overcharge or nail-penetration trigger. Concerning the venting rate ̇ch nail-penetration trigger as well as overcharge for hard case cells might challenge closed battery packs most.
Vent gas composition
The trigger influences the vent gas composition, especially the CO, CO2, H2, C2H4, CH4, and electrolyte concentrations. Beside higher amounts of gas are produced in overcharge tests, for both cell types the highest H2 values are measured in the overcharge failure case and the least H2 values in the overtemperature trigger. Nail-penetration trigger forced both cell types to produce higher of C2H4 and CO2 vol% values and lower CH4 vol% values that in the other two triggers.
Mass loss
The highest mass loss was observed for overcharged cell and the lowest mass loss for nail-penetrated cells.
Reproducibility
The experiments were reproducible in the categories thermal, electrical and mechanical behavior. The presented standard deviation of safety relevant parameters in Table III shows, that deviations of the values 
 are lower than 1% of the measured value. Also, the deviations in the gas composition values of the main safety relevant gases such as CO and H2 are in overtemperature and overcharge experiments below 1% of the measured values. These values are rounded up to 1% in Table III. Only the gas composition measured for the nail-penetrated cells vary about 5% of the measured value. A conservative accuracy analysis of the gas composition analysis with FTIR and GC in parallel also results in a 3%–6% relative accuracy of the measured gas value depending on the gas compound (see3). Therefore, the measured gas composition values for three different TR trigger are surprisingly in a good agreement. Although
  and
and  might depend on the thermocouple positions, which is limited, in most TR experiments the results fit together very well. For overtemperature and overcharge the deviation of the parameters duration of the venting during TR, the amount of vent gas, the venting rate and mass loss are also rounded up to the significant measurement values.
To sum up, the reproducibility of the experiments with the presented three TR trigger, overtemperature, overcharge and nail-penetration is given, and the results disagrees with the assertion of Feng et al. that there is a lack of reproducibility in nail-penetration and overcharge tests.11
Conclusions
The results show the influence of three different TR trigger (overtemperature, overcharge and nail-penetration) and two different cell design (pouch and prismatic hard case) to the TR results and safety relevant parameters. Both cell types are modern high capacity and high energy density mass produced cells. The TR results are compared in three main categories: thermal behavior, vent gas production and vent gas composition. The high impact of overcharge experiments on the amount of produced vent gas and the increased toxicity of the gas components is presented in this paper.
Comparison of the chosen trigger:
- The overcharge triggered TR was harsher than overtemperature and nail-penetration on both cell types and resulted in a higher amount of vent gas, a higher cell mass loss and the gas components shifted towards higher volume percent of flammable, explosive and toxic gas compounds such as H2 and CO.
- In all three TR triggers for both cell geometries and were above 718 °C and reached similar values. The lowest values were measured for the overcharged hard case cells, where the jelly roll was found outside the hard case after the experiments.
- The vent gas emission depends on the used trigger. Both cell types produced up to 2.8 l Ah−1 vent gas using the overcharge trigger. Up to 1.6 l Ah−1 using the overtemperature trigger and up to 1.7 l Ah−1 using nail-penetration. The venting rates ̇ch are for overtemperature TR lower than for overcharge or nail-penetration trigger. The duration of the venting during TR was for cell type ♯1 in nail-penetration the shortest and in overcharge the longest. In contrast to the pouch cell for the hard case cell the duration of the venting during TR was in overcharge the fastest and in nail-penetration the longest of all twelve experiments. Therefore, the venting rates depend on the TR trigger and on the cell type.
- The vent gas composition is also influenced by the used trigger. Variations were observed especially for CO, CO2, H2, C2H4, CH4, and electrolyte concentrations. At each cell type the highest H2 and CO values were measured in the overcharge failure case and the least H2 values in the overtemperature trigger. Nail-penetration trigger forced both cell types to produce higher C2H4 and CO2 vol.% values and lower CH4 vol.% values than for the other two triggers.
- The experiments were reproducible and safety relevant parameter have low deviation from one experiment to the other.


The two tested EV cell types showed differences in:
- Thermal behavior: The pouch cell bag opened in overtemperature trigger earlier at a lower surface temperature than the hard case cell. The second venting of cell type ♯1 happened at a higher average temperature than for cell type ♯2 in overtemperature trigger. for cell type ♯2, the hard case cell, reached at all three trigger types higher maximum values than the pouch cell.
- Vent gas emission: The different casing and cell design resulted in different total duration of the pressure increase during the TR in overtemperature and overcharged TR. The duration of the TR of cell type ♯1 was longer than for cell type ♯2, except for the nail-penetration test. For cell type ♯2 the venting time for 50% of the vent gas is lower than for cell type ♯1, what results in a higher characteristic venting rates and possibly higher pressure peaks during the TR itself.
- Vent gas composition: The main gas compounds produced during the TR were the same and also in similar magnitude, but the exact gas composition varies with different electrolyte composition. Major varying gas concentrations from both cell types are observed in C2H4, CO, CO2 and DMC values. Only minor changes were measured in H2 and CH4 values. Cell type ♯1 produced significant higher C2H4 concentrations at all three triggers, which can be explained with the higher amount of EC used in cell type ♯1 and also CO2 values were higher than for cell type ♯2.

The packaging of active material layers seems to influence the reaction time of the TR, and consequently safety relevant parameters such as the characteristic venting rate and maximum pressures reached inside a sealed volume. The reproducibility of the experiments is shown and confirmed with low standard deviations of the quantification of safety relevant parameters.
Acknowledgments
The publication was written at Virtual Vehicle Research GmbH in Graz, Austria. The authors would like to acknowledge the financial support within the COMET K2 Competence Centers for Excellent Technologies from the Austrian Federal Ministry for Climate Action (BMK), the Austrian Federal Ministry for Digital and Economic Affairs (BMDW), the Province of Styria (Dept. 12) and the Styrian Business Promotion Agency (SFG). Furthermore, the authors would like to acknowledge the support of the Vehicle Safety Institute, Graz University of Technology.